Changes in maximum lip-closing force after extraction and nonextraction orthodontic treatments
9
0
0
전체 글
(2) Choi et al • Changes in lip-closing force. INTRODUCTION The lip-closing function or lip pursing is an essential initial movement during various functions of the stomatognathic system, including food intake, chewing, swallowing, speech, and facial expressions.1,2 According to the equilibrium theory, the force exerted by the lips and tongue could be an important component for stability of the dentition.3,4 In addition, lip competency without any strain in the mandibular rest position is crucial for an attractive facial appearance.5 With regard to the lip force, primarily in the rest position, static pressure may have a remarkable impact on the teeth and jaws.6 Tomiyama et al.7 reported that the electromyographic activity of the orbicularis oris muscle in the clinical rest position was greater in subjects with incompetent lips than in those with competent lips. In contrast, other study showed that the electromyographic activity of the orbicularis oris muscle at rest was similar in subjects with competent lips and those with incompetent lips.8 However, thus far, there is disagreement regarding the resting lip force. The maximum strength of the lips is considered to reflect the forces from the lips.9 Some studies have reported a relationship between the lip-closing force and malocclusion or the facial morphology. Specifically, the lip-closing force was found to be weak in patients with bilateral cleft lip10 or mandibular asymmetry.11 Moreover, Doto and Yamada12 found that the lip-closing force was weaker in patients with skeletal Class II malocclusion than in those with skeletal Class III malocclusion. Meanwhile, Takehana et al.13 recently reported that the lipclosing force was correlated with the maxillary dental arch morphology, particularly the arch length and width, in patients with Class I malocclusion. Because orthodontic treatment changes the dental arch morphology, it could also alter the lip-closing force. The lip position and other related features may be changed by orthodontic or orthopedic treatment. Orthodontic extraction in patients with Class II division 1 (II/1) malocclusion or bialveolar protrusion can help in relieving the lip protrusion by facilitating retraction of the maxillary and mandibular incisors, thus resolving the lip incompetence and improving the facial profile.14,15 In addition to the enhancement of facial esthetics, an improvement in the lip-closing force after surgical-orthodontic approaches, such as orthognathic surgery16,17 and surgically assisted rapid palatal expansion18 was recently reported. Considering the previous studies, there have been few studies on the changes in the lip-closing force after orthodontic treatment and their correlation with dentofacial and dental arch dimensional changes. Therefore, the aims of this study were to evaluate the changes in the maximum lip-closing force (MLF) after. www.e-kjo.org. https://doi.org/10.4041/kjod.2020.50.2.120. orthodontic treatment with or without premolar extractions and verify the correlation of these changes with skeletal, dental, and soft tissue variables and the dental arch morphology. The null hypothesis was that there would be no significant difference in MLF between extraction and nonextraction orthodontic treatment.. MATERIALS AND METHODS This retrospective cohort study was reviewed and approved by the Institutional Review Board at Seoul National University Bundang Hospital (B-1703-387-101). A total of 32 consecutive patients were selected from adult patients who underwent comprehensive orthodontic treatment performed by an experienced orthodontist at Seoul National University Bundang Hospital (Seongnam Korea) between April 2012 and July 2016. Specifically, women who underwent orthodontic treatment with or without extraction of the four first premolars for the resolution of dental crowding and/or protrusion were considered eligible. Other inclusion criteria were as follows: a Class I or Class II (< 1/2 Class II) molar relationship, absence of a posterior crossbite/scissor bite, and competent lips (interlabial gap < 3.0 mm). Patients were excluded if they exhibited a skeletal pattern where ANB was > 5o or < 0o, skeletal asymmetry (menton deviation > 1 mm), cleft lip/palate, other craniofacial syndromes, and/or multiple missing teeth. The enrolled subjects were allocated to two groups. The extraction group comprised 15 women aged 24.6 ± 5.8 years who underwent extraction of the four first premolars. The nonextraction group comprised 17 women aged 28.6 ± 8.4 years who were treated without extraction. Lateral cephalograms were acquired and study models were fabricated before (T0) and after (T1) the treatment. All lateral cephalograms were traced and analyzed using V-ceph software ver. 6.0 (Osstem, Seoul, Korea) by an orthodontist (S.-H.K.) to evaluate the dentoskeletal and soft tissue changes in each subject (Figure 1). The same investigator evaluated changes in the dental arch morphology by measuring the study models using a digital caliper (Mitutoyo Corp., Kawasaki, Japan; Figure 2). MLF measurement At both T0 and T1, MLF was measured using the Lip De Cum LDC-110R ® device (Cosmos instruments Co. LTD, Tokyo, Japan). The lip-closure force indicator with the lip holder (Ducklings®) was connected to a sensor, and the measured value was converted to the SI unit for force (newton, N). All subjects were instructed to sit upright, position the lip holder between the lips, and close their lips with the maximum possible strength, while avoiding contact between the maxillary and mandibular. 121.
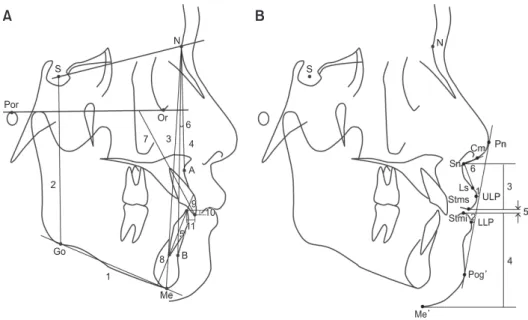
(3) Choi et al • Changes in lip-closing force. were performed using IBM SPSS Statistics ver. 22.0 for Windows (IBM Corp., Armonk, NY, USA). A p -value for < 0.05 was considered statistically significant. A high degree of reliability was found for all measurements. The mean intraclass correlation coefficients (95% confidence interval) for the cephalometric measurements, arch depth, intercanine width, intermolar width, and MLF were 0.941 (0.781 to 0.999), 0.987 (0.979 to 0.992), 0.997 (0.995 to 0.998), 0.994 (0.989 to 0.996), and 0.932 (0.890 to 0.958), respectively (p < 0.001 for all).. teeth (Figure 3). MLF was measured twice by a single evaluator, with a 5-minute interval between measurements. Subsequently, the average value was calculated and analyzed. Statistical analysis The sample size was determined according to the changes in MLF observed in our preliminary study using PASS 11 (NCSS, Kaysville, UT, USA), with an α level of 0.05 and a power of 80%. The results revealed that a minimum of nine patients per group was required. Depending on the normality of data as determined by the Shapiro–Wilk test, the paired t -test or the Wilcoxon signed-rank test was used to analyze changes (T1-T0) in the cephalometric and dental arch morphology measurements and MLF within each group. The independent t test or the Mann–Whitney U test was used to compare pretreatment variables (T0) and changes (T1–T0) in the cephalometric and dental arch variables and MLF between the two groups. Pearson’s correlation analysis was used to verify the associations between dentoskeletal changes and changes in MLF. All statistical analyses. A. RESULTS As presented in Table 1, the extraction and nonextraction groups showed no difference in the skeletal pattern at T0, although there were significant differences in the dental and soft tissue measurements. The extraction group exhibited significantly larger values for the angle between the long axis of the upper central incisor (U1) and the Frankfort horizontal (FH) plane (U1-FH; 123.43o vs. 114.18o), distance from Rickett’s E line (EL) to the. B N. N. S. S. Por Or. 6. 3. 7. 4. Cm Pn Sn. A 2 9 5 Go. 8. 6. 3 Ls 1 Stms ULP 10. 5. Stmi 2 LLP. 11. B. 4 Pog. 1 Me Me. Figure 1. Landmarks, reference planes, and measurements in cephalometric analyses. A, Dentoskeletal variables. S, Sella; N, nasion; Por, porion; Or, orbitale; Me, menton; Go, gonion; A, A point; B, B point; U1, upper central incisor; L1, lower central incisor; SN plane (S-N); FH plane, Frankfort horizontal plane (Or-Por); mandibular plane (Go-Me); 1, angle between FH plane and mandibular plane (FMA); 2, S to Go (posterior facial height, PFH); 3, N to Me (anterior facial height, AFH); 4, angle between the SN plane and N-A line (SNA); 5, angle between the SN plane and N-B line (SNB); 6, angle between the N-A line and N-B line (ANB); 7, angle between the long axis of U1 and the FH plane (U1-FH); 8, angle between the long axis of L1 and the mandibular plane (IMPA); 9, angle between the long axis of U1 and the long axis of L1 (interincisal angle); 10, overbite; 11, overjet. B, Soft tissue variables. Pn, Pronasale; Cm, columella; Sn, subnasale; Ls, labrale superius; ULP, upper lip point; LLP, lower lip point; Stms, lowest point on the upper lip; Stmi, highest point on the lower lip; Pog’, soft tissue pogonion; Me’, soft tissue menton; 1, Rickett’s E line (Pn-Pog’; EL) to ULP; 2, EL to LLP; 3, Sn to Stms; 4, Stmi to Me’; 5, interlabial gap (distance from Stms to Stmi); 6, nasolabial angle (angle between the Sn-Cm line and the Sn-Ls line). 122. https://doi.org/10.4041/kjod.2020.50.2.120. www.e-kjo.org.
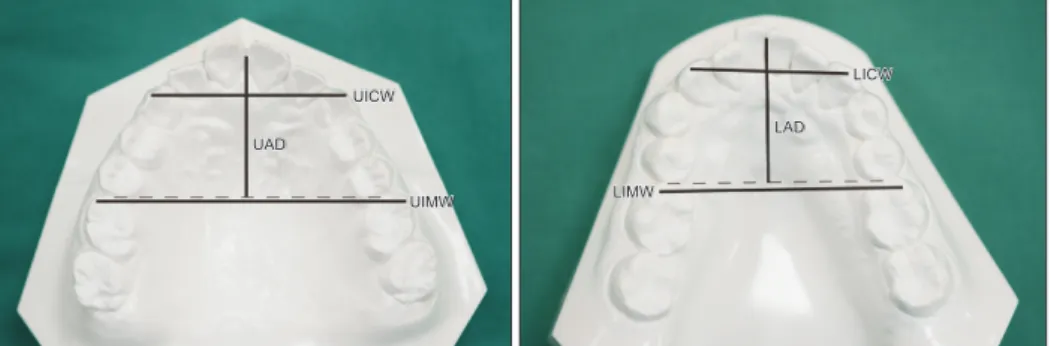
(4) Choi et al • Changes in lip-closing force. LICW UICW LAD UAD. UIMW. LIMW. Figure 2. Measurements of the dental arch morphology on study models. UICW/LICW, Distance between both canine cusp tips in the maxillary/mandibular arch; UIMW/LIMW, distance between the mesiobuccal cusp tips of both first molars in the maxillary/mandibular arch; UAD/LAD, distance from the contact point between the central incisors perpendicular to a line connecting the mesial contact points of both first molars in the maxillary/mandibular arch. upper lip point (ULP; 1.92 mm vs. −0.93 mm), distance from EL to the lower lip point (LLP; 4.09 mm vs. 0.44 mm; p < 0.001 for all comparisons), the incisor–mandibular plane angle (IMPA; 97.19o vs. 91.59o; p < 0.05), the lower intercanine width (LICW; 28.69 mm vs. 26.32 mm; p < 0.05), and the upper arch depth (UAD; 27.01 mm vs. 24.76 mm; p < 0.01), while it showed smaller values for the interincisal angle (111.03o vs. 125.84o; p < 0.001) and nasolabial angle (99.66o vs. 108.75o; p < 0.05). At T1, the extraction and nonextraction groups showed no significant differences in any cephalometric variable except IMPA (85.52o vs. 94.38o, respectively; p < 0.01), the interincisal angle (134.18o vs. 122.25o; p < 0.001), and EL to ULP (0.31 mm vs –1.00 mm; p < 0.05). Most dental arch-related variables showed significant differences between groups; these included (extraction vs. nonextraction) the upper intermolar width (UIMW; 50.24 mm vs. 52.65 mm; p < 0.01), UAD (20.71 mm vs. 25.19 mm; p < 0.001), LICW (28.61 mm vs. 26.11 mm; p < 0.01), the lower intermolar width (LIMW; 41.61 mm vs. 44.63 mm; p < 0.01), and the lower arch depth (LAD; 16.46 mm vs. 21.53 mm; p < 0.001). From T0 to T1, the extraction group exhibited significant decreases in U1–FH (−11.46o), IMPA (−11.68o), EL to LLP (−3.13 mm; p < 0.001 for all), EL to ULP (−1.61 mm; p < 0.01), UIMW (−4.01 mm), UAD (−6.29 mm), LIMW (−5.13 mm), and LAD (−5.71 mm; p < 0.001 for all). Meanwhile, the interincisal angle (23.15o; p < 0.01), overbite (1.04 mm; p < 0.01), and nasolabial angle (9.03o; p < 0.01; Table 2) exhibited increases. The nonextraction group showed significant increases in IMPA (2.78o) and LAD (0.79 mm; p < 0.05 for both) and a decrease in the interincisal angle (−3.59o; p < 0.05; Table 2). The decreases in U1 to FH, IMPA, EL to LLP, UIMW, LIMW, LAD (p < 0.001 for all), EL to ULP (p < 0.01), and UAD (p < 0.01), as well as the increases in the interincisal angle (p < 0.001), treatment duration (p < 0.001), overbite (p <. www.e-kjo.org. https://doi.org/10.4041/kjod.2020.50.2.120. Figure 3. Measurement of the lip-closing force using a lip holder (Ducklings®) connected to a sensor in the Lip De Cum LDC-110R® device. 0.05), and nasolabial angle (p < 0.01), were significantly greater in the extraction group than in the nonextraction group (Table 2). The extraction and nonextraction groups showed no significant difference in MLF at T0 (6.35 N vs. 7.92 N; Table 3). MLF significantly increased from T0 to T1 in the extraction group (3.25 N, p < 0.01), and this increase was significantly greater than that (0.69 N) in the nonextraction group (p < 0.05; Table 3). The increase in MLF was correlated with the decreases in IMPA (R = −0.379), LIMW (R = −0.452), LAD (R= −0.446; p < 0.05 for all), UIMW (R = −0.497; p < 0.01), and UAD (R = −0.490; p < 0.01) and the increase in the interincisal angle (R = 0.371; p < 0.05; Table 4).. 123.
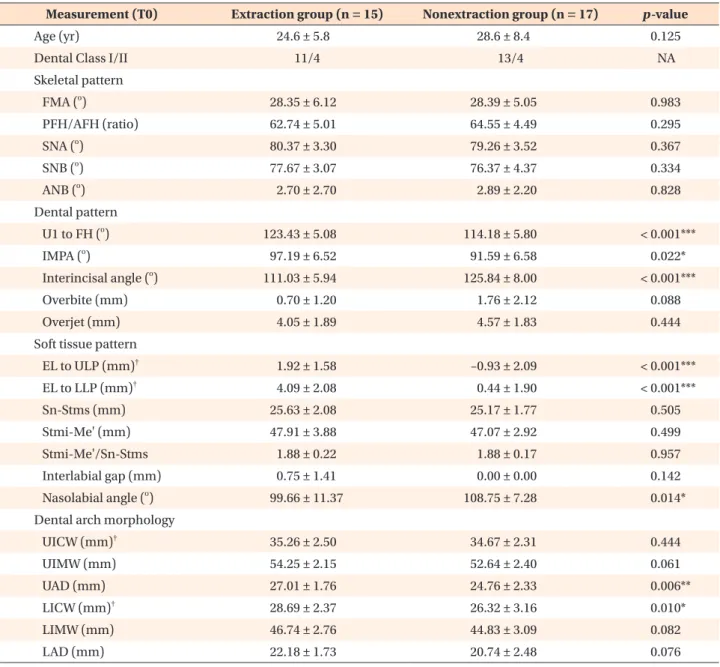
(5) Choi et al • Changes in lip-closing force. Table 1. Baseline age, dentoskeletal and dental arch variables in the extraction and nonextraction groups Measurement (T0) Age (yr). Extraction group (n = 15) 24.6 ± 5.8. Dental Class I/II. Nonextraction group (n = 17) 28.6 ± 8.4. 11/4. 13/4. p -value 0.125 NA. Skeletal pattern FMA (o). 28.35 ± 6.12. 28.39 ± 5.05. 0.983. PFH/AFH (ratio). 62.74 ± 5.01. 64.55 ± 4.49. 0.295. SNA (o). 80.37 ± 3.30. 79.26 ± 3.52. 0.367. SNB ( ). 77.67 ± 3.07. 76.37 ± 4.37. 0.334. ANB (o). 2.70 ± 2.70. 2.89 ± 2.20. 0.828. 123.43 ± 5.08. 114.18 ± 5.80. < 0.001***. 97.19 ± 6.52. 91.59 ± 6.58. 0.022*. 111.03 ± 5.94. 125.84 ± 8.00. < 0.001***. o. Dental pattern U1 to FH (o) IMPA (o) o. Interincisal angle ( ) Overbite (mm). 0.70 ± 1.20. 1.76 ± 2.12. 0.088. Overjet (mm). 4.05 ± 1.89. 4.57 ± 1.83. 0.444. EL to ULP (mm)†. 1.92 ± 1.58. –0.93 ± 2.09. < 0.001***. EL to LLP (mm)†. 4.09 ± 2.08. 0.44 ± 1.90. < 0.001***. Sn-Stms (mm). 25.63 ± 2.08. 25.17 ± 1.77. 0.505. Stmi-Me' (mm). Soft tissue pattern. 47.91 ± 3.88. 47.07 ± 2.92. 0.499. Stmi-Me'/Sn-Stms. 1.88 ± 0.22. 1.88 ± 0.17. 0.957. Interlabial gap (mm). 0.75 ± 1.41. 0.00 ± 0.00. 0.142. o. Nasolabial angle ( ). 99.66 ± 11.37. 108.75 ± 7.28. 0.014*. 35.26 ± 2.50. 34.67 ± 2.31. 0.444. Dental arch morphology UICW (mm)† UIMW (mm). 54.25 ± 2.15. 52.64 ± 2.40. 0.061. UAD (mm). 27.01 ± 1.76. 24.76 ± 2.33. 0.006**. LICW (mm)†. 28.69 ± 2.37. 26.32 ± 3.16. 0.010*. LIMW (mm). 46.74 ± 2.76. 44.83 ± 3.09. 0.082. LAD (mm). 22.18 ± 1.73. 20.74 ± 2.48. 0.076. Values are presented as mean ± standard deviation or number only. T0, Before treatment; NA, not applicable. *p < 0.05, **p < 0.01, ***p < 0.001. Independent t -tests or †Mann–Whitney U tests were performed. See Figures 1 and 2 for definitions of each landmark or measurement.. DISCUSSION Orthodontic treatment involving premolar extraction is commonly used for the correction of dentoskeletal malocclusion, which may be accompanied by an imbalance in the perioral musculature. Orthodontic treatment with or without extraction causes morphological changes in the perioral soft tissue, including the lips. Thus, it has been of great interest to orthodontists from the perspective of facial esthetics.14,15 However, research on lip func-. 124. tion is lacking. A comparison of the lip-closing force before and after orthodontic treatment may provide insights into the recovery of stomatognathic functions and improvement of facial esthetics. Despite these considerations, changes in the lip-closing force after various orthodontic treatments have rarely been studied. Therefore, the present study evaluated the changes in MLF after orthodontic treatment with or without premolar extractions and determined the relationships between these changes and hard/soft tissue changes.. https://doi.org/10.4041/kjod.2020.50.2.120. www.e-kjo.org.
(6) Choi et al • Changes in lip-closing force. Table 2. Comparison of the treatment time and the amount of changes in the cephalometric and dental arch variables in each group and between the groups during treatment Measurement (T1–T0). Extraction group (n = 15). Nonextraction group (n = 17) †. p -value§. Mean ± SD. p -value. Mean ± SD. p -value†. −0.02 ± 0.60. 0.885. 0.10 ± 0.30. 0.199. 0.49. 0.14 ± 0.39. 0.181. −0.06 ± 0.33. 0.485. 0.189∥. ΔSNA (°). −0.24 ± 0.36. 0.020*. 0.07 ± 0.13. 0.031*. 0.005**. ΔSNB (°). −0.40 ± 0.45. 0.004**. 0.08 ± 0.13. 0.018*. 0.001**,∥. ΔANB (°). 0.15 ± 0.33. 0.099. −0.01 ± 0.17. 0.753. 0.099. 0.71 ± 3.82. 0.456. < 0.001***. Skeletal pattern ΔFMA (°) ΔPFH/AFH (ratio). Dental pattern ΔU1 to FH (°). −11.46 ± 5.95. < 0.001***. ΔIMPA (°). −11.68 ± 4.27. < 0.001***. 2.78 ± 4.50. 0.021*. < 0.001***. 23.15 ± 8.33. < 0.001***. −3.59 ± 6.82. 0.045*. < 0.001***. ΔOverbite (mm). 1.04 ± 1.04. 0.002**. −0.01 ± 1.57. 0.972. 0.032*. ΔOverjet (mm). −0.03 ± 1.76. 0.952. −0.58 ± 1.63. 0.161. 0.365. −1.61 ± 1.62. 0.002**. −0.07 ± 0.89. 0.959‡. 0.004**. ‡. ΔInterincisal angle (°). Soft tissue pattern ΔEL to ULP (mm) ΔEL to LLP (mm). −3.13 ± 1.97. < 0.001***. −0.15 ± 0.70. 0.492. < 0.001***. ΔSn-Stms (mm). 0.29 ± 1.08. 0.317. 0.11 ± 0.37. 0.224. 0.313∥. ΔStmi-Me' (mm). 0.35 ± 1.55. 0.395. 0.33 ± 1.27. 0.093. 0.941∥. ΔStmi-Me'/Sn-Stms. −0.01 ± 0.08. 0.572. 0.01 ± 0.04. 0.517. 0.442. Δinterlabial gap (mm). −0.75 ± 1.41. ΔNasolabial angle (°). 9.03 ± 8.41. 0.00 ± 0.00. 0.202. 0.001**. −0.61 ± 2.83. 0.389. 0.002**,∥. Dental arch morphology ΔUICW (mm). −0.34 ± 2.54. 0.622. −0.29 ± 2.47. 0.943‡. 0.953∥. ΔUIMW (mm). −4.01 ± 1.89. < 0.001***. 0.02 ± 2.76. 0.297‡. < 0.001***,∥. ΔUAD (mm). −6.29 ± 2.07. 0.001**,‡. 0.42 ± 1.60. 0.201‡. < 0.001***. ‡. ΔLICW (mm). −0.09 ± 4.09. 0.470. −0.22 ± 2.61. 0.736. 0.444∥. ΔLIMW (mm). −5.13 ± 4.31. 0.001**,‡. −0.20 ± 2.63. 0.758. < 0.001***,∥. ΔLAD (mm). −5.71 ± 1.48. < 0.001***. 0.79 ± 1.54. 0.015*,‡. < 0.001***,∥. 30.87 ± 6.41. NA. 18.94 ± 5.49. Treatment time (mo). NA. < 0.001***. T0, Before treatment; T1, after treatment; SD, standard deviation; NA, not applicable. *p < 0.05, **p < 0.01, ***p < 0.001. † Paired t -test. ‡ Wilcoxon signed-rank test. § Independent t -test. ∥ Mann–Whitney test. See Figures 1 and 2 for definitions of each landmark or measurement.. The voluntary MLF is used as a parameter for lip function evaluation,19 and an available measuring tool that noninvasively facilitates quantitative assessments has been reported for this purpose. Thus, MLF has been used as a functional indicator for the lip or perioral muscles in studies on the effects of the lips on the craniofacial structure or studies involving measurement of the lip. www.e-kjo.org. https://doi.org/10.4041/kjod.2020.50.2.120. strength after surgical–orthodontic treatment.16-18,20 The lip force can be affected by various factors, including age, gender, and skeletal and dental patterns;17,18,21-24 therefore, we only included women with Class I and mild Class II malocclusion in the present study. At T0, the extraction and nonextraction groups exhibited no significant differences in the vertical and. 125.
(7) Choi et al • Changes in lip-closing force. Table 3. Comparison of the baseline and the amount of changes in the MLF in each group, between the groups and in all groups MLF (N). Extraction group (n=15) †. Nonextraction group (n=17) †. Total (n=32). p -value‡. Mean ± SD. p -value. Mean ± SD. p -value. Mean ± SD. p -value†. T0. 6.35 ± 2.54. NA. 7.92 ± 2.99. NA. 7.18 ± 2.85. NA. 0.118. T1–T0. 3.25 ± 3.10. 0.001**. 0.69 ± 2.63. 0.35. 1.89 ± 3.10. 0.002**. 0.018*. MLF, Maximum lip-closing force; N, newton; SD, standard deviation; T0, before treatment; T1, after treatment; T1–T0, change from T0 to T1; NA, not applicable. *p < 0.05, **p < 0.01. † Paired t -tests were performed to compare differences between T0 and T1 in each group or total subjects. ‡ Independent t -test was performed to compare intergroup difference between extraction and nonextraction groups.. sagittal skeletal measurements (Table 1), which indicated a similar skeletal pattern in the two groups. However, with regard to the dental and soft tissue patterns and dental arch morphology, the extraction group exhibited greater incisor proclination, lip protrusion, UAD, and LICW than did the nonextraction group (Table 1). While MLF at T0 was lower in the extraction group than in the nonextraction group (6.35 N vs. 7.92 N), the difference was not significantly different (Table 3). This result was consistent with the findings of Ingervall and Janson,25 who reported that the lip strength did not correlate with the dentoalveolar cephalometric variables in patients with Class I or Class II malocclusion. Partal and Aksu26 also found that the vertical lip pressure did not differ between subjects with Class I malocclusion and those with Class II division 2 (II/2) malocclusion. In contrast, some studies suggested that the lip strength in individuals with Class II/1 malocclusion was lower than that in individuals with Class I malocclusion.21,27 Posen9 reported that subjects with bimaxillary protrusion exhibited a low lip strength while those with Class II/2 malocclusion exhibited high lip strength. Jung et al.20 reported that maxillary incisor proclination was related to the closing force of the upper lips. These inconsistent results could be attributed to differences in the area of measurement and methodology according to the measuring tools used during voluntary lip closing. In the present study, the extraction group showed significantly decreased lip protrusion and incisor retraction relative to those in the nonextraction group from T0 to T1; this was because of closure of the extraction space (Table 2). Similar results were reported in previous studies on facial profile changes after extraction treatment.15,28 In addition, the decreases in the arch depth and molar width in both the maxilla and mandible were more pronounced in the extraction group than in the nonextraction group. This finding is consistent with those of Aksu and Kocadereli29 and Herzog et al.,30 who found that the maxillary and mandibular intermolar and perimeter measurements after treatment involving premolar extraction were decreased relative to those after. 126. nonextraction treatment in patients with Class I malocclusion. We found that the increase in MLF after treatment was significantly greater in the extraction group than in the nonextraction group (Table 3). Moreover, cephalometric variables, namely IMPA and the interincisal angle, as well as most dental arch-related variables (UIMW, UAD, LICW, LIMW, and LAD) exhibited differences between the two groups at T1; this was not observed at T0. We also found significant correlations between the change in MLF and the changes in UIMW, UAD, LIMW, LAD, IMPA, and the interincisal angle at T1. These results imply that the increase in MLF could be associated with the decrease in not only the incisor inclination but also the anteroposterior and transverse arch dimensions in the maxilla and mandible. A decrease in the arch depth and width after extraction orthodontic treatment might influence the function of the buccinator and orbicularis oris muscles during lip closure. A previous cross-sectional study involving untreated patients with Class I malocclusion suggested that the function of the buccinator and orbicularis oris muscles affects the arch morphology.13 However, it remains unclear whether a change in form may affect muscle function, or vice versa . The present study has some limitations. The tool used for MLF measurement cannot differentiate the effects of the upper and lower orbicularis oris muscles. In addition, the lip-closing force may be associated with the tongue force,27 which was not considered in this study. Considering that muscles adapt to changed circumstances, further investigations are needed to evaluate long-term or time-course changes in the perioral muscle activity or lip-closing force after different types of orthodontic or surgical–orthodontic treatments.. CONCLUSION In conclusion, the null hypothesis for this study was rejected. The findings suggest that MLF increases to a greater extent during extraction orthodontic treatment. https://doi.org/10.4041/kjod.2020.50.2.120. www.e-kjo.org.
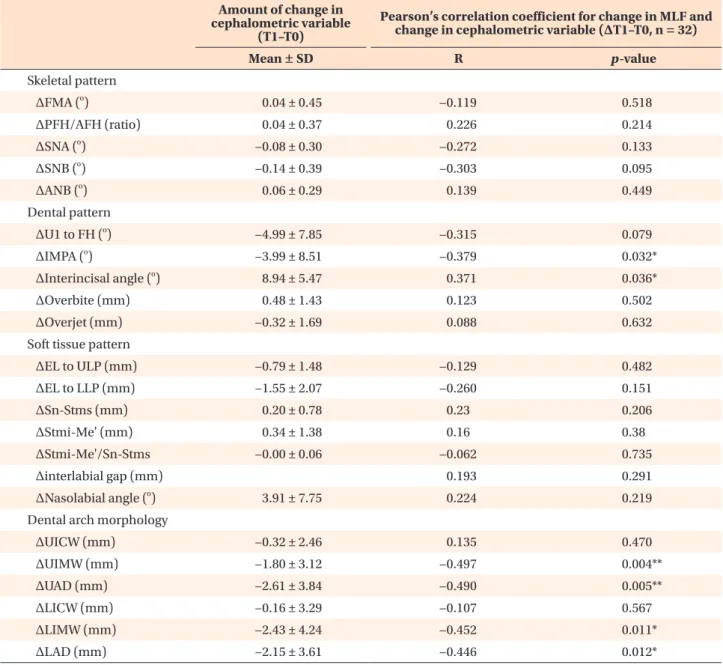
(8) Choi et al • Changes in lip-closing force. Table 4. Correlations between changes in measured dentoskeletal variables and changes in the MLF after extraction or nonextraction orthodontic treatment Amount of change in cephalometric variable (T1–T0) Mean ± SD. Pearson’s correlation coefficient for change in MLF and change in cephalometric variable (ΔT1–T0, n = 32) R. p -value. Skeletal pattern ΔFMA (o). 0.04 ± 0.45. −0.119. 0.518. ΔPFH/AFH (ratio). 0.04 ± 0.37. 0.226. 0.214. o. −0.08 ± 0.30. −0.272. 0.133. o. ΔSNB ( ). −0.14 ± 0.39. −0.303. 0.095. ΔANB (o). 0.06 ± 0.29. 0.139. 0.449. ΔU1 to FH (o). −4.99 ± 7.85. −0.315. 0.079. ΔIMPA (o). −3.99 ± 8.51. −0.379. 0.032*. 8.94 ± 5.47. 0.371. 0.036*. ΔOverbite (mm). 0.48 ± 1.43. 0.123. 0.502. ΔOverjet (mm). −0.32 ± 1.69. 0.088. 0.632. ΔEL to ULP (mm). −0.79 ± 1.48. −0.129. 0.482. ΔEL to LLP (mm). −1.55 ± 2.07. −0.260. 0.151. ΔSn-Stms (mm). 0.20 ± 0.78. 0.23. 0.206. 0.34 ± 1.38. 0.16. 0.38. −0.00 ± 0.06. −0.062. 0.735. 0.193. 0.291. 3.91 ± 7.75. 0.224. 0.219. ΔUICW (mm). −0.32 ± 2.46. 0.135. 0.470. ΔUIMW (mm). −1.80 ± 3.12. −0.497. 0.004**. ΔUAD (mm). −2.61 ± 3.84. −0.490. 0.005**. ΔLICW (mm). −0.16 ± 3.29. −0.107. 0.567. ΔLIMW (mm). −2.43 ± 4.24. −0.452. 0.011*. ΔLAD (mm). −2.15 ± 3.61. −0.446. 0.012*. ΔSNA ( ). Dental pattern. o. ΔInterincisal angle ( ). Soft tissue pattern. ΔStmi-Me' (mm) ΔStmi-Me'/Sn-Stms Δinterlabial gap (mm) o. ΔNasolabial angle ( ) Dental arch morphology. Pearson's correlation analysis was performed. MLF, Maximum lip-closing force; T1, after treatment; T0, before treatment; T1–T0, changes from T0 to T1; SD, standard deviation; R, correlation coefficients. *p < 0.05, **p < 0.01. See Figures 1 and 2 for definitions of each landmark or measurement.. than during nonextraction orthodontic treatment. This increase may be correlated with the changes in the maxillary and mandibular arch depths and intermolar widths as well as incisor inclination.. CONFLICTS OF INTEREST No potential conflict of interest relevant to this article. www.e-kjo.org. https://doi.org/10.4041/kjod.2020.50.2.120. was reported.. REFERENCES 1. Nakatsuka K, Adachi T, Kato T, Oishi M, Murakami M, Okada Y, et al. Reliability of novel multidirectional lip-closing force measurement system. J Oral Rehabil 2011;38:18-26.. 127.
(9) Choi et al • Changes in lip-closing force. 2. Kaede K, Kato T, Yamaguchi M, Nakamura N, Yamada K, Masuda Y. Effects of lip-closing training on maximum voluntary lip-closing force during lip pursing in healthy young adults. J Oral Rehabil 2016;43:169-75. 3. Weinstein S, Haack DC, Morris LY, Snyder BB, Attaway HE. On an equilibrium theory of tooth position. Angle Orthod 1963;33:1-26. 4. Proffit WR. Equilibrium theory revisited: factors influencing position of the teeth. Angle Orthod 1978;48:175-86. 5. Shaw WC, Addy M, Ray C. Dental and social effects of malocclusion and effectiveness of orthodontic treatment: a review. Community Dent Oral Epidemiol 1980;8:36-45. 6. Chen S, Cai Y, Chen F. Lip closing force of Class III patients with mandibular prognathism: a case control study. Head Face Med 2014;10:33. 7. Tomiyama N, Ichida T, Yamaguchi K. Electromyographic activity of lower lip muscles when chewing with the lips in contact and apart. Angle Orthod 2004;74:31-6. 8. Gamboa NA, Miralles R, Valenzuela S, Santander H, Cordova R, Bull R, et al. Comparison of muscle activity between subjects with or without lip competence: electromyographic activity of lips, supra- and infrahyoid muscles. Cranio 2017;35:385-91. 9. Posen AL. The influence of maximum perioral and tongue force on the incisor teeth. Angle Orthod 1972;42:285-309. 10. Fındık Y, Baykul T, Aydın MA, Esenlik E, Ordu BN. Evaluation of lip force in patients with unilateral and bilateral cleft lip. Br J Oral Maxillofac Surg 2017;55:391-5. 11. Kawabata A, Kobayashi T, Takagi A, Kuroyanagi F, Washino K, Sabashi K, et al. Multidirectional lipclosing force in adults with mandibular deviation. J Oral Rehabil 2013;40:664-9. 12. Doto N, Yamada K. The relationship between maximum lip closing force and tongue pressure according to lateral craniofacial morphology. Orthod Waves 2015;74:69-75. 13. Takehana Y, Masuda Y, Kageyama T, Okazaki R, Murakami M, Yamada K. The relationship between lip-closing force and dental arch morphology in patient with Angle Class I malocclusion. J Oral Rehabil 2017;44:205-12. 14. Young TM, Smith RJ. Effects of orthodontics on the facial profile: a comparison of changes during nonextraction and four premolar extraction treatment. Am J Orthod Dentofacial Orthop 1993;103:452-8. 15. Kocadereli I. Changes in soft tissue profile after orthodontic treatment with and without extractions. Am J Orthod Dentofacial Orthop 2002;122:67-72.. 128. 16. Ueki K, Mukozawa A, Okabe K, Miyazaki M, Moroi A, Marukawa K, et al. Changes in the lip closing force of patients with class III malocclusion before and after orthognathic surgery. Int J Oral Maxillofac Surg 2012;41:835-8. 17. Ueki K, Moroi A, Sotobori M, Ishihara Y, Marukawa K, Iguchi R, et al. Evaluation of recovery in lip closing pressure and occlusal force and contact area after orthognathic surgery. J Craniomaxillofac Surg 2014;42:1148-53. 18. Yuce E, Baykul T, Findik Y, Alkis H. Evaluation of changes in lip closing force after surgically assisted rapid maxillary expansion. J Craniofac Surg 2016;27:649-53. 19. Ono T, Hori K, Masuda Y, Hayashi T. Recent advances in sensing oropharyngeal swallowing function in Japan. Sensors (Basel) 2010;10:176-202. 20. Jung MH, Yang WS, Nahm DS. Effects of upper lip closing force on craniofacial structures. Am J Orthod Dentofacial Orthop 2003;123:58-63. 21. Thüer U, Ingervall B. Pressure from the lips on the teeth and malocclusion. Am J Orthod Dentofacial Orthop 1986;90:234-42. 22. Posen AL. The application of quantitative perioral assessment to orthodontic case analysis and treatment planning. Angle Orthod 1976;46:118-43. 23. Kato Y, Kuroda T, Togawa T. Perioral force measurement by a radiotelemetry device. Am J Orthod Dentofacial Orthop 1989;95:410-4. 24. Jung MH, Yang WS, Nahm DS. Maximum closing force of mentolabial muscles and type of malocclusion. Angle Orthod 2010;80:72-9. 25. Ingervall B, Janson T. The value of clinical lip strength measurements. Am J Orthod 1981;80:496507. 26. Partal I, Aksu M. Changes in lips, cheeks and tongue pressures after upper incisor protrusion in Class II division 2 malocclusion: a prospective study. Prog Orthod 2017;18:29. 27. Lambrechts H, De Baets E, Fieuws S, Willems G. Lip and tongue pressure in orthodontic patients. Eur J Orthod 2010;32:466-71. 28. Drobocky OB, Smith RJ. Changes in facial profile during orthodontic treatment with extraction of four first premolars. Am J Orthod Dentofacial Orthop 1989;95:220-30. 29. Aksu M, Kocadereli I. Arch width changes in extraction and nonextraction treatment in class I patients. Angle Orthod 2005;75:948-52. 30. Herzog C, Konstantonis D, Konstantoni N, Eliades T. Arch-width changes in extraction vs nonextraction treatments in matched Class I borderline malocclusions. Am J Orthod Dentofacial Orthop 2017;151:735-43.. https://doi.org/10.4041/kjod.2020.50.2.120. www.e-kjo.org.
(10)
수치
관련 문서
Micro- and nano-sized pores were formed on the surface of the alloy using PEO and anodization methods, and the pore shape change according to the Zr
After dissolution of fuel with optimized ratio, the temperature changes in molten steel was measured during oxygen blowing and simulated by the coupled reaction model....
However, with the changes in the domestic and international environment after the reform and opening up, the new patriotism emerged in recognition of the
For patients treated for chin augmentation using either genioplasty with Medpor Ⓡ or osteotomy, the predictive value of the correlation of the hard and
- 각종 지능정보기술은 그 자체로 의미가 있는 것이 아니라, 교육에 대한 방향성과 기술에 대한 이해를 바탕으로 학습자 요구와 수업 맥락 등 학습 환경에 맞게
The effects of recycling on the tensile bond strength of new and clinically used stainless steel orthodontic brackets: an in vitro study. Material testing of
Measurement of proximal contact tightness between the left first molar and second molar(dental implant) in the mandible... Clinical dental anatomy, histology,
For establishing appropriate treatment plans and prognosis, the estimated value of the correlation between the change in hard and soft tissues is required,
