Spatial Modeling of Erosion Prone Areas Using GIS -Focused on the Moyar Sub-Watershed of Western Ghats, India-
6
0
0
전체 글
(2) Ponnusamy MaliniㆍKi Youn ParkㆍHwan Hee Yoo. 60. Being a mountainous landscape, few areas of Moyar sub-watershed are critical and responsible for high amount of soil and nutrient loss through erosion. Implementation of best management practices is required in those critical erosion prone areas of the watershed. Identification of these critical areas is essential for the effective and efficient implementation of the watershed management. In the Moyar watershed of Western ghats of India, the conservation and development aspects are taken as modeling objectives, for the forest area to identify erosion prone zones and suggest best management practices.. 2. Methods 2.1 Weighted Overlay Analysis Weighted overlay is a technique for applying a common scale of values to diverse and dissimilar inputs in order to perform an integrated analysis. Though we use many input layers to create a single output layer, it is well known that all the input layers are not equally important. Some of the layers are more important than others. This is the advantage of weighted overlay approach where one can assign weightage to each class in a layer and the percentage of importance/influence to that layer (Maguire et. al., 2005).. to scrub forest, degraded deciduous and degraded evergreen forests. Class weightage of 4 was assigned to open deciduous and open evergreen. Less weightages were assigned to other classes based on their vegetation density (Table 1). Slope plays a major role in erosion. Generally the steeper the slope of field, the greater the amount of soil loss from erosion by water. Therefore class weight of 5 was assigned to steep sloppy regions and less weightages were assigned to other classes based on the slope condition. Drainage density is also an influencing factor of erosion. High drainage density cause high erosion. Therefore class weight of 5 was assigned to very high drainage density and for subsequent classes less weight was assigned (Table 1). Among the three layers, the forest and drainage layers were given higher weight (35) with reference to percentage of influence than slope density (30). Soil and rainfall can be used as Table 1. Various thematic used in the weighted overlay analysis with class weightages and percentage of influence No.. Thematic layers. 1. Forest type map Scrub. Wt. Overlay = Layer 1 + Layer 2 … Layer n (1) Layer1 = Weightage of each class * Percentage of importance As the final output layer is discrete, the results of value in weighted overlay will be rounded to nearest whole number. 2.2 Weightages to Different Themes Based on the International standard there are three rating scale, 3 point(Low,Medium,High), 5 point (Very low, Low, Medium, High, Very high),7 point (Very very low, Very low, Low, Medium, High, Very high, Very very high), In this study we use the majority rating scale that is 5 Point rating Scale(Erten et. al., 2004). In the present study weightages were assigned based on the field knowledge and experience and for each theme class weightage was assigned following five point rating scale (1-very low, 2-low, 3-medium, 4-high, and 5-very high). When the soil is covered with poor vegetation, chances of erosion will be more. Therefore, class weightage of 5 was assigned 第16卷 第3號 2008年 9月. 2. 3. Class Percentage weightages of Influence 35 5. Degraded deciduous. 5. Open deciduous. 4. Dense deciduous. 2. Very dense deciduous. 1. Degraded evergreen. 5. Open evergreen. 4. Dense evergreen. 2. Very dense evergreen. 1. Slope. 30. Nil (0%). 0. Low (1-5%). 1. Medium (6-15%). 3. High (16-30%). 4. Very High (>35%). 5. Drainage density. 35. Very low (1-3). 1. Low (3-5). 2. Medium (5-7). 3. High (7-9). 4. Very High (>9). 5.
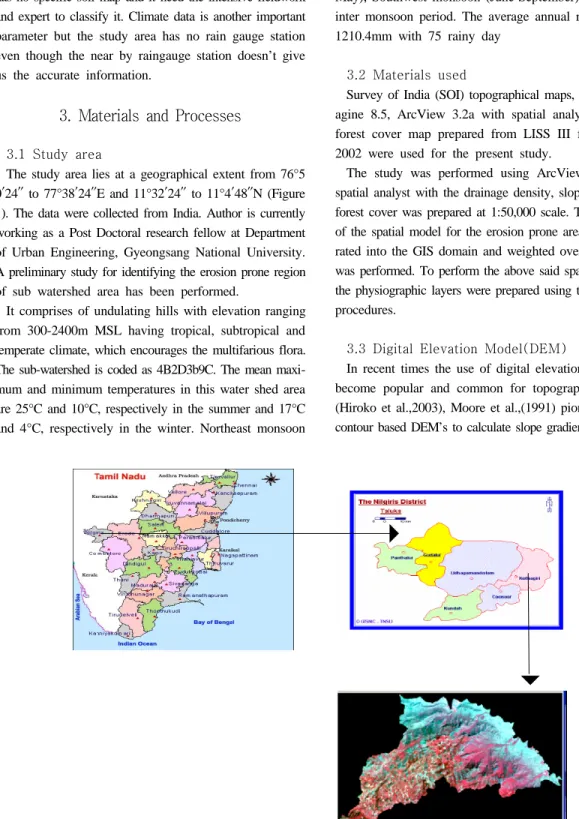
(3) Spatial Modeling of Erosion Prone Areas Using GIS. important layer but in the present study the forest area has no specific soil map and it need the intensive fieldwork and expert to classify it. Climate data is another important parameter but the study area has no rain gauge station even though the near by raingauge station doesn’t give us the accurate information.. 3. Materials and Processes 3.1 Study area The study area lies at a geographical extent from 76°5 0′24″ to 77°38′24″E and 11°32′24″ to 11°4′48″N (Figure 1). The data were collected from India. Author is currently working as a Post Doctoral research fellow at Department of Urban Engineering, Gyeongsang National University. A preliminary study for identifying the erosion prone region of sub watershed area has been performed. It comprises of undulating hills with elevation ranging from 300-2400m MSL having tropical, subtropical and temperate climate, which encourages the multifarious flora. The sub-watershed is coded as 4B2D3b9C. The mean maximum and minimum temperatures in this water shed area are 25°C and 10°C, respectively in the summer and 17°C and 4°C, respectively in the winter. Northeast monsoon. 61. (December-March), first inter monsoon period (AprilMay), Southwest monsoon (June-September) and second inter monsoon period. The average annual rainfall is of 1210.4mm with 75 rainy day 3.2 Materials used Survey of India (SOI) topographical maps, ERDAS Imagine 8.5, ArcView 3.2a with spatial analyst software, forest cover map prepared from LISS III for the year 2002 were used for the present study. The study was performed using ArcView 3.2a with spatial analyst with the drainage density, slope layers and forest cover was prepared at 1:50,000 scale. The approach of the spatial model for the erosion prone area is incorporated into the GIS domain and weighted overlay analysis was performed. To perform the above said spatial analysis, the physiographic layers were prepared using the following procedures. 3.3 Digital Elevation Model(DEM) In recent times the use of digital elevation model has become popular and common for topographic analysis (Hiroko et al.,2003), Moore et al.,(1991) pioneered using contour based DEM’s to calculate slope gradient and aspect. Figure 1. Location map of the study area. 韓國地形空間情報學會誌.
(4) 62. Ponnusamy MaliniㆍKi Youn ParkㆍHwan Hee Yoo. among other geomorphological and ecological application. The contour based DEM has an advantage that their shape can provide the extra information about the morphology of terrain (Mark, 1979, Wise, 2000). 3.4 Slope Slope is a key parameter, which influences the characteristics of soil, water and vegetation hazard (James, 1997). It is also one of the important physiographic parameters of any region, which decides many morphological characters (NRSA, 1995). In hilly terrain, slope plays an important role in deciding the characteristics of soil, water and vegetation. The slope map of study area was classified into 5 classes (Table 1). 3.5 Drainage Density Drainage density is defined as the length of drainage per unit area, which is a fundamental concept in hydrologic analysis. The term was first introduced by Horton (1932) and is determined by dividing the total length of streams within a drainage basin by the drainage area. A high drainage density reflects a highly dissected drainage basin with a relatively rapid hydrologic response to rainfall events, while a low drainage density means a poorly drained basin with a slow hydrologic response (Melton, 1957). Drainage density has been interpreted to reflect the interaction between climate and geology (Ritter et al. 1995). It is a measure of the spatial distribution of streams, both ephemeral and perennial, in a watershed and is related to sediment production and tributary connectivity to hill slopes. The watersheds with higher drainage density tend to intercept more surface flow and therefore generate greater runoff and sediment yield than basins with lower drainage density (Parker, 1977). However, in the present study to identify the effects of streams on the soil erosion drainage density was prepared. The streams were digitized and were classified from first order to sixth order. The grids of 1cm x 1cm were formed on the drainage map. The drainage density for each grid was calculated by dividing the length of the streams by total area of each grid. As in the present study, the working scale was 1: 50,000 scale, the area of each grid was 0.25 2 km . The value of drainage density in each grid was entered as a point inside the grids. Using spatial analysis of ArcView software are the interpolation was performed. 第16卷 第3號 2008年 9月. The Inverse Distance Weighing Method(IDW) interpolation technique was followed to estimate the drainage density. Interpolation is a general term to describe the process using GIS to create a continuous surface of measurements from a series of samples taken at different locations within a given area (Johnston et al. 2001). Interpolation has primarily been used in mapping soils, bedrock, surface and groundwater (Collins and Bolstad et al. 2003, Schloeder et al. 2001). Inverse distance weighted differs in that it is dependant on the distance between points in determining the weight of the values (Johnston et al. 2001). Schloeder et al. (2001) performed similar analysis using soil properties and limited sample locations, Inverse distance weighted tended to give better estimates than local polynomial interpolation with tension. Based on the aforementioned reasons and IDW interpolation was used and drainage density of the Moyar subwatershed was classified into five drainage density classes, viz., very low (1-3), low (3-5), medium (5-7), high (7-9) and very high drainage density (>9) based on the Analytical Hierarchical Process (AHP). With this, weightage was given to the slope and drainage density based on AHP(Teknoma, 2006) and Josrotia et al. (2003) and presented in table 1. The low and high erosion region was identified and merged with forest area. The resultant map is used to identify the erosion prone through which the conservation aspects could be further studied and implemented. 3.6 Forest Type Mapping An understanding of the distribution/disturbance history is recognized as critical for the modern sloppy landscape evaluation of conservation objectives and development of management approaches. Therefore, primary task in forest cover study is to demarcate the different forest types. For this, the Normalized Difference Vegetation Index (NDVI) and DEM were used. The expert classification method (Ramachandran et. al., 2007) was followed to prepare the forest cover map.. 4. Results and Discussion Erosion is a major hazard in the hilly terrain as it removes the fertile topsoil. Thus it would be useful to predict the erosion prone region that takes into account the various.
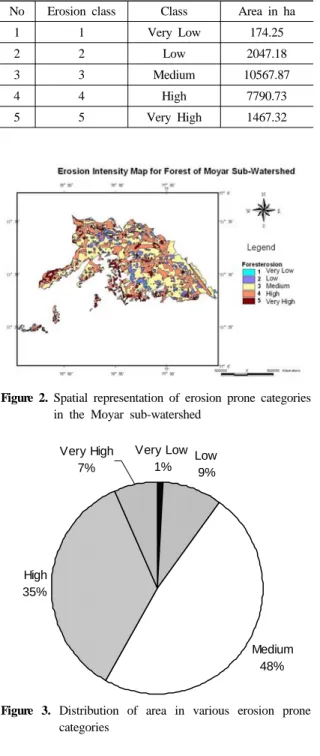
(5) 63. Spatial Modeling of Erosion Prone Areas Using GIS Table 2. Area under various erosion classes in the Moyar sub-watershed No. Erosion class. Class. Area in ha. 1. 1. Very Low. 174.25. 2. 2. Low. 2047.18. 3. 3. Medium. 10567.87. 4. 4. High. 7790.73. 5. 5. Very High. 1467.32. Figure 2. Spatial representation of erosion prone categories in the Moyar sub-watershed Very High 7%. Very Low Low 1% 9%. High 35%. under medium category (10567.87 ha) covering especially the southeastern and northern parts of the sub-watershed (Figure 3). The high erosion prone class occupies 7790.73 ha (35%); very high erosion class about 1437.32 ha (7%) lying in the eastern part of the sub-watershed. The low erosion area is relatively very less and occupies about 174.25 ha (9%). Soil erosion is a naturally occurring process on all land, which cause soil degradation along with soil compaction, low organic matter, loss of soil structure, poor internal drainage, salinity, and soil acidity problems. Erosion removes the top fertile soil, thereby making the soil unsuitable for vegetation growth. In the case of forest in hilly terrain, erosion by water causes removal of organic litter from the topsoil, which leads to various cascading problems. It affects the regeneration of forest trees, seedlings growth and it also affects soil formation. The following factors likely increase the risk of soil erosion in forests: reduction of the over story canopy; removal or alteration of the understory vegetation; disturbance or reduction (or both) of the litter layer; creation of bare soil areas; creation of channels; loss of plant litter cover and creation of hydrophobic soil conditions after fire; and changes in the soil mineralogy that reduce soil wet ability. Examples of human activities that affect these factors are road construction for logging and mining, destruction of forest floor by frequent human-caused fires, and soil compaction from domestic animals grazing. Therefore, necessary conservation measures should be taken up to avoid the factors which influence soil erosion, so that, the forests could be conserved.. 5. Conclusion. Medium 48%. Figure 3. Distribution of area in various erosion prone categories. related factors. The result shows various categories of erosion (Table 2). The area under various erosion prone categories is spatially represented in figure 2, which shows 48% of area. Soil is the basis of all plants and the wildlife they support on your land. Loss of that soil through erosion reduces a site’s productivity through loss of nutrients and the ability to hold water. Soil erosion negatively impacts down-slope ecosystems. GIS acted as valuable and useful tool to undertake the task of data compilation and analysis with in a short period at high resolution. From the above results, very high erosion and high erosion zones had been identified and necessary steps could be taken to prevent the erosion. The low erosion zones could also be considered and measures can be adopted 韓國地形空間情報學會誌.
(6) Ponnusamy MaliniㆍKi Youn ParkㆍHwan Hee Yoo. 64. to prevent it from becoming further eroded. This map could be used by forest and developmental authorities to take necessary steps towards the soil erosion. This paper represents a preliminary study for identifying the erosion prone region of sub watershed area. I am currently working to extend this preliminary study to a much larger scale analysis. However this does seem to be a very fruitful area for future research.. References 1. Erten, E., Kurgun, V. and Musaoglu N., “Forest fire risk zone mapping from satellite imagery and GIS - a case study”, ISPRS, Istanbul. 2004. 2. Collins F. C. and Bolstad P. V. A., “Comparison of Spatial Interpolation Techniques In Temperature Estimation”, http:// www.ncgia.uscb.edu/conf/ SANTA_FE_CD-ROM/sf_papers/ collins_fred.html, 2003. 3. Hiroko Mizukoshi and Masamu Aniya, “Use of Contour-Based DEM’s for Deriving and Mapping Topographic Attributes”, Journal of Photogrammetric Engineering and Remote Sensing, 68(1), pp. 83-93, 2003. 4. Horton and Horton R. E., “Drainage Basin Characteristics”, Transactions American Geophysical Union, 13, pp. 350-361, 1932. 5. James R. F., Barringer and Linda Lilburne, “An Evaluation of Digital Elevation Models for Upgrading New Zealand Land Resource Inventory Slope Data”, Proceedings of GeoComputation ’97 & SIRC ’97, 1997. 6. Johnston, Ver Hoef K. Krivoruchko and Lucus N., “Using Arc GIS Geostatistical Analyst”, ESRI, Redlands, CA 300, 2001. 7. Josrotia A. S., Dhiman S. D. and Aggarwal S. P., “ RainfallRunoff and Soil Erosion Modeling Using Remote Sensing and GIS Techniques- A Case Study of Tons Watershed”, Journal of Indian Society of Remote Sensing, 30(3), pp. 167-180, 2003. 8. Maguire, D., Batty, M., Goodchild, M., GIS, Spatial analysis and Modeling, ESRI Press, US. pp. 498, 2005.. 第16卷 第3號 2008年 9月. 9. Mark D. M., “Phenomenon- Based Data Structuring and Digital Terrain Modeling”, GeoProcessing, 1, pp. 27-36, 1979. 10. Melton, Melton M. A., “An Analysis of the Relations among the Elements of Climate, Surface Properties and Geomorphology”, Technical Report11, NewYork:Department of Geology, Columbia University, 1957. 11. Moore I. D. and. Grayson R. B., “A Contour Based Topographic Model for Hydrological and Ecological Applications”, Earth Surface Processes and Land forms, 13(4), pp. 305-320, 1991. 12. NRSA, Integrated Mission for Sustainable Development, Technical guidelines, National Remote Sensing Agency, Government of India, Hyderabad, 1995. 13. Parker R. S., “Experimental Study of Drainage Basin Evolution and its Hydrologic Implications”, Fort Collins, Colorado, Colorado State University: Hydrology Papers, 90:58, 1977. 14. Ramachandran A., Jayakumar S., Haroon R. M., Bhaskarn, Carbon Sequestrtion : Estimation of Carbon stock in natural forests using geospatial technology in the Eastern ghats of Tamilnadu, India., Current science 92(3), pp. 323-331, 2007. 15. Ritter D. F., Kochel R. C. and Miller J. R., “Process Geomorphology”, WCB/McGraw-Hill, New York, NY, pp. 483, 1995. 16. Schloeder C. A., Zimmerman N. E. and Joacobs M. J., “Comparison of methods for interpolating soil properties using limited data”, Soil Science Society of America Journal, 65, pp. 470-479, 2001. 17. Tripathy M. P., Panda R. K., Raghuwanshi N. S., “Identification and Prioritization of Critical Sub-watershed for Soil Conservation Management using SWAT Model, Bio system Engineering, 85(3), pp. 365-379, 2003. 18. Wise S. M. “Assessing the Quality for Hydrological Application of Digital Elevation Models Derived from Contours”, Hydrological Processes, 14, pp. 1909-1929, 2000. 19. Zang ZeingXiang, Peng Xulong, Chen Xiaofeng and Liu Jiyan, “Moutain Soil Erosion Mapping in central Tibet Using Remote th sensing and GIS”, 4 Intenational Symposium of High Mountain Remote Sensing catography, Karlstald-KirunaTroms, August(19-29), 1996. 20. Teknoma Kardi, “Analytical Hierarchy Process AHP Tutorial”, http://people.revoledu.com/Kardi/tutorial/ahp.
(7)
수치

관련 문서