Introduction
Obstructive sleep apnea (OSA), characterized by re- current upper airway collapse, is a common condition
that affects at least 10% of the general population, pri- marily overweight or obese person.1) Recently, many re- ports suggest that OSA is associated with cardiovascular disease (CVD) such as hypertension, coronary artery dis- ease, cerebrovascular disease, and arrhythmia.2-5) The mechanisms underlying this association are not fully elu- cidated, but endothelial dysfunction, an initiating patho- physiology for atherosclerosis, may represent a link be- tween OSA and CVD.3,6,7) There have been diverging re-
Association of Obstructive Sleep Apnea with Peripheral Endothelial Function Assessed by Reactive Hyperemia Index
Jaewon Oh, MD, Sungha Park, MD, Jong-Chan Youn, MD, Geu-Ru Hong, MD, Sang-Hak Lee, MD, Seok-Min Kang, MD, Donghoon Choi, MD
Division of Cardiology, Cardiovascular Research Institute, Severance Cardiovascular Hospital, Yonsei University College of Medicine, Seoul, Korea
❙ABSTRACT❙
Background: Obstructive sleep apnea (OSA) has been shown to be an important risk factor for metabolic syndrome and cardiovascular disease. Endothelial dysfunction plays a pivotal role in the pathophysiology of these diseases. However, little is known about the relationship between sleep apnea and microvascular endothelial dysfunction, as assessed by digital reactive hyperemia. Methods: The study population consisted of 80 patients (mean age, 48 ± 12 years-old; 65 men; 59 hypertensive). We measured apnea hypopnea index (AHI) and mild OSA was defined as 5 < AHI <15 and moderate to – severe OSA as AHI 15. Reactive hyperemia index (RHI) derived from peripheral arterial tonometry (PAT) as ≥ measurement of endothelium-mediated vasodilatation. Results: There were 61 OSA patients in the study population (AHI, 21.5 ± 16.7 vs. 2.7 ± 1.6 in non-OSA; p < 0.001). There were no significant difference in RHI and peripheral augmentation index (pAIx) between OSA and non-OSA group (RHI, 2.04 ± 0.48 vs. 2.06 ± 0.42; p = 0.894; pAIx, 21.7% ± 24.0% vs. 21.7% ± 30.0%; p = 1.000, respectively). Also, there was no significant difference in RHI and pAIx between mild (n = 31) and moderate to severe (n = 30) OSA group (RHI, 2.10 ± 0.47 vs. 1.98 ± 0.49; p = 0.333; pAIx, 24.2% ± 20.7% vs. 19.0% ± 27.2%;
p = 0.407, respectively), either. Overall, no significant correlation between AHI and RHI was observed (r = -0.023, p = 0.837).
The other OSA severity indices such as oxygen desaturation index, mean and minimum oxygen saturation were not correlated with RHI or pAIx. In the subgroup analysis for the OSA group, we could not find any significant relationships between AHI and PAT parameters, either. Conclusions: OSA was not observed to be associated with reactive hyperemia measured by PAT.
(J Korean Soc Hypertens 2014;20(2):42-50) Key Words: Obstructive sleep apnea; Vasodilation
Received: 2014.2.20. Revised: 2014.6.11, Accepted: 2014.6.13 Correspondence to: Sungha Park, MD
Address: Division of Cardiology, Cardiovascular Research Institute, Severance Cardiovascular Hospital, Yonsei University College of Medicine, 50 Yonsei-ro, Seodaemun-gu, Seoul 120-749, Korea
Tel: +82-2-2228-8460, Fax: +82-2-393-2041 E-mail: shpark0530@yuhs.ac
ports on the effect of OSA on endothelial function, with some studies showing impaired endothelial function,7-10) while other large sample-sized study found no association between OSA and endothelial dysfunction as measured by brachial artery flow-mediated dilation (FMD).11)
Recently, a new measurement of peripheral vasodilator response as a measure for endothelial dysfunction using fingertip pulse amplitude tonometry (peripheral arterial tonometry, PAT) may emerge as a useful, non-invasive assessment of microvascular health.12,13) Reactive hyper- emia (RH) response (with PAT) as detected by the RH in- dex (RHI) has recently been shown to be related to multiple traditional and metabolic risk factors and cardiovascular events.14-16) However, there have not been enough studies about the relationship between sleep apnea and endothe- lial dysfunction, especially digital RH by PAT. Therefore, we investigated the relationships between OSA and pe- ripheral endothelial function assessed by RHI.
Subjects and methods
1. Study subjects
The study group was comprised of 80 consecutive sub- jects who underwent digital RH by PAT derived from the sleep apnea registry of Severance Cardiovascular Hospital.
The medical history such as diabetes mellitus (DM), hy- pertension (HTN), and dyslipidemia were diagnosed based on medical and medication history. Blood sampling was performed from the forearm via the antecubital vein after a minimum of 12-hour fasting and collected into both EDTA-treated and plain tubes. Written, informed consent was obtained from all subjects and the protocol was approved by the institutional review board of Yonsei University College of Medicine (IRB no. 4-2011-0299).
2. Sleep apnea assessment
The apnea-hypopnea index (AHI) was calculated as the sum of the total events of the apnea index and hypopnea index. Apnea was defined as the absence of airflow for 10 seconds or longer. Hypopnea was defined as either 1) reduced airflow of at least 50% for 10 seconds or longer with the presence of either oxygen desaturation 3% of ≥ the normal level or an arousal or 2) reduced airflow of at least 30% for 10 seconds or longer with oxygen desa- turation 4%.≥ 17,18) Ambulatory Polysomnography was performed with Embletta X100 (Embla, Broomfield, CO, USA). OSA was defined as AHI > 5 and mild OSA as 5 < AHI < 15, moderated to severe OSA as AHI 15.≥
3. Digital measurements of vascular function
Pulse amplitude at rest was measured in the fingertips by positioning a PAT device (Endo-PAT2000; Itamar Medical, Caesarea, Israel). Two flexible probes were placed on the index fingers of the right (ischemic) and left (control) hands. Reactive hyperemia was provoked by a 5-minute forearm cuff occlusion. The recorded pulse amplitude was analyzed by a computerized, semi-auto- mated algorithm (Itamar Medical). Endothelial dysfunc- tion was assessed using RHI as described previously.12,13) The RHI was calculated as the ratio of the average PAT amplitude over 60 seconds after 90 seconds of cuff de- flation to the average PAT amplitude over 2.5 minutes prior to cuff inflation in the occluded hand divided by the same values in the control hand and then multiplied by a baseline correction factor.
4. Statistical analysis
Results are expressed as the mean ± standard deviation in continuous variables and a percentage of the total group in categorical variables. In this study, a comparison of discrete variables was made using chi-square test, while
Student t-test was used for continuous variables. If the distribution was skewed, a non-parametric test was used.
Correlations of RHI, AHI with other variables were examined using Pearson correlation analysis. A multivariable linear regression analysis was done in a model using variables related to RHI and peripheral augmentation index (pAIx).
A two-tailed p-value < 0.05 was considered statistically significant. All statistical analyses were performed with IBM SPSS ver. 21.0 (IBM Co., Armonk, NY, USA).
Results
Table 1 showed the clinical and laboratory character-
istics of the study population. Our study group consisted of 80 patients (65 males, 81.3%) with a mean age of 56
± 11 years old. There were 59 HTN (73.8%), 7 DM (8.8%) and 8 dyslipidemic (10.0%) patients. Mean sys- tolic blood pressure, total cholesterol (TC) and fasting blood glucose level were 134.8 ± 17.5 mm Hg, 189.5 ± 35.6 mg/dL and 103.1 ± 17.0 mg/dL, respectively.
Thirty-nine patients were on angiotensin receptor blocker (48.8%) and 25 patients were on aspirin administrations (31.3%). Mean RHI and pAIx were 2.05 ± 0.46, 21.7 ± 25.4, respectively. When we compared the baseline char- acteristics between non-OSA and OSA group, TC, low density lipoprotein cholesterol, AHI and oxygen desatura-
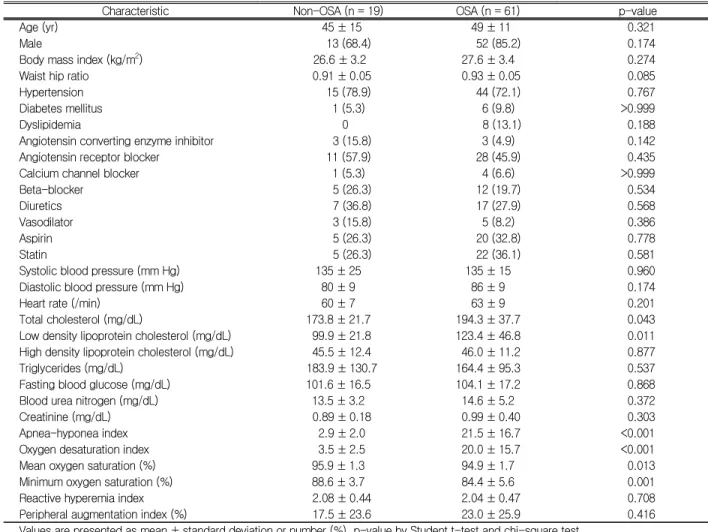
Characteristic Non-OSA (n = 19) OSA (n = 61) p-value
Age (yr) 45 ± 15 49 ± 11 0.321
Male 13 (68.4) 52 (85.2) 0.174
Body mass index (kg/m2) 26.6 ± 3.2 27.6 ± 3.4 0.274
Waist hip ratio 0.91 ± 0.05 0.93 ± 0.05 0.085
Hypertension 15 (78.9) 44 (72.1) 0.767
Diabetes mellitus 1 (5.3) 6 (9.8) >0.999
Dyslipidemia 0 8 (13.1) 0.188
Angiotensin converting enzyme inhibitor 3 (15.8) 3 (4.9) 0.142
Angiotensin receptor blocker 11 (57.9) 28 (45.9) 0.435
Calcium channel blocker 1 (5.3) 4 (6.6) >0.999
Beta-blocker 5 (26.3) 12 (19.7) 0.534
Diuretics 7 (36.8) 17 (27.9) 0.568
Vasodilator 3 (15.8) 5 (8.2) 0.386
Aspirin 5 (26.3) 20 (32.8) 0.778
Statin 5 (26.3) 22 (36.1) 0.581
Systolic blood pressure (mm Hg) 135 ± 25 135 ± 15 0.960
Diastolic blood pressure (mm Hg) 80 ± 9 86 ± 9 0.174
Heart rate (/min) 60 ± 7 63 ± 9 0.201
Total cholesterol (mg/dL) 173.8 ± 21.7 194.3 ± 37.7 0.043
Low density lipoprotein cholesterol (mg/dL) 99.9 ± 21.8 123.4 ± 46.8 0.011
High density lipoprotein cholesterol (mg/dL) 45.5 ± 12.4 46.0 ± 11.2 0.877
Triglycerides (mg/dL) 183.9 ± 130.7 164.4 ± 95.3 0.537
Fasting blood glucose (mg/dL) 101.6 ± 16.5 104.1 ± 17.2 0.868
Blood urea nitrogen (mg/dL) 13.5 ± 3.2 14.6 ± 5.2 0.372
Creatinine (mg/dL) 0.89 ± 0.18 0.99 ± 0.40 0.303
Apnea-hyponea index 2.9 ± 2.0 21.5 ± 16.7 <0.001
Oxygen desaturation index 3.5 ± 2.5 20.0 ± 15.7 <0.001
Mean oxygen saturation (%) 95.9 ± 1.3 94.9 ± 1.7 0.013
Minimum oxygen saturation (%) 88.6 ± 3.7 84.4 ± 5.6 0.001
Reactive hyperemia index 2.08 ± 0.44 2.04 ± 0.47 0.708
Peripheral augmentation index (%) 17.5 ± 23.6 23.0 ± 25.9 0.416
Values are presented as mean ± standard deviation or number (%). p-value by Student t-test and chi-square test.
OSA, obstructive sleep apnea.
Table 1. Baseline characteristics of study patients
tion index (ODI) were significantly higher and mean and minimum oxygen saturation lower in OSA than non-OSA group. However, there was no significant difference in RHI and pAIx between OSA and non-OSA group (Table
1). Then, we further compared RHI and pAIx after sepa- rating OSA group into mild (n = 31) and moderate to se- vere (n = 30) OSA group. However, we could not find any significant differences in RHI and pAIx among
Variable RHI Peripheral AIx
R p-value R p-value
Age (yr) -0.137 0.227 0.583 <0.001
Body mass index (kg/m2) 0.017 0.880 -0.290 0.010
Waist hip ratio 0.046 0.689 0.156 0.175
Systolic blood pressure (mm Hg) 0.078 0.729 0.307 0.165
Diastolic blood pressure (mm Hg) -0.090 0.691 -0.152 0.501
Heart rate (/min) 0.116 0.324 -0.329 0.004
Total cholesterol (mg/dL) -0.053 0.668 -0.125 0.310
Low density lipoprotein cholesterol (mg/dL) -0.104 0.417 -0.118 0.356
High density lipoprotein cholesterol (mg/dL) 0.016 0.904 0.212 0.095
Triglycerides (mg/dL) 0.072 0.575 -0.267 0.035
Fasting blood glucose (mg/dL) -0.070 0.554 0.004 0.973
Blood urea nitrogen (mg/dL) -0.106 0.368 -0.025 0.832
Creatinine (mg/dL) -0.044 0.707 -0.131 0.265
Apnea-hyponea index -0.023 0.837 -0.094 0.408
Oxygen desaturation index -0.017 0.879 -0.107 0.356
Mean oxygen saturation (%) 0.010 0.931 0.062 0.593
Minimum oxygen saturation (%) -0.034 0.770 0.188 0.101
Reactive hyperemia index 0.160 0.158
Peripheral AIx (%) 0.160 0.158
RHI, reactive hyperemia index; AIx, augmentation index.
Table 2. Correlation analysis with RHI and peripheral AIx in overall groups
Fig. 1. Box diagrams showing (A) RHI and (B) pAIx in patients with no (AHI < 5), mild (5 ≤ AHI < 15) and moderate to severe (AHI ≥ 15) obstructive sleep apnea. In these plots, the upper and lower bars outside the boxes represent the 90% confidence interval. RHI, reactive hyperemia index;
pAIx, peripheral augmentation index; AHI, apnea-hyponea index.
non-OSA, mild and moderate to severe OSA group (RHI, 2.08 ± 0.44 vs. 2.10 ± 0.47 vs. 1.98 ± 0.49; p = 0.600;
pAIx ,17.5% ± 23.6% vs. 24.2% ± 20.7% vs. 19.0% ± 27.2%; p = 0.735, respectively), either (Fig. 1A, B).
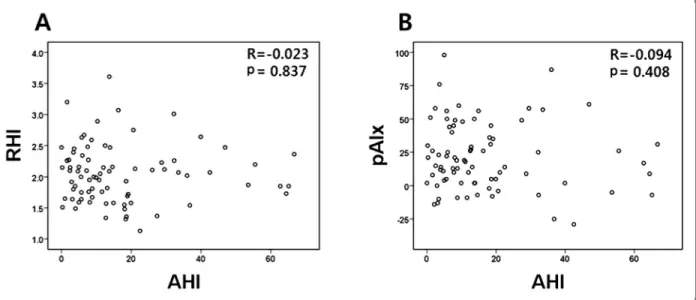
We analyzed the association among RHI, pAIx and clinical, laboratory variables by correlation analysis in overall study group (Table 2). No significant correlation between AHI and endothelial function was observed (r = -0.023, p = 0.837 for RHI; r = -0.094, p = 0.408 for pAIx) (Fig. 2A, B). The other OSA severity indices such as ODI, mean and minimum oxygen saturation were not correlated with RHI or pAIx. No clinical and laboratory parameter was significantly correlated with RHI whereas age, body mass index (BMI), heart rate (HR), and trigly- ceride (TG) were significantly correlated with pAIx. The correlation analysis for subjects with OSA did not show any significant association among OSA parameters and endothelial function parameters, either. Age, BMI, HR, TG were significantly correlated with pAIx in the OSA group. And BMI (r = 0.818, p = 0.026), ODI (r = 0.961, p < 0.001), mean and minimum oxygen saturation (r = -0.399, p < 0.001; r = -0.663, p < 0.001, respectively)
were significantly correlated with AHI in overall study group. The same patterns of correlations with AHI were found in only OSA group (Table 3).
To estimate the independent contribution of various pa- rameters to peripheral endothelial function (RHI and pAIx), we carried out multivariable linear regression analysis. No variable was significantly associated with RHI in neither overall nor OSA group (Table 4). On the other hand, age, HR, AHI, and ODI tended to be asso- ciated with pAIx in both overall (r2 = 0.624) and OSA (r2 = 0.800) group without statistical significance (Table 5).
Discussion
The main findings of our study were that the parame- ters of sleep apnea derived from polysomnography were not associated with endothelial function assessed by re- active hyperemia.
Recently, OSA has been demonstrated to being a risk factor for metabolic syndrome and CVD.19) One of the mechanisms underlying this association between OSA and CVD is endothelial dysfunction, an initiating patho-
Fig. 2. Scatter diagrams showing the correlations between AHI and (A) RHI and (B) pAIx. AHI, apnea-hyponea index; RHI, reactive hyperemia index; pAIx, peripheral augmentation index.
physiology for atherosclerosis.3,6) There have been some studies on the effect of OSA on endothelial function but
their results have not been conclusive. Firstly, Chami et al.11) reported that they could find a moderate association
Variable RHI Peripheral AIx
R p-value R p-value
Age (yr) -0.036 0.782 0.609 <0.001
Body mass index (kg/m2) -0.108 0.407 -0.317 0.014
Waist hip ratio 0.079 0.549 0.064 0.631
Systolic blood pressure (mm Hg) 0.160 0.553 0.378 0.149
Diastolic blood pressure (mm Hg) -0.039 0.885 -0.041 0.881
Heart rate (/min) 0.108 0.414 -0.315 0.016
Total cholesterol (mg/dL) -0.037 0.797 -0.172 0.224
Low density lipoprotein cholesterol (mg/dL) -0.140 0.338 -0.174 0.232
High density lipoprotein cholesterol (mg/dL) 0.083 0.569 0.212 0.143
Triglycerides (mg/dL) 0.063 0.669 -0.283 0.049
Fasting blood glucose (mg/dL) -0.120 0.383 0.011 0.936
Blood urea nitrogen (mg/dL) -0.096 0.480 -0.038 0.782
Creatinine (mg/dL) 0.006 0.965 -0.130 0.340
Apnea-hyponea index -0.004 0.973 -0.175 0.181
Oxygen desaturation index -0.011 0.935 -0.150 0.257
Mean oxygen saturation (%) 0.002 0.987 0.074 0.579
Minimum oxygen saturation (%) -0.061 0.646 0.235 0.073
Reactive hyperemia index 0.154 0.240
Peripheral AIx (%) 0.154 0.240
RHI, reactive hyperemia index; AIx, augmentation index.
Table 3. Correlation analysis with RHI and peripheral AIx in OSA groups
Variable Overall group (r2 = 0.371) Obstructive sleep apnea group (r2 = 0.475)
ß p-value ß p-value
Age -0.280 0.348 -0.117 0.779
Female gender 0.220 0.512 0.447 0.289
Body mass index 0.010 0.973 -0.043 0.907
Waist hip ratio -0.524 0.136 -0.511 0.218
Systolic blood pressure 0.258 0.479 0.251 0.594
Heart rate -0.460 0.096 -0.281 0.372
Oxygen desaturation index 1.906 0.176 1.996 0.236
AHI -1.770 0.224 -1.782 0.311
AHI, apnea-hyponea index; ß, unstandardized coefficient.
Table 4. Multiple regression analysis for the association between reactive hyperemia index and AHI
Variable Overall group (r2 = 0.624) OSA group (r2 = 0.800)
ß p-value ß p-value
Age 0.440 0.070 0.518 0.076
Female gender 0.184 0.480 0.327 0.216
Body mass index -0.288 0.335 -0.153 0.509
Waist hip ratio -0.221 0.402 -0.310 0.224
Systolic blood pressure 0.165 0.556 0.259 0.383
Heart rate -0.309 0.142 -0.404 0.062
Oxygen desaturation index 1.916 0.086 1.808 0.099
AHI -1.938 0.094 -2.000 0.088
AHI, apnea-hyponea index; ß, unstandardized coefficient.
Table 5. Multiple regression analysis for the association between peripheral augmentation index and AHI
between OSA and only brachial artery diameter but not find any link between OSA and endothelial dysfunction as measured by brachial artery FMD in over 600-sized observation study. However, recent two studies reported against this finding. Namtvedt et al.7) showed that OSA was associated with endothelial dysfunction in- dependently of obesity and conventional risk factors. In this study, they also used FMD for assessing endothelial function. And Seif et al.20) showe that there was a decline of endothelial function, measured by RHI only in high AHI group. In our study, we could not find any sig- nificant correlation between RHI and AHI/ODI. There are several factors that may have resulted in the negative findings. Firstly, in contrast to previous studies that measured endothelial function of the brachial arteries, the measurement of microvascular endothelial function was done in our study. The discrepancy in measurement of endothelial function (FMD/RHI) may be the reason why there was no association between OSA and RHI parameters. Further study assessing endothelial function by both FMD and RHI simultaneously is warranted to answer this question. Secondly, as this study was based upon a tertiary hospital registry, the cardiovascular risk of the non OSA group tended to be more severe. This is demonstrated by the fact that there were more HTN pa- tients in non-OSA group (47.4%) compared to OSA group (37.7%) with no significant difference in baseline charac- teristics between OSA and non-OSA group. Because en- dothelial dysfunction can be found in hypertension pa- tients, high prevalence of HTN in non-OSA group could also explain the negative finding of our study.
By using fingertip PAT, a new measurement of periph- eral vasodilator response as a measure for endothelial dysfunction, we were able to analyze data regarding pAIx as well. Heffernan et al.21) showed that RHI and pAIx provided distinct insight into systemic vascular aging and
target organ damage. According to their study, pAIx de- rived from PAT was correlated with age-associated changes in vascular function and target organ damage (not coronary atherosclerotic burden) but RHI is asso- ciated with coronary atherosclerotic burden (not target or- gan damage or other measures of vascular aging).21) Recently, a large-sized study reported that pAIx was more closely related to age rather than RHI.22) However, this study could not demonstrate any significant associa- tion between pAIx and parameters of OSA. This is sup- ported by a study by Butt et al.,23) which demonstrated that there were no significant differences between sub- jects with OSA, hypertension and healthy control in terms of augmentation index and PWV. The results from this study begs the question of whether the endothelial dysfunction found in OSA patients in previous studies is the result of the cardiovascular risk factors that are more frequently associated with OSA patients or due to the sleep apnea itself. Further study assessing the change in RHI and pAIx after CPAP may be required to answer this question.
Our study can’t go without limitations. Firstly, our study also has inherent limitations with cross-sectional study design. We could not explain the cause and effect of the associations so more prospective and follow-up studies need to be followed. Secondly, the small sam- ple-sized study could not generalize our finding. In pow- er calculation analysis, the sample size of our study (n = 80) was not enough power (7.5%) to detect correlations between AHI and RHI (R = -0.023). So our study was not conclusive in this field of research. Thirdly, we do not have any data about FMD and other endothelial labo- ratory marker such as endothelial adhesion molecules, an- giogenenic factors in our study. Comparing our results with other endothelial markers, it could help to under- stand the usefulness of PAT in assessing endothelial
function. Finally, our negative results could be affected by HTN medication and meals of the patients although there were not any significant differences in HTN medi- cations between OSA and non-OSA group.
Summary
연구배경: 수면무호흡증은 대사증후군과 심혈관계질환
의 중요한 위험인자로 알려져 있다 혈관내피세포의 기능.
이상은 이러한 질환의 발생에 중요한 역할을 한다 그러나 .
이러한 수면무호흡증과 말초동맥의 혈압측정을 통해 반응 성 충혈(reactive hyperemia)로 측정된 말초혈관 내피세포 기능이상 사이의 연관성에 관한 연구는 부족한 실정이다.
방법: 수면무호흡증검사와 말초혈관 내피세포 기능검사 를 동시에 시행한 명 평균 나이80 ( , 48 ± 12 ; 세 남성, 65 ; 명 고혈압, 59 ; 명 이상지혈증, 8 ; 명 당뇨병, 7 ; 명 평균 체질량 지수, 27.3 ± 3.4). 수면무호흡증검사를 통해 무호흡지수 (apnea-hypopnea index)와 말초혈관내피세포 기능검사를 통해 반응성 충혈지수(reactive hyperemia index, RHI) 등
을 측정하였다 경등도 수면무호흡증은 무호흡지수 이상. 5
미만으로 중등도 이상 수면무호흡증은 이상으로
15 , 15
정의하였다.
결과: 연구대상 중 수면무호흡증에 해당하는 사람은 61
명이었다 수면무호흡지수( , 21.5 ± 16.7 vs. 2.7 ± 1.6 in 수면무호흡증 환 non-obstructive sleep apnea; p < 0.001).
자와 비환자 사이에 RHI와 peripheral augmentation index 값에 유의한 차이는 없었다
(pAIx) (RHI, 2.04 ± 0.48 vs.
2.06 ± 0.42; p = 0.894; pAIx, 21.7% ± 24.0% vs. 21.7%
또한 경등도 와 중등도
± 30.0%; p = 1.000). (n = 31) (n =
이상의 수면무호흡증 환자 사이에도 와 값에
30) RHI pAIx
유의한 차이는 없었다(RHI, 2.10 ± 0.47 vs. 1.98 ± 0.49;
p = 0.333; pAIx, 24.2% ± 20.7% vs. 19.0% ± 27.2%; p 전체 연구대상자에서 수면무호흡지수와
= 0.407). RHI
사이에 상관관계는 없었다(r = -0.023, p = 0.837). Oxygen 평균 산포포화도 최소 산소포화도와
desaturation index, ,
같은 다른 수면무호흡지수와 RHI, pAIx 사이에도 유의한
상관관계는 없었다 수면무호흡환자만을 대상으로 한 분.
석에도 수면무호흡지수와 RHI, pAIx 사이에 유의한 상관
관계는 없었다.
결론: 수면무호흡증은 말초동맥 혈압측정으로 산출된 혈관내피세포 기능이상과는 관계가 없었다.
Conflict of interest
No potential conflict of interest relevant to this article was as reported.
Acknowledgements
This study was supported by 2005 research grant from the Korean Society of Hypertension.
References
1. Young T, Peppard PE, Gottlieb DJ. Epidemiology of ob- structive sleep apnea: a population health perspective. Am J Respir Crit Care Med. 2002;165:1217-39.
2. Somers VK, White DP, Amin R, Abraham WT, Costa F, Culebras A, et al. Sleep apnea and cardiovascular disease: an American Heart Association/american College Of Cardiology Foundation Scientific Statement from the American Heart Association Council for High Blood Pressure Research Professional Education Committee, Council on Clinical Cardiology, Stroke Council, and Council On Cardiovascular Nursing. In collaboration with the National Heart, Lung, and Blood Institute National Center on Sleep Disorders Research (National Institutes of Health). Circulation. 2008;118:1080-111.
3. Baguet JP, Barone-Rochette G, Tamisier R, Levy P, Pepin JL.
Mechanisms of cardiac dysfunction in obstructive sleep apnea. Nat Rev Cardiol. 2012;9:679-88.
4. Yaggi HK, Concato J, Kernan WN, Lichtman JH, Brass LM, Mohsenin V. Obstructive sleep apnea as a risk factor for stroke and death. N Engl J Med. 2005;353:2034-41.
5. Gami AS, Pressman G, Caples SM, Kanagala R, Gard JJ, Davison DE, et al. Association of atrial fibrillation and ob- structive sleep apnea. Circulation. 2004;110:364-7.
6. Budhiraja R, Parthasarathy S, Quan SF. Endothelial dysfunc- tion in obstructive sleep apnea. J Clin Sleep Med. 2007;3:
409-15.
7. Namtvedt SK, Hisdal J, Randby A, Agewall S, Stranden E, Somers VK, et al. Impaired endothelial function in persons with obstructive sleep apnoea: impact of obesity. Heart.
2013;99:30-4.
8. Kato M, Roberts-Thomson P, Phillips BG, Haynes WG, Winnicki M, Accurso V, et al. Impairment of endothelium-de- pendent vasodilation of resistance vessels in patients with ob- structive sleep apnea. Circulation. 2000;102:2607-10.
9. Oflaz H, Cuhadaroglu C, Pamukcu B, Meric M, Ece T, Kasikcioglu E, et al. Endothelial function in patients with ob- structive sleep apnea syndrome but without hypertension.
Respiration. 2006;73:751-6.
10. Chung S, Yoon IY, Lee CH, Kim JW. The association of noc- turnal hypoxemia with arterial stiffness and endothelial dys- function in male patients with obstructive sleep apnea syndrome. Respiration. 2010;79:363-9.
11. Chami HA, Keyes MJ, Vita JA, Mitchell GF, Larson MG, Fan S, et al. Brachial artery diameter, blood flow and flow-medi- ated dilation in sleep-disordered breathing. Vasc Med.
2009;14:351-60.
12. Kuvin JT, Patel AR, Sliney KA, Pandian NG, Sheffy J, Schnall RP, et al. Assessment of peripheral vascular endothe- lial function with finger arterial pulse wave amplitude. Am Heart J. 2003;146:168-74.
13. Yang WI, Park S, Youn JC, Son NH, Lee SH, Kang SM, et al.
Augmentation index association with reactive hyperemia as assessed by peripheral arterial tonometry in hypertension.
Am J Hypertens. 2011;24:1234-8.
14. Hamburg NM, Keyes MJ, Larson MG, Vasan RS, Schnabel R, Pryde MM, et al. Cross-sectional relations of digital vas- cular function to cardiovascular risk factors in the Framingham Heart Study. Circulation. 2008;117:2467-74.
15. Rubinshtein R, Kuvin JT, Soffler M, Lennon RJ, Lavi S, Nelson RE, et al. Assessment of endothelial function by non-invasive peripheral arterial tonometry predicts late car- diovascular adverse events. Eur Heart J. 2010;31:1142-8.
16. Hamburg NM, Palmisano J, Larson MG, Sullivan LM, Lehman BT, Vasan RS, et al. Relation of brachial and digital measures of vascular function in the community: the Framingham heart study. Hypertension. 2011;57:390-6.
17. Patil SP. What every clinician should know about polysomnography. Respir Care. 2010;55:1179-95.
18. Grigg-Damberger MM. The AASM Scoring Manual four years later. J Clin Sleep Med. 2012;8:323-32.
19. Drager LF, Togeiro SM, Polotsky VY, Lorenzi-Filho G.
Obstructive sleep apnea: a cardiometabolic risk in obesity and the metabolic syndrome. J Am Coll Cardiol. 2013;62:569-76.
20. Seif F, Patel SR, Walia H, Rueschman M, Bhatt DL, Gottlieb DJ, et al. Association between obstructive sleep apnea se- verity and endothelial dysfunction in an increased back- ground of cardiovascular burden. J Sleep Res. 2013;22:
443-51.
21. Heffernan KS, Patvardhan EA, Kapur NK, Karas RH, Kuvin JT. Peripheral augmentation index as a biomarker of vascular aging: an invasive hemodynamics approach. Eur J Appl Physiol. 2012;112:2871-9.
22. Morris AA, Patel RS, Binongo JN, Poole J, Al Mheid I, Ahmed Y, et al. Racial differences in arterial stiffness and mi- crocirculatory function between Black and White Americans.
J Am Heart Assoc. 2013;2:e002154.
23. Butt M, Khair OA, Dwivedi G, Shantsila A, Shantsila E, Lip GY. Myocardial perfusion by myocardial contrast echo- cardiography and endothelial dysfunction in obstructive sleep apnea. Hypertension. 2011;58:417-24.