Relationship between Milk and Calcium Intake and Lipid Metabolism in Female Patients with Type 2 Diabetes
JaeHee Kim,
1* Ji-Yun Hwang,
2* Ki Nam Kim,
1Young-Ju Choi,
3Namsoo Chang,
1and Kap-Bum Huh
31Department of Nutritional Science and Food Management, Ewha Womans University, Seoul; 2The Graduate School of Education, Sangmyung University, Seoul; 3The Huh’s Diabetes Clinic & The 21C Diabetes and Vascular Research Institute, Seoul, Korea.
Received: February 20, 2012 Revised: July 8, 2012 Accepted: July 12, 2012 Co-corresponding authors:
Dr. Namsoo Chang,
Department of Nutritional Science and Food Management, Ewha Womans University, 52 Ewhayeodae-gil, Seodaemun-gu, Seoul 120-750, Korea.
Tel: 82-2-3277-3468, Fax: 82-2-3277-2862 E-mail: [email protected] and Dr. Kap-Bum Huh,
The Huh’s Diabetes Clinic & The 21C Diabetes and Vascular Research Institute, Songwon Bldg. 40-19 Nogosan-dong, Mapo-gu, Seoul 121-806, Korea.
Tel: 82-2-718-1827, Fax: 82-2-704-5750 E-mail: [email protected]
*JaeHee Kim and Ji-Yun Hwang contributed equally to this work.
∙ The authors have no financial conflicts of interest.
© Copyright:
Yonsei University College of Medicine 2013 This is an Open Access article distributed under the terms of the Creative Commons Attribution Non- Commercial License (http://creativecommons.org/
licenses/by-nc/3.0) which permits unrestricted non- commercial use, distribution, and reproduction in any medium, provided the original work is properly cited.
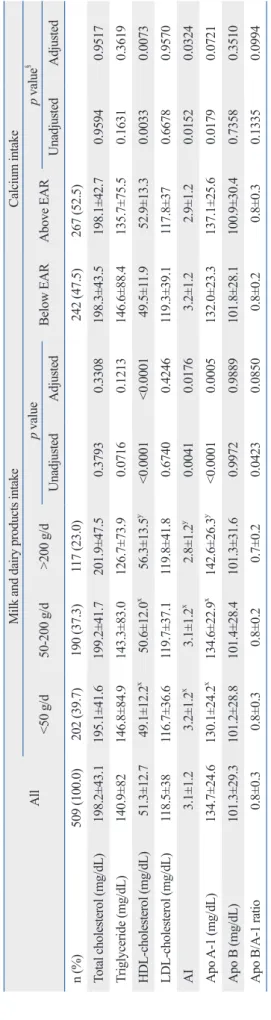
Purpose: This study was conducted to determine the association between intake of milk and dairy products as well as calcium and biomarkers related to lipid me- tabolism in Korean female patients with type 2 diabetes. Materials and Meth- ods: A cohort of 509 female subjects (mean age: 59.0 years; range: 35-80 years) was recruited from Huh’s Diabetes Clinic in Seoul between 2005 and 2010. Di- etary intake was assessed using a validated food-frequency questionnaire. Sub- jects were divided into three groups on the basis of their daily intake of milk and dairy products [<50 g/day (0<50 g/day), 50-200 g/day, and >200 g/day (>200- 1201 g/day)] and then further divided into two groups according to their daily calcium intake: below and above the estimated average requirement (EAR). Re- sults: After adjustment for age, body mass index, energy intake, exercise, use of nutritional supplements and cholesterol medication, the level of serum high-den- sity lipoprotein (HDL)-cholesterol was significantly higher in subjects with milk and dairy products consumption of >200 g/day than in subjects in the other two groups. Those subjects with a milk and dairy products consumption of >200 g/day had significantly higher levels of apolipoprotein A-1 and a significantly lower atherogenic index than the other two groups. Patients with a calcium intake above the EAR exhibited a significantly greater serum HDL-cholesterol level than those with a calcium intake below the EAR. Conclusion: Milk and dairy products, good sources of calcium, play a positive role in lipid profiles in female patients with type 2 diabetes.
Key Words: Milk, dairy products, calcium, dyslipidemias
INTRODUCTION
The prevalence of type 2 diabetes (T2D) among Korean adults over 30 years of age has increased from 8.6% in 2001 to 9.7% in 2008,1,2 and the number of pa- tients with T2D is predicted to reach about 300 million worldwide by 2025 with more than half from Asia.3 Cardiovascular diseases (CVDs) are a major cause of death among patients with T2D, and T2D is an important risk factor for CVD.4 Abnormal glucose-insulin homeostasis increases the likelihood of patients with T2D having impaired postprandial lipid metabolism, leading to conditions such as
CVD than do male T2D patients.
MATERIALS AND METHODS
Study subjects
The participants were patients with type 2 diabetes who visited Huh’s Diabetes Clinic in Seoul, Korea. Among the 1559 visitors to the clinic between 2005 and 2010, 1326 pa- tients aged 35-80 years with a diagnosis of type 2 diabetes were selected and interviewed for the baseline investiga- tion. Of that baseline sample, 647 female patients with type 2 diabetes were selected for further analysis. Of these, 138 subjects were excluded either due to insufficient or missing information, such as body mass index (BMI), dietary in- take, blood glucose, and serum lipid profiles, or if they had an energy intake of <500 kcal/day or >4000 kcal/day.
Therefore, 509 female patients with type 2 diabetes were eligible for this analysis. The subjects were classified into three groups (<50 g/day, 50-200 g/day and >200 g/day) based on their daily consumption of milk and dairy prod- ucts: 0-<50 g/day, 50-200 g/day, and >200-1201 g/day. They were also stratified into two groups based on the estimated average requirements (EARs) of calcium intake: below and above the EAR. The research protocol was approved by the Institutional Review Board of Yonsei University Medical Center, and written informed consent to participate was ob- tained from all subjects.
General characteristics and dietary assessments
All of the female participants were interviewed individually at the first visit by nutrition graduate students to obtain data regarding their general characteristics, lifestyle behaviors, and food consumption. Food consumption for the previous year was assessed with a food frequency questionnaire (FFQ), which included 114 food items and has been vali- dated elsewhere.23 Dietary intakes of nutrients and food groups were analyzed using CAN-pro 3.0 software (The Korean Nutrition Society, Seoul, Korea). The daily con- sumption of milk and dairy products was assessed by cal- culating the sum of the daily intake of whole milk, fat-mod- ified milk, yogurt, ice cream, and cheese for each of the subjects.
Anthropometric parameters, blood pressure, and blood profiles
Standing height and body weight were measured using the dyslipidemias with high levels of triglyceride and low lev-
els of high-density lipoprotein (HDL)-cholesterol, which contribute to an increased risk of CVD.5,6
A healthy lifestyle that includes healthy eating is very im- portant for preventing T2D and its complications including CVDs. Milk and dairy products, which are the best food sources of calcium, have been recommended for a healthy diet in diabetic patients. Recent studies have found that consuming milk and dairy products may reduce the risk of T2D.7-10 Tremblay and Gilbert9 reported that dairy products including calcium and vitamin D may play a significant role in reducing the risk of insulin resistance syndrome and T2D by regulating appetite, fat metabolism, and weight gain.10
Beneficial effects of consuming milk and dairy products on CVD-related mortality have been reported.11-13 The Cor- onary Artery Risk Development in Young Adults study, which was based on general community samples, found that dairy consumption had a strong inverse association with key risk factors for CVD including obesity, hyperten- sion, and insulin resistance syndrome.14
However, most of the studies that have investigated the relationship between the intake of milk or dairy products and the risk factors for CVDs including lipid metabolism have been conducted in healthy populations.15,16 Few studies have evaluated the effect of milk and dairy products on lipid metabolism in patients with T2D, and there are few reports on the association between total dairy intake (not milk or fermented dairy products) and HDL metabolism.17,18 More- over, most studies on the relationship between milk or calci- um intake and lipid metabolism have involved Western pop- ulations with relatively high milk and calcium intakes,17,19,20 with few studies among populations who traditionally have a low consumption of dairy products. According to the Ko- rea National Health and Nutrition Survey (2007-2009), Ko- rean adults over the age of 19 years consumed 74.0±4.4 g (mean±SD) of milk and dairy products daily,2 which is markedly lower than populations in the United States (mean of 1.6 servings=156 g, 2003-2006 National Health and Nu- trition Examination Survey),21 United Kingdom (259.6±
180.1 g, Nutrition Diet and Nutrition Survey),22 France (205.2±160.5 g, INCA2),22 and Denmark (375.6±281.2 g, Danish Dietary Survey).22
This prospective study investigated the relationship be- tween milk and calcium intake and lipid profiles among Ko- rean female patients with T2D, who have a low intake of milk and dairy products and a higher risk of death caused by
between groups. When statistically significant effects were demonstrated between three groups based on the relative consumptions of milk and dairy products, the Tukey post hoc test was used to identify group differences at p<0.05. The multicollinearity of adjusting variables was tested using coef- ficient or chi-square test, as appropriate. SAS 9.2 (SAS Insti- tute, Cary, NC, USA) was used for all statistical analyses, and the level of statistical significance was set at p<0.05.
RESULTS
General characteristics, anthropometric parameters, blood glucose profiles, daily milk, and dairy products, and calcium intakes
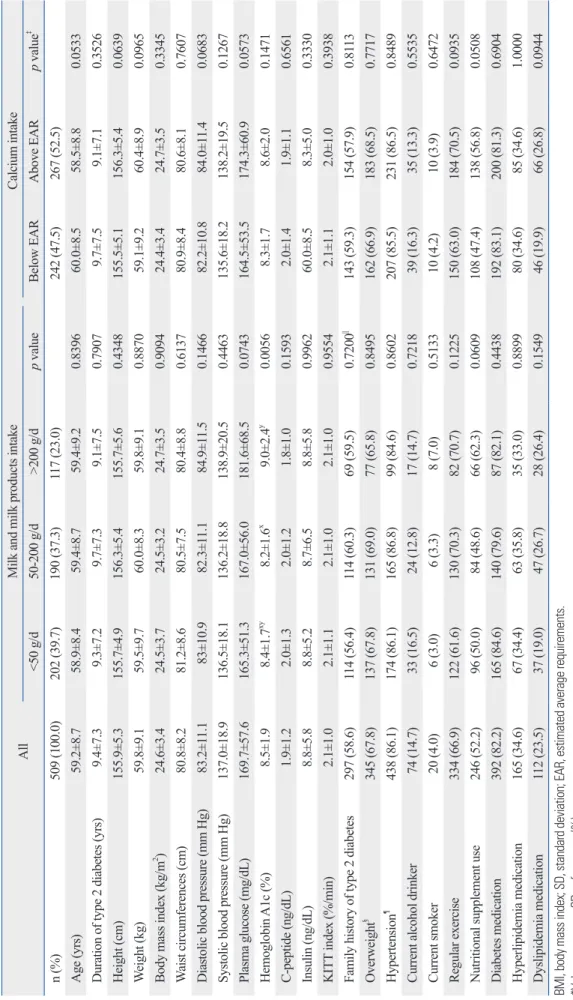
The patients’ general characteristics, anthropometric pa- rameters, and blood glucose profiles are given relative to intakes of milk and dairy products in Table 1. The 509 mid- dle-aged female patients with type 2 diabetes were aged 59.0±8.7 years (mean±SD). Patients with a milk/dairy prod- ucts consumption of >200 g/day had significantly higher se- rum HbA1c concentrations than those consuming 50-200 g/day (p=0.0176).
Intakes of food and nutrients, and of daily milk, dairy products, and calcium
The daily food intakes of the female patients with type 2 di- abetes, as assessed by an FFQ, are listed in Table 2. The av- erage total daily intakes of food and animal and plant foods were 1348.3 g/day, 269.2 g/day, and 1079.0 g/day, respec- tively. Milk and dairy product intake according to calcium intake was 60.4 g/d and 178.0 g/d. Female patients with calcium intake above EAR showed significantly higher milk and dairy products consumption than the other group (p<0.0001). Most of daily food intakes showed significant differences among the three groups except meat and meat products, cereals and cereal products, beans and bean prod- ucts and beverage. All of daily food intakes were signifi- cantly higher in female patients with calcium intake above EAR, except beverage, than the other group.
Daily nutrient intakes and density, and the percentage of energy intakes delivered from each of the three macronutri- ents are presented in Table 3. The mean total energy intake of the patients in this study was 1768.9 kcal. The total in- takes of carbohydrate, protein, and fat were 263.9 g/day, 74.8 g/day, and 47.1 g/day, respectively. Calcium intake ac- cording to milk/dairy products consumption showed signif- In-body 4.0 system (Biospace, Seoul, Korea), with the sub-
jects wearing light clothes and no shoes. BMI (kg/m2) was calculated and waist circumference was determined with a measuring tape (Tanita anthropometric tape, Seoul, Korea).
Diastolic and systolic blood pressures were measured using an automatic blood-pressure monitor (Biospace, Seoul, Ko- rea), with the subjects in a sitting position and after a 10-min- ute rest. Hypertension was defined as a systolic blood pres- sure of >120 mm Hg and a diastolic blood pressure of >80 mm Hg, or if the subject was taking hypertension medication.
Blood samples were drawn into EDTA-containing tubes after a minimum 12-hour overnight fast, and centrifuged at 1372×g for 20 minutes at 4°C (Hanil Science Industrial, Seoul, Korea). Fasting serum levels of glucose were mea- sured using a glucometer (Accutrendalpha, Boehringer, Mannheim, Germany), and hemoglobin A1c (HbA1c) was measured using an automated analyzer (HLD-723 G7, Tosoh, Tokyo, Japan). The rate of disappearance of plasma glucose was measured after an intravenous injection of regular insu- lin (0.1 U/kg), and the result of this insulin tolerance test (%/min) was used as an index of insulin resistance. Serum levels of total cholesterol, triglyceride, and HDL-cholester- ol were determined with an autoanalyzer (Cobas Mira Roche Autoanalyzer, Hoffmann-La Roche, Basel, Switzerland).
Low-density lipoprotein (LDL) cholesterol and the athero- genic index (AI) were calculated using the equations de- scribed by Friedewald, et al.24 and Lauer, et al.25 respective- ly. The C-peptide, insulin, apolipoprotein A-1 (Apo A-1) and apolipoprotein B (Apo B) levels were determined at the Seoul Medical Science Institute.
Statistical analysis
Data are expressed as means with SDs obtained through un- adjusted analysis. Categorical values are represented by numbers and percentages. Variables with skewed distribu- tions were log-transformed before analysis. Differences be- tween three groups were evaluated using ANOVA, includ- ing the post hoc comparisons of Tukey, and differences between two groups were evaluated using t-test for unad- justed analyses with normal distribution variables. Food group intakes were investigated by nonparametric analysis such as Kruskal-Wallis or Wilcoxon-Mann-Whitney two- sample tests, as appropriate. Categorical variables were evaluated using the chi-square test to investigate differences between groups. After adjustment for age, BMI, total energy intake, exercise, and use of nutritional supplements and cho- lesterol medication, a general linear model was performed
Table 1. General Characteristics, Anthropometric Parameters and Blood Glucose Profiles of According to Milk and Dairy Products and Calcium Intake*,† AllMilk and milk products intakeCalcium intake <50 g/d50-200 g/d>200 g/dp valueBelow EARAbove EARp value‡ n (%) 509 (100.0)202 (39.7)190 (37.3)117 (23.0)242 (47.5)267 (52.5) Age (yrs) 59.2±8.7 58.9±8.4 59.4±8.7 59.4±9.20.8396 60.0±8.5 58.5±8.80.0533 Duration of type 2 diabetes (yrs) 9.4±7.3 9.3±7.2 9.7±7.3 9.1±7.50.7907 9.7±7.5 9.1±7.10.3526 Height (cm)155.9±5.3155.7±4.9156.3±5.4155.7±5.60.4348155.5±5.1156.3±5.40.0639 Weight (kg) 59.8±9.1 59.5±9.7 60.0±8.3 59.8±9.10.8870 59.1±9.2 60.4±8.90.0965 Body mass index (kg/m2 ) 24.6±3.4 24.5±3.7 24.5±3.2 24.7±3.50.9094 24.4±3.4 24.7±3.50.3345 Waist circumferences (cm) 80.8±8.2 81.2±8.6 80.5±7.5 80.4±8.80.6137 80.9±8.4 80.6±8.10.7607 Diastolic blood pressure (mm Hg) 83.2±11.1 83±10.9 82.3±11.1 84.9±11.50.1466 82.2±10.8 84.0±11.40.0683 Systolic blood pressure (mm Hg) 137.0±18.9 136.5±18.1 136.2±18.8 138.9±20.50.4463 135.6±18.2 138.2±19.50.1267 Plasma glucose (mg/dL) 169.7±57.6 165.3±51.3 167.0±56.0 181.6±68.50.0743 164.5±53.5 174.3±60.90.0573 Hemoglobin A1c (%) 8.5±1.9 8.4±1.7xy 8.2±1.6x 9.0±2.4y 0.0056 8.3±1.7 8.6±2.00.1471 C-peptide (ng/dL) 1.9±1.2 2.0±1.3 2.0±1.2 1.8±1.00.1593 2.0±1.4 1.9±1.10.6561 Insulin (ng/dL) 8.8±5.8 8.8±5.2 8.7±6.5 8.8±5.80.9962 60.0±8.5 8.3±5.00.3330 KITT index (%/min) 2.1±1.0 2.1±1.1 2.1±1.0 2.1±1.00.9554 2.1±1.1 2.0±1.00.3938 Family history of type 2 diabetes297 (58.6)114 (56.4)114 (60.3)69 (59.5) 0.7200|| 143 (59.3)154 (57.9)0.8113 Overweight§ 345 (67.8)137 (67.8)131 (69.0)77 (65.8)0.8495162 (66.9)183 (68.5)0.7717 Hypertension¶ 438 (86.1)174 (86.1)165 (86.8)99 (84.6)0.8602207 (85.5)231 (86.5)0.8489 Current alcohol drinker 74 (14.7) 33 (16.5) 24 (12.8)17 (14.7)0.7218 39 (16.3) 35 (13.3)0.5535 Current smoker20 (4.0) 6 (3.0) 6 (3.3)8 (7.0)0.513310 (4.2)10 (3.9)0.6472 Regular exercise334 (66.9)122 (61.6)130 (70.3)82 (70.7)0.1225150 (63.0)184 (70.5)0.0935 Nutritional supplement use246 (52.2) 96 (50.0) 84 (48.6)66 (62.3)0.0609108 (47.4)138 (56.8)0.0508 Diabetes medication392 (82.2)165 (84.6)140 (79.6)87 (82.1)0.4438192 (83.1)200 (81.3)0.6904 Hyperlipidemia medication165 (34.6) 67 (34.4) 63 (35.8)35 (33.0)0.8899 80 (34.6) 85 (34.6)1.0000 Dyslipidemia medication112 (23.5) 37 (19.0) 47 (26.7)28 (26.4)0.1549 46 (19.9) 66 (26.8)0.0944 BMI, body mass index; SD, standard deviation; EAR, estimated average requirements. *Values are mean±SD or frequency (%). † Plasma glucose, HbA1C, C-peptide, insulin and KITT index are log transformed. ‡ Student’s t-test for differences between subjects according to above and below intake of calcium EAR. § Analyzed by chi-square test. || BMI >23 kg/m2 . ¶ Diastolic blood pressure ≥80, systolic blood pressure ≥120 or taking hypertension medication. xy Values with different alphabets are significantly different among the three groups by ANOVA at p<0.05; including the post hoc comparisons of Tukey.
Table 2. Daily Food Intakes by Food Group According to Milk and Dairy Products and Calcium Intake* Food group (g)AllMilk and dairy products intakeCalcium intake <50 g/d50-200 g/d>200 g/dp valueBelow EARAbove EARp value† n (%)509 (100.0)202 (39.7)190 (37.4)117 (23.0)242 (47.5)267 (52.5) Meat and meat products 62.1±57.3 58.8±58.8 61.5±51.9 68.8±62.7 0.0944 42.6±35.3 79.7±66.9<0.0001 Fish and shellfish 57.7±50.4 53.9±57.5x 56.4±41.3xy 66.2±50.4y 0.0029 35.6±22.9 77.7±59.5<0.0001 Eggs and egg products 27.4±23.5 22.2±19.2x 26.8±22.5y 37.4±28.4z <0.0001 17.0±14.1 36.8±26.2<0.0001 Milk and dairy products 122.1±138.1 15.7±16.8x 124.8±47.2y 301.2±165.2z <0.0001 60.4±66.0 178.0±160.9<0.0001 Total animal food 269.2±184.2 150.5±117.0x 269.5±104.8y 473.7±200.5z <0.0001155.7±85.3 372.2±189.2<0.0001 % Total animal food19.5±9.0 12.8±6.2x 20.9±6.9y 28.7±6.7z <0.000116.7±8.821.9±8.5<0.0001 Cereals and cereal products241.3±93.0248.9±91.2233.7±96.1240.6±90.6 0.2346220.0±81.0260.6±98.9<0.0001 Potatoes and starch products 61.1±72.8 52.4±66.8x 67.1±78.8y 66.4±71.9xy 0.0304 38.1±38.3 82.0±88.8<0.0001 Vegetables 428.4±251.6382.2±218x 451.1±271.7y 471.4±260.9y 0.0017 286.8±134.1 556.8±264.2<0.0001 Fruits 172.2±167.3 137.6±131.8x 176.2±161.4y 225.4±212.2y <0.0001 124±108.6 215.9±196.8<0.0001 Seaweeds 6.1±6.5 5.1±5.9x 6.4±6.5y 7.3±7.3y 0.0017 3.8±3.8 8.2±7.7<0.0001 Mushrooms 16.5±26.4 14.3±28.5x 17.2±25.8y 19.1±23.6y 0.0004 10.4±16.6 22.0±31.9<0.0001 Beans and bean products104.3±98.8 100.2±101.4100.2±89.8 118.2±107.6 0.1529 68.9±76.4 136.4±105.8<0.0001 Nut, seeds and products 3.4±5.6 2.6±3.7x 3.8±7.3y 3.9±5.2y 0.0045 1.9±2.9 4.7±7.0<0.0001 Sugar and sugar products 11.4±12.7 10.9±13.8x 10.5±10.6xy 13.5±13.7y 0.0389 7.6±7.1 14.8±15.5<0.0001 Fats and oils12.1±8.8 10.7±8.5x 12.2±8.8xy 14.1±8.9y <0.0001 7.3±4.316.4±9.6<0.0001 Beverage 22.3±57.6 23.9±65.7 17.7±44.2 27.1±61.8 0.1040 18.9±55.3 25.4±59.6 0.0676 Total plant food1079.0±463.7 988.8±423.8x 1096.1±489.5x 1207.0±457.1y 0.0001 787.7±265.81343.1±446.6<0.0001 % Total plant food80.5±9.0 87.2±6.2x 79.1±6.9y 71.3±6.7z <0.000183.3±8.878.1±8.5<0.0001 Total food intakes1348.3±579.6 1139.4±497.2x 1365.7±553.7y 1680.7±595.8z <0.0001 943.3±290.31715.3±529.8<0.0001 SD, standard deviation; EAR, estimated average requirements. *Values are means±SD; which were calculated by CAN pro 3.0 program. † Nonparametric Wilcoxon-Mann-Whitney two-sample test for differences between subjects according to above and below intake of calcium EAR. xyz Values with different alphabets are significantly different among the three groups by Kruskal-Wallis nonparametric test at p<0.05; including the post hoc comparisons of Mann-Whitney analysis.