접수일 2010. 9. 1, 수정완료일 2010. 10. 7, 게재확정일 2010. 10. 12
* 학생회원, 조선대학교 항공우주공학과
** 종신회원, 조선대학교 항공우주공학과
†교신저자, E-mail: [email protected]
硏究論文
터보팬 엔진의 고고도 성능의 초음속 이젝터의 압력회복에 관한 연구
Owino George Omollo*․ 공창덕**†
Pressure Recovery in a Supersonic Ejector of a High Altitude Turbofan Engine Testing Chamber
Owino George Omollo*․ Changduk Kong**†
ABSTRACT
This research aims in finding a more optimal ejector size for evacuating engine exhaust gasses and 20% of the cell cooling air. The remaining 80% of cell cooling air pumped into the test chamber is separately exhausted from the test chamber via a discharge port fitted with flow control valves and vacuum pump. Unlike its predecessor this configuration utilizes a smaller capture area to improve pressure recovery. The modified ejector size has a diameter of 1100mm enough to evacuate 66kg/s jet engine exhaust in addition to about 20%, 24kg/s of the cell cooling air tapped from the sterling chamber. This configurations has an area ratio of the engine exit and ejector inlet of about 1.2.
Simulation results of the proposed ejector configuration, indicates improved pressure recovery.
초 록
본 연구는 최소 압력 모사로 엔진 배기가스를 배출시키기 위한 최적 이젝터 크기를 결정하기 위한 것을 목적으로 한다. 실험 챔버로 유입되는 2차 냉각 공기는 유량제어 밸브들과 진공펌프가 장착된 배 출구를 통해 엔진배기가스는 분리되어 배출된다. 기존 고도시험 장치와 달리, 본 연구에 제안한 형상은 기존 이젝터의 압력 회복을 개선한 좀 더 작은 포획 면적을 가진 배기 이젝트를 사용하면 가스에 스텔 링 챔버로 부터 20% 냉각 공기를 부가하여 배출시키도록 크기가 정해진다. 제안된 형상은 벨마우스 이 젝터와 엔진배기 출구의 면적비가 이론적으로 약 1.2를 갖는다. 제안된 형상의 혼합 공기 모사결과에 따르면 큰 에너지는 기존 시스템 비해 좀 더 개선된 압력 회복과 감소된 전력 소모를 같음을 확인하였 다.
Key Words: Pressure Recovery(압력회복), Gas turbine engine simulation(가스터빈엔진 모사), Duct loss(덕트손실), Performance Simulation(성능모사), Engine modeling(엔진 모델링), CFD analysis(전산유체역학 해석)
1. Introduction
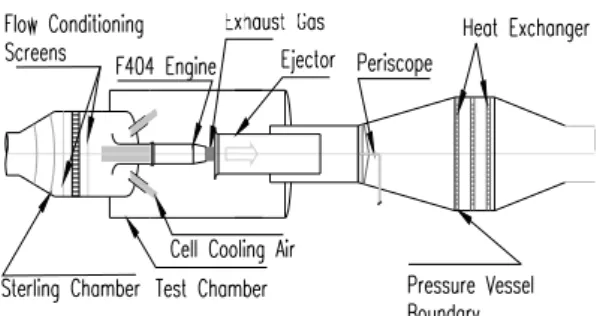
This study looks at the exhaust ejector for a supersonic high altitude environmental engine test chamber for a low bypass turbofan engine F404-402 engine (see Fig. 1).
13 25
21 3 4 44
45 5 2
6 16
63
64 7 8 9
163
a HP leakage to bypass b NGV cooling c HPT cooling d Handling bleed HP leak to LPT exit
b c
LPT cooling overboard bleeds
leakage from bypass d a
41 31
Fig. 1 F404-402 engine layout and station numbering Altitude test chambers simulate real time environmental prevailing conditions at varying air mass flow rate, temperature and pressure with the engine directly connected to the inlet bell mouth and at free jet testing mode to facilitate this. It is important to have exhaust ejector that allows optimal operation and ensures the test facility is not choked during startup run. Although performance testing should not be compromised because of operational cost, a secondary aim of this study is also to come up with a cost effective configuration, which in this case is reflected as the power required for running exhaust gas suction pump[1].
2. Performance Simulation
The study began by steady state and transient performance simulation of the engine to determine thermodynamic properties of the intake air requirements and exhaust gas properties using a commercial software Gasturb 9 program.
Parameter Value
Air Flow (kg/s) 66 kg/s
Afterburner Temperature 2200 K Sea Level Static (Temp) 288.15 K
Thrust (lbf) 77.7 kN
Table 1. Engine performance parameters
Table 1 above outline partial engine performance data stated by the engine manufacture for the F404-402 low bypass turbo shaft engine. This data was used as reference to confirm steady state design point as seen in the Fig. 2 below.
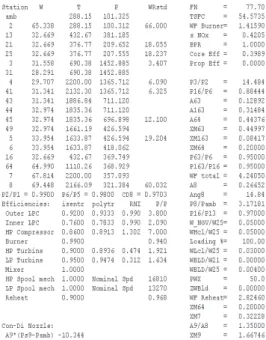
Fig. 2 Gasturb 9 design point simulation results
Exhaust gas conditions of the gas entering the ejector must be know to determine the ejector performance hence the reason to perform steady state simulation of the engine.
The Fig. 2 above shows the output window of a commercial simulation software Gasturb 9 used to get the selected engine design point.
It is clear from Fig. 2 that the estimated
design point values of thrust, air mass flow rate, after burner temperature, exhaust gas temperature and fuel consumption values at sea level static were found and match those given by engine manufacturer shown in table 1 above.
Transient simulation was also run to find the exhaust gas conditions at different flight conditions or test schedule. The simulation results values of velocity, total pressure, total temperature and air mass flow rate were used as input data for the ejector.
Once engine performance data is determined, they were used to determine the size of the supersonic ejector according to the design regulations provided for in AIAA publications on thrust and performance prediction guide book[2, 3].
3. Facility Layout Modeling and Sizing
Fig. 3 Supersonic altitude test chamber configuration
The modelled test facility consists of a sterling chamber where controlled engine intake parameters are supplied to the engine via the intake bell mouth (see Fig 3).
The engine is mounted on sliding engine thrust stand and linked to air supply by the engine interface adapter for direct connection testing DC. Supersonic exhaust diffuser is
Engine Inlet @ A/B ON and OFF Test
Mode Press. Air flow
Temp.
Low (K) High (K)
DC 1 100 10 100 800
DC 10 800 66 100 800
FJ 300~800 10~66 100 800
Table 2. Sterling chamber testing mode
placed directly behind the engine exit connected to a divergent convergent cooling and noise suppression assembly.
Table 2 shows the minimum and maximum limit values of pressure, air mass flow and temperature used as input value in the transient Gasturb 9 simulation. A total of 10 direct connection (DC) test and free jet (FJ) were simulated, temperature and pressure values were altered at an interval of 100 from 100 to 800 points in each successive test consecutively.
For every test respective exhaust gasses values of pressure, temperature, mass flow and Mach number were collected with the maximum flow parameters used to determine and size the ejector duct.
4. Assumptions and Considerations
To determine the duct size and pressure loss of the intake nozzle, exhaust duct and diffuser calculations were performed following several duct design algorithms. In this analysis intake and ejector was considered to be straight and without inlet screen. Blockage ratio and cell chocking would however be considered when determining overall pressure loss of a fully equipped test facility.
From the calculations the following dimensions were reached[1].
Item L Diameter Eff Diameter length
Intake 1800 mm 1400mm 7300mm
Diffuser 1200 mm 1100mm 10000mm
Table 3. Optimum operational dimensions
The markings L and Eff in Table 3 indicate to lip diameter and effective diameter respectively.
Table 3 indicates the optimum engine intake bellmouth nozzle diameter 1400mm shown in Fig. 4 and the exhaust diffuser diameter 1100 mm represented in Fig. 4.
Intake Bell mouth Exhaust ejector
Fig. 4 Intake 2D Autocad Inlet and Diffuser Design
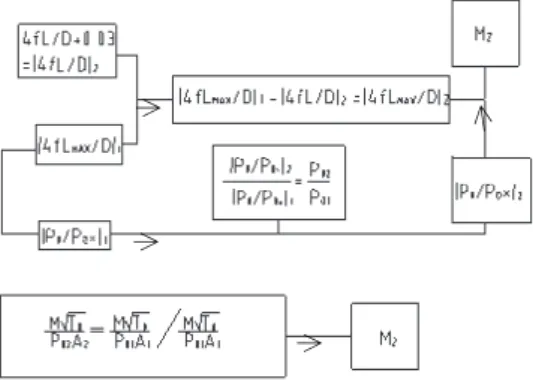
Fig. 5 Diffuser sizing calculation flow
Flow calculation algorithm, calculation flow used in sizing the intake bell mouth and exhaust diffuser respectively are shown in the Fig. 5 above. The equations in the figure starts by calculating pressure drop as a function of friction and ratio of the duct length to the diameter respectively. From this we can determine the pressure ratios at the intake and exit of the exit that finally leads us to
determining the exit velocity at the duct exit.
Analysis with CFD software require 3D modeling as seen in Fig. 6 performed using Solid works software and then the model imported to CFD solver for analysis.
Fig. 6 Modeling of the testing facility
The Fig. 6 above represents 3D model of the full testing facility including the ejector section. CFD simulations were performed using transient engine simulation results as input data. Pressure loss values generated from the model were then respectively used to calculate pressure recovery.
5. CFD Results and Observations
Figure 7 represents the respective trend of average pressure, temperature, velocity air mass flow output values plot generated from CFD simulation the numerical results at the end of the simulation and the formular 1 below pressure recovery were used to calculate pressure loss along the ejector duct.
Figure 7 similarly shows how values of
Fig. 7 CFD simulation output parameters plot
pressure, temperature and velocity changes in the ejector towards the exit.
Speed of the exhausted gas from performance simulation was determined to be Mach 1.66 substituted in the formular below.
(1)
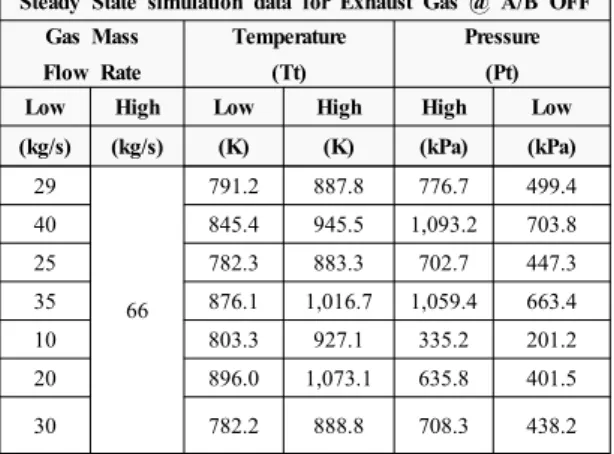
Respective value of total pressure results at the outlet and temperature at the entrance of the ejector were recorded and substituted for in the formula to calculate pressure ratio seen in Table 4 below[4, 5].
Steady State simulation data for Exhaust Gas @ A/B OFF Gas Mass
Flow Rate
Temperature (Tt)
Pressure (Pt)
Low High Low High High Low
(kg/s) (kg/s) (K) (K) (kPa) (kPa)
29
66
791.2 887.8 776.7 499.4
40 845.4 945.5 1,093.2 703.8
25 782.3 883.3 702.7 447.3
35 876.1 1,016.7 1,059.4 663.4
10 803.3 927.1 335.2 201.2
20 896.0 1,073.1 635.8 401.5
30 782.2 888.8 708.3 438.2
Table 4. Exhaust gas temperature and pressure simulation results
This table outlines engine simulation exhaust gas parameters reflecting both the lowest and the highest possible range at that test mode.
An interesting observation made during performance simulation was for this category of engine testing could only be performed up flight Mach numbers of Mach 2.2 and for mass flow rate of 66kg/s to be met then intake temperature would be limited to below 510K anything higher resulted in simulation error[5, 6].
Fig. 8 CFD simulation of exhaust ejector section
Figure 8 shows CFD simulation graphical output values of static pressure distribution.
Pressure loss due to wall friction and ejector geometry along the duct length is as represented in the Fig. 9 below.
Fig. 9 Pressure loss along the duct length
This Fig. 9 shows pressure reducing towards the exit end of the duct. Several tests were performed at different pressures starting from 100 kPa to 1100 kPa at intervals of 100.
Air mass flow 10~66 kg/s Total Pressure 100~1100kPa Temperature 300~2200K
Fluid Air
Flow Compressible
Simulation Transient
Table 5. Ejector duct CFD input parameters
The following governing parameters were used for CFD simulation. The values on the Table 5 above were input for the intake of the ejector and simulation run each time 100 iterations several times changing air mass pressure and temperature between the ranges indicated on Table 5.
It should be noted that the flow is supersonic and series of shockwave are expected for inside the ducts the intensity and flow regime has however not been included in this paper.
Pressure and temperature in the duct however indicated that wall thickness of not less than 6t with pin tube cooling would be a factor to consider.
Table 6 outlines the ejector output pressure
Ejector end Gas Condition A/B ON Gas Mass
Flow Rate
Traditional Ejector Pressure
Proposed Ejector Pressure
Low High (Pt0) (Pt2) (Pt0) (Pt2)
(kg/s) (kg/s) (kPa) (kPa) (kPa) (kPa)
29 29 100 86.65 100 89.82
40 40 200 186.72 200 188.92
25 25 300 286.943 300 290.603
40 40 400 385.126 400 389.427
20 20 500 488.015 500 490.315
35 35 600 587.243 600 591.251
10 10 700 686.365 700 692.471
20 20 800 785.792 800 791.723
7 7 900 887.653 900 893.552
9 9 1000 990.449 1000 993.923
30 30 1100 1088.952 1100 1098.842
Table 6. Ejector input/output total pressure simulation results
results for both the traditional and proposed ejector. Pressure loss was less in the proposed ejector more so due to ejector size reduction.
Fig. 10 Cross sectional view of ejector pressure flow regime
The flow direction is indicated by arrows and pressure in the ejector is represented in Fig. 10.
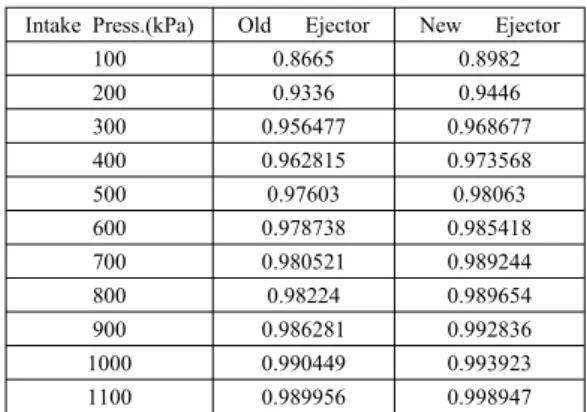
Intake Press.(kPa) Old Ejector New Ejector
100 0.8665 0.8982
200 0.9336 0.9446
300 0.956477 0.968677
400 0.962815 0.973568
500 0.97603 0.98063
600 0.978738 0.985418
700 0.980521 0.989244
800 0.98224 0.989654
900 0.986281 0.992836
1000 0.990449 0.993923
1100 0.989956 0.998947
Table 7. Simulation calculated pressure recovery values
Table 7 outlines the calculated pressure ratio values developed from the data on Table 6 above in all the cases pressure ratio of the ejector exit to the ejector inlet were calculated and tabulated as shown.
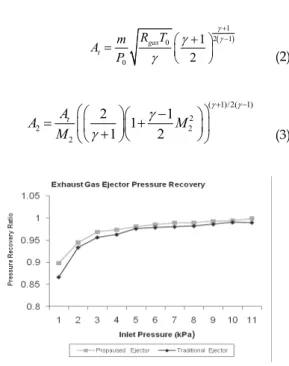
Graph on Fig. 11 below represents plots of pressure recovery values of the two ejectors against intake pressure.
( 1)
2 1
0 0
1 2
gas t
m R T A P
γ
γ γ
γ
+
+ −
⎛ ⎞
= ⎜⎝ ⎟⎠ (2)
( 1)/2( 1) 2
2 2
2
2 1
1 1 2
A
tA M
M
γ γ
γ γ
+ −
⎛ ⎛ ⎞ ⎛ − ⎞ ⎞
= ⎜ ⎝ ⎜ ⎝ + ⎝ ⎟ ⎠ ⎜ + ⎟ ⎠ ⎟ ⎠
(3)Fig. 11 Pressure recovery comparisons of the two ejectors
6. Conclusions
This paper aims to study on the pressure recovery of exhaust ejector of a high altitude environmental test chamber for the F404-402 low bypass turbofan engine the engine exits exhaust air mass of 66kg/s at Mach 1.66.
This paper proposes the use of a smaller ejector that has a frontal area ratio of the bellmouth ejector to engine exhaust area of 1.2 adequate to expel engine exhaust with an additional 20% cell cooling air.
Pressure recovery value of between 0.89 to 0.99 was realized after simulating the ejector
with zero cell cooling air and 20% cell cooling air respectively an indication that variation in test cell chamber pressure does not affect pressure recovery greatly.
Since only part of the cooling air is discharge through the ejector a smaller evacuation pump is used resulting in less power consumption.
From the results this paper therefore proposes the implementation of an exhaust ejector with smaller frontal area as a way of improving pressure recovery in altitude test facility.
References
1. Eugene E Covert, Thrust and Drag Prediction and Verifications, AIAA Vol 98 2. Joseph A Johnson, Pressure Recovery and
Related Properties,111 et al Yale University 3. P. G Parikh, New Concept for Exhaust
Diffuser of Altitude Test Cells, AIAA-84-0634
4. George. O .Omollo, Kong ChangDuk ,CFD Analysis of Pressure Recovery in Supersonic Diffuser of a High altitude Test Facility. AJCPP 2010(Miyazaki Japan) 5. J R Turner, Pressure Loss Calculation
Procedure for High Speed Flows, MIT-1961 6. George. O .Omollo, Kong ChangDuk Non-
Numerical Pressure Recovery Analysis of ejector Duct in High Altitude Facility, APISAT 2010 Xian