• 검색 결과가 없습니다.

Monitoring Mount Sinabung in Indonesia Using Multi-Temporal InSAR

N/A
N/A
Protected

Academic year: 2021

Share "Monitoring Mount Sinabung in Indonesia Using Multi-Temporal InSAR"

Copied!
10
0
0

로드 중.... (전체 텍스트 보기)

전체 글

(1)

1. Introduction

The Island of Sumatra is located along a segment of the “Ring of Fire”, on the northern boundary of the Australian plate and the southern boundary of the Eurasian plate (Global Volcanism Program). From the geologic record it is apparent that during the past 2.5 million years, this region has been experiencing

significant seismic and volcanic activity. The Island of Sumatra has been the location for three of the world’s twelve largest earthquakes all with magnitudes higher than Mw 8.5. The 2004 Sumatra earthquake, which is the third largest earthquake (Mw 9.1), was particularly devastating because it was accompanied by a tsunami that killed more than 227,000 people from 14 countries in South Asia and East Africa. The largest eruption

Monitoring Mount Sinabung in Indonesia Using Multi- Temporal InSAR

Chang-Wook Lee*, Zhong Lu** and Jin Woo Kim**

* Division of Science Education, College of Education, Kangwon National University

** Roy M Huffington Department of Earth Sciences, Southern Methodist University

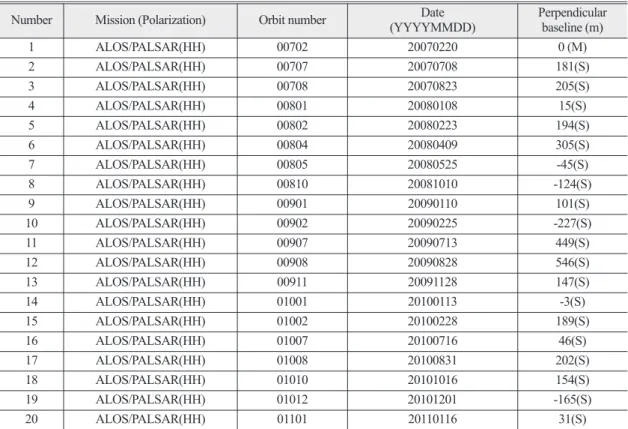
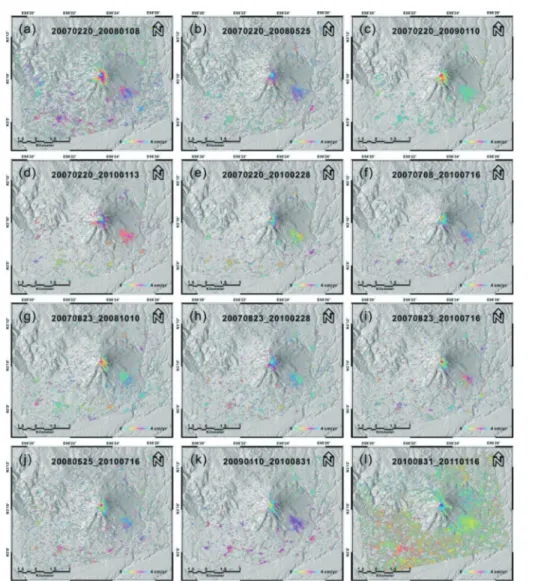
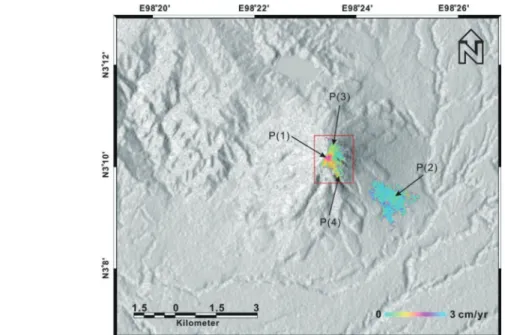
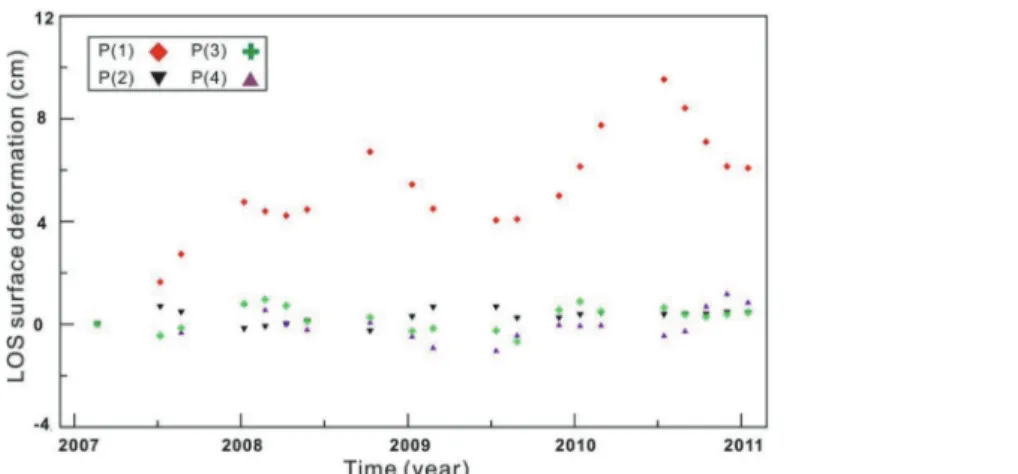
Abstract : Sinabung volcano in Indonesia was formed due to the subduction between the Eurasian and Indo-Australian plates along the Pacific Ring of Fire. After being dormant for about 400 years, Sinabung volcano erupted on the 29th of August, 2010 and most recently on the 1st of November, 2016. We measured the deformation of Sinabung volcano using Advanced Land Observing Satellite/Phased Array type L-band Synthetic Aperture Radar (ALOS/PALSAR) interferometric synthetic aperture radar (InSAR) images acquired from February 2007 to January 2011. Based on multi-temporal InSAR processing, we mapped the ground surface deformation before, during, and after the 2010 eruption with time-series InSAR technique. During the 3 years before the 2010 eruption, the volcano inflated at an average rate of ~1.7 cm/yr with a markedly higher rate of 6.6 cm/yr during the 6 months prior to the 2010 eruption. The inflation was constrained to the top of the volcano. From the 2010 eruption to January 2011, the volcano subsided by approximately 3 cm (~6 cm/yr). We interpreted that the inflation was due to magma accumulation in a shallow reservoir beneath Sinabung. The deflation was attributed to magma withdrawal from the shallow reservoir during the eruption as well as thermo-elastic compaction of erupted material. This result demonstrates once again the utility of InSAR for volcano monitoring.

Key Words : Sinabung volcano, surface deformation, InSAR, time-series http://dx.doi.org/10.7780/kjrs.2017.33.1.4

Received February 9, 2017; Revised February 10, 2017; Accepted February 11, 2017.

Corresponding Author: Jin Woo Kim ([email protected])

This is an Open-Access article distributed under the terms of the Creative Commons Attribution Non-Commercial License (http://creativecommons. org/licenses/by-nc/3.0) which permits unrestricted non-commercial use, distribution, and reproduction in any medium, provided the original work is properly cited

ISSN 2287-9307 (Online)

Article

(2)

event in this region, with a volcanic explosivity index (VEI) of 8, occurred between 69,000 and 77,000 years ago at Toba volcano on the Island of Sumatra, less than 50 km southeast of Sinabung.

Mount Sinabung is a stratovolcano in the northwestern part of the Island of Sumatra in Indonesia (Fig. 1a). The volcano was formed during the Pleistocene to Holocene and consists of andesitic and dacitic lavas. Sinabung’s 2,460-m-high conical structure has four overlapping craters (Global Volcanism Program). It is mostly covered with dense vegetation and only the top of the volcano is free of vegetation (Fig.

1b). The four summit vents are elongated from north- south and range from 60 m to 300 m in diameter (Figs.

1c and d). Little is known about the volcano’s eruption history, but the last historical eruption occurred around 400 years ago. Because of this long dormancy, the

volcano has been poorly monitored. The latest eruption at Sinabung began on the 29th of August, 2010. This explosive eruption produced ash plumes rising several kilometers above the crater and forced the evacuation of 20,000 to 30,000 people within a 6 km radius of the volcano. Two individual ash plumes from separate vents near the summit were produced during this eruption, one vertical and one horizontal (Figs. 2a and b). Explosions and ash plumes accompanied by strong volcanic tremors, which were felt by residents as far as 8 km away, continued until the 22nd of September.

According to the Center of Volcanology and Geological Hazard Mitigation (CVGHM), the ash plume, over the duration of this eruption, reached a maximum height of 5 km above the crater floor on the 7th of September.

The volcano remained dormant for another three years before erupting again on the 15th of September, Korean Journal of Remote Sensing, Vol.33, No.1, 2017

Fig. 1. (a) Sinabung volcano, located in the northern region of the Island of Sumatra, Indonesia. (b) Landsat-7 image acquired on May 19, 2003 of the Mount Sinabung area. (c) Averaged SAR amplitude image between January 1, 2007 and January 16, 2011.

(d) Combined Landsat-7 and averaged SAR images. Red arrows indicate the location of multi-craters and the yellow dotted

lines delineate the extent of the rocky area.

(3)

2013. During this eruption the ash plume rose to an altitude of 6.1 km, and 3,700 people within a 3-km radius of the volcano were evacuated. Moreover, volcanic ash fell as far away as 50 km from the volcano in the northeast direction. Landsat 7 satellite image (Fig. 2c) acquired 4 days before the eruption (September 11, 2013) shows a white ash cloud over the summit of Sinabung and a grey volcanic ash plume on the east side of the volcano.

The size of Sinabung volcano and the frequent and complex nature of its eruptions make it difficult to study the deformation that is occurring here using traditional methods that require surface based instruments. InSAR is an efficient method for measuring surface deformation over large areas (Massonnet and Feigl, 1998; Rignot, 2008; Ng et al., 2009; Lu et al., 2009;

Jung et al., 2013a), and has been applied worldwide in the study of volcanic deformation (Pritchard and

Simons, 2004; Lu et al., 2010; Lu and Dzurisin, 2014;

Chaussard and Amelung, 2012; Ebmeier et al., 2010;

Philibosian and Simon, 2011; Furuta, 2009). Because Sinabung is heavily vegetated, there is too much loss of coherence in C-band InSAR imagery. However, Chaussard and Amelung (2010, 2012) processed thirteen L-band ALOS/PALSAR images from Sinabung, acquired before 2010 that show a progressive rate of inflation of 2.2 cm/yr. In this study, we used twenty ALOS/PALSAR data (Table 1) with calibrated radar backscatter at HH polarization, including seven new images acquired in 2010 and January 2011, to study deformation of the volcano.

We applied a small baseline subset (SBAS) InSAR technique (Berardino et al., 2002; Lee et al., 2011) to estimate time-series surface deformation using a multi- interferogram processing approach (Rignot, 2008; Pan and Tang, 2010). Atmospheric artifacts are reduced Fig. 2. Twin ash plumes from Sinabung volcano eruption of 29-30th of August, 2010. Picture by the Jakarta Post on the 29th of August

(a) and the 30th of August (b). (c) Landsat 7 image (RGB = 3,2,1) acquired on September 11, 2013.

(4)

through spatio-temporal filtering after the mean deformation is obtained (Jung et al., 2013b) and iterative processing can further improve the time-series deformation estimates (Lee et al., 2011). When using this algorithm, the deformation for a specific time period can be calculated more precisely by minimizing all error components (Lee et al., 2012). This technique of a refined SBAS time-series analysis can successfully measure deformation with an error of 0.2 to 0.9 mm in the temporal domain and a root mean square error (RMSE) of 0.66 mm/yr in the spatial domain (Lee et al., 2012).

2. Data processing

We initially applied InSAR processing to our SAR

dataset, and then carried out the SBAS processing and stacking to characterize the surface deformation of the Sinabung volcano in spatio-temporal domain. Using twenty ALOS/PALSAR images from the 20th of February, 2007 to the 16th of January, 2011 (Table 1), we generated 39 interferograms (Fig. 3).

Most of the interferograms had a perpendicular baseline of less than 400 m, but one interferogram had a baseline of 550 m. The best coherence was constrained on the volcano summit. Outside the summit, coherence was maintained only at many scattered patches of rocky and less-vegetated areas (i.e.

selected interferograms in Fig. 4). Figs. 4(a)-(k) show interferograms acquired from the 20th of February, 2007 to the 31st of August, 2010, spanning 1 to 3 years.

These images show 2 to 6 cm of surface uplift in the direction of the satellite’s line of site (LOS) over the Korean Journal of Remote Sensing, Vol.33, No.1, 2017

Table 1. Characteristics of ALOS/PALSAR data used in this study

Number Mission (Polarization) Orbit number Date

(YYYYMMDD) Perpendicular baseline (m)

1 ALOS/PALSAR(HH) 00702 20070220 0 (M)

2 ALOS/PALSAR(HH) 00707 20070708 181(S)

3 ALOS/PALSAR(HH) 00708 20070823 205(S)

4 ALOS/PALSAR(HH) 00801 20080108 15(S)

5 ALOS/PALSAR(HH) 00802 20080223 194(S)

6 ALOS/PALSAR(HH) 00804 20080409 305(S)

7 ALOS/PALSAR(HH) 00805 20080525 -45(S)

8 ALOS/PALSAR(HH) 00810 20081010 -124(S)

9 ALOS/PALSAR(HH) 00901 20090110 101(S)

10 ALOS/PALSAR(HH) 00902 20090225 -227(S)

11 ALOS/PALSAR(HH) 00907 20090713 449(S)

12 ALOS/PALSAR(HH) 00908 20090828 546(S)

13 ALOS/PALSAR(HH) 00911 20091128 147(S)

14 ALOS/PALSAR(HH) 01001 20100113 -3(S)

15 ALOS/PALSAR(HH) 01002 20100228 189(S)

16 ALOS/PALSAR(HH) 01007 20100716 46(S)

17 ALOS/PALSAR(HH) 01008 20100831 202(S)

18 ALOS/PALSAR(HH) 01010 20101016 154(S)

19 ALOS/PALSAR(HH) 01012 20101201 -165(S)

20 ALOS/PALSAR(HH) 01101 20110116 31(S)

•Perpendicular baseline (m): calculation perpendicular baseline information of Master (M) image corresponding to Slave (S)

images respectively.

(5)

Fig. 4. (a)-(k) represent surface deformation (inflation) on the summit with a high-coherence area before the eruption. (l) shows surface deformation (deflation) in the opposite direction compared to (a)-(k).

Fig. 3. Thirty-nine high-coherence interferograms according to perpendicular baseline using 20 SAR images.

(6)

volcano summit while the interferogram from the 31st of August, 2010, to the 16th of January, 2011, that spans the 2010 eruption, show 3 cm of subsidence over the summit area.

3. Results

An averaged surface deformation rate map (Fig. 5) was generated from 39 interferograms using SBAS processing. The areas of each interferogram with the coherence less than 0.4 were excluded from our analysis. The volcano summit (P1) experienced about 9 cm of inflation from the 20th of February, 2007, to the 31st of August, 2010 (Fig. 5). The inflation was likely due to the intrusion of magma from a deep source to the shallow reservoir. At locations P2, P3, and P4, surface deformation was not significant during the observation period (Fig. 5).

This suggests that the inflation at Sinabung was constrained within a radius of about 500 m from the

volcano summit. The time-series surface deformation generated by SBAS processing includes two noticeable fluctuations around early and late 2008 at the summit (P(1) in Fig. 6) compared to the stability at other selected points (P(2), P(3), and P(4) in Fig. 6).

This phenomenon may have been caused by the depressurization of the magma chamber due to periodic volcanic degassing at the summit of Sinabung. In accordance with this analysis, surface deformation of the summit area steadily increased from the period of Fig. 7(a) until the period of Fig. 7(o) with a ground uplift pattern. However, Figs. 7(p) and (q) show rapid ground uplift after 138 and 184 days, respectively, from Fig. 7(o). It is especially rapid when compared with Fig. 7(o) at the summit, where there is one fringe (4 cm) of increased surface deformation. The deformation in these interferograms is consistent with the ground movement at P(1) in Fig. 5 between the 13th of January, 2010, and the 31st of August, 2010. On the contrary, Figs. 7(r)-(t) displays clear deformation of one fringe (4 cm) in the opposite direction, away from the Korean Journal of Remote Sensing, Vol.33, No.1, 2017

Fig. 5. SBAS-estimated mean surface deformation rate map over high coherence areas (>0.4) exploiting the SAR dataset from 2/20/07

to 1/16/11. P1 represents one of highest deformation areas in the summit. P(2-4) were selected for comparison with a major

deformation area (P1). P2 is an additional point separated from the summit area of Sinabung mountain. P(3-4) are far from the

summit point P1 within the Sinabung mountain area.

(7)

Fig. 7. Cumulative surface deformation maps around summit area (red rectangle in Fig. 5) from the SBAS processing.

Fig. 6. Time series surface deformation estimated by SBAS processing from 2007 to 2011. Red diamond P(1) shows large surface

deformation point on the summit area at Sinabung volcano. Black inverted triangle P(2) represents a reference point in the

bare soil zone. Green cross P(3) and purple triangle P(4) display the northern and southern parts of the mountain from Fig. 5.

(8)

sensor, after the August-September 2010 eruption events. Such a large deformation could be due to a combined effects of depressurization of the shallow magma reservoir due to cooling, and thermo-elastic contraction and poro-elastic settling of eruptive deposits (e.g., Lu et al., 2005; Wadge et al., 2006; Lee et al., 2008; Poland, 2010).

4. Discussion and Conclusion

The SBAS technique was used to precisely estimate surface deformation rates and time-series measurements at Sinabung volcano between 2007 and 2011. Sinabung volcano displayed gradual inflation (~1.7 cm/yr) for approximately 3 years and then transitioned to a period of rapid inflation (~6.6 cm/yr) at the summit of the volcano during the 6 months prior to the main eruption event. A similarly rapid period of deflation (~5.8 cm/yr) occurred during the 4 months of the post-eruption period. The greatest surface deformation was measured to be 8-10 cm at the summit of the mountain a few months before the 2010 eruption.

The Sinabung volcano has a relatively simple eruption cycle model that includes two primary processes. First, the magma chamber is fed from below, causing surface uplift. The inflation trend is punctuated by episodic deflation caused by depressurization of the shallow magma reservoir due to degassing or other processes.

When the resulting pressure in the magma reservoir is sufficient, magma is forced to erupt through the conduit to the surface until the pressure inside the reservoir decreases. Second, the cooling of the magma inside the reservoir as well as the thermo-elastic contraction of the erupted material generated surface deflation as the 2010 eruption. These observations and interpretations are consistent with previous study of volcanic deformation in the area of Sinabung volcano (Chussard and Amelung, 2010, 2012). We can compare InSAR time-series results with GPS observation data from

March 24

th

2011 to verify the movement of the surface inflation or deflation with another SAR satellite mission in future work because GPS stations were installed and monitored on Sinabung volcano early of 2011 after 2010 eruption (Kriswati et al., 2014).

This study shows how the use of InSAR and time- series technique can facilitate the monitoring of dynamic processes on especially hazardous volcanoes.

The spatially dense measurements of surface deformation help constrain the causes of the observed deformation and the magma plumbing system.

Continuous monitoring of ground deformation at Sinabung and other volcanoes worldwide will help reduce volcanic hazards.

Acknowledgment

This research was funded by the Korean Society of Remote Sensing. This research was supported by Basic Science Research Program through the National Research Foundation of Korea (NRF) funded by the Ministry of Science, ICT & Future Planning (NRF- 2015M1A3A3A02013416) and the Korea Meteorological Administration Research and Development Program under Grant KMIPA (2015- 3071). The SAR data used in this study are copyrighted by the Alaska Satellite Facility and Japan Aerospace Exploration Agency.

References

Berardino, P, G. Fornaro, R. Lanari, and E. Sansoti, 2002. A new algorithm for surface deformation monitoring based on small baseline differential SAR interferograms, IEEE Transactions on Geoscience and Remote Sensing, 40(11): 2375- 2383.

Chaussard, E. and F. Amelung, 2010. Monitoring the

Korean Journal of Remote Sensing, Vol.33, No.1, 2017

(9)

ups and downs of Sumatra and Java with D- Insar time-series, American Geophysical Union. Fall Meeting 2010, abstract #G23C- 0838.

Chaussard, E., and F. Amelung, 2012. Precursory inflation of shallow magma reservoirs at west Sunda volcanoes detected by InSAR, Geophysical Research Letters, 39(21).

Ebmeier, S. K., J. Biggs, T. A. Mather, G. Wadge, and F. Amelung, 2010. Steady downslope movement on the western flank of Arenal volcano, Costa Rica, Geochemistry, Geophysics, Geosysttem, 11(12): Q12004.

Furuta, R., 2009. Case study of small scale surface deformation detection using ALOS PALSAR differential interferometry, Proc. Fringe 2009 workshop, Frascati Italy.

Global Volcanism Program, 2013. Volcanoes of the World, Smithsonian Institution, http://dx.doi.org/10.5479/si.GVP.VOTW4- 2013.

Jung, H.S., Z. Lu, and L. Zhang, 2013a. Feasibility of along-track displacement measurement from Sentinel-1 interferometric wide-swath mode.

IEEE Transactions on Geoscience and Remote Sensing, 51: 573-578.

Jung, H.S., D.T. Lee, Z. Lu, and J.S. Won, 2013b.

Ionospheric Correction in SAR Interferogram by Multiple-Aperture Interferometry, IEEE Transactions on Geoscience and Remote Sensing, 51(5): 3191-3199.

Kriswati, E., H. Kuncoro, and I. Meilano, 2014. Low Rate of Sinabung Deformation Inferred by GPS Measurement, Proc. of AIP Conference, 4th International Symposium on Earthquake and Disaster Mitigation 2014, 1658(1): 050007-1- 050007-8.

Lee, C.W., Z. Lu, O. Kwoun, and J. S. Won, 2008.

Deformation of Augustine volcano, Alaska, 1992-2005, measured by ERS and ENVISAT

SAR interferometry, Earth, planets and space, 60(5): 447-452.

Lee, C.W., Z. Lu, H.S. Jung, J.S. Won, and D. Dzurisin, 2011. Surface Deformation of Augustine Volcano (Alaska), 1992-2005, from Multiple- Interferogram Processing Using a Refined SBAS InSAR Approach, USGS Professional Papers, 1769, 453-465.

Lee, C.W., Z. Lu, and H.S. Jung, 2012. Simulation of time series surface deformation to validate multi-interferogram InSAR processing technique, International Journal of Remote Sensing, 33(22): 7075-7087.

Lu, Z., Masterlark, T., and Dzurisin, D., 2005.

Interferometric Synthetic Aperture Radar (InSAR) Study of Okmok Volcano, Alaska, 1992-2003: Magma Supply Dynamics and Post-emplacement Lava Flow Deformation, Journal of Geophysical Research: Solid Earth, 110: B02403.

Lu, Z., J.W. Kim, H. Lee, C.K. Shum, J. Duan, M.

Ibaraki, O. Akyilmaz, and C.H. Read, 2009.

Helmand River Hydrologic Studies Using ALOS PALSAR InSAR and ENVISAT Altimetry, Marine Geodesy, 32(3): 320-333.

Lu, Z., Dzurisin, D., Biggs, J., Wicks, C., Jr, and McNutt, S., 2010. Ground surface deformation patterns, magma supply, and magma storage at Okmok volcano, Alaska, from InSAR analysis:

1. Intereruption deformation, 1997-2008, Journal of Geophysical Research: Solid Earth, 115(B5): B00B02.

Lu, Z. and D. Dzurisin, 2014. InSAR Imaging of Aleutian Volcanoes, Springer, Berlin Heidelberg.

Massonnet, D. and K.L. Feigl, 1998. Radar interferometry and its application to changes in the Earth’s surface, Reviews of Geophysics, 36(4): 441-500.

Ng, A.H.M., H.C. Chang, L. Ge, C. Rizos, and M.

(10)

Omura, 2009. Assessment of radar interferometry performance for ground subsidence monitoring due to underground mining, Earth Planets Space, (61): 733-745.

Pan, G. and D. Tang, 2010. Damage information derived from multi-sensor data of the Wenchuan Earthquake of May 2008, International Journal of Remote Sensing, 31(13): 3509-3519.

Philibosian, B. and M. Simon, 2011. A survey of volcanic deformation on Java using ALOS PALSAR interferometric time series, Geochemistry, Geophysics, Geosystems, 12(11): 1-20.

Pritchard, M. E. and M. Simons, 2004. Surveying volcanic arcs with satellite radar interferometry:

The central Andes. Kamchatka, and beyond, GSA Today, 14(8): 4-11.

Poland, M., 2010. Localized surface disruptions observed by InSAR during strong earthquakes in Java and Hawaii, Bulletin of the Seismological Society of America, 100(2): 532- 540.

Rignot, E., 2008. Changes in West Antarctic ice stream dynamics observed with ALOS PALSAR data, Geophysical Research Letters, 35(12): L1205.

Wadge, G., G.S. Mattioli, and R.A. Herd, 2006. Ground deformation at Soufriére Hills Volcano, Montserrat during 1998-2000 measured by radar interferometry and GPS, Journal of Volcanology and Geothermal Research, 152(1): 157-173.

Korean Journal of Remote Sensing, Vol.33, No.1, 2017

수치

Fig. 1.  (a) Sinabung volcano, located in the northern region of the Island of Sumatra, Indonesia
Table 1. Characteristics of ALOS/PALSAR data used in this study
Fig. 3.  Thirty-nine high-coherence interferograms according to perpendicular baseline using 20 SAR images.
Fig. 5.  SBAS-estimated mean surface deformation rate map over high coherence areas (>0.4) exploiting the SAR dataset from 2/20/07 to 1/16/11
+2

참조

관련 문서

In this study, the kinetic model based on the coupled reaction model was used to investigate the compositions and amount changes among the molten steel, slag and inclusions

mould with rapid and uniform cooling characteristics using the deposition of the multi-materials based on the direct metal rapid tooling process.. In order

The purpose in this study is to investigate roadway and traffic characteristic data in the multi-lane freeway segments congested during the rush hours (06:30~07:30),

• Spatial coherence describes the correlation between waves at different points in space.. Temporal

The index is calculated with the latest 5-year auction data of 400 selected Classic, Modern, and Contemporary Chinese painting artists from major auction houses..

AHP based multi-criteria VHO algorithm decides priority of influencing factors and the decision criteria based on the location for different traffic types such

In the process, we explore machine learning approaches for robotic path planning, multi constrained optimal path computation and sensor based wearable assistive devices

-The square module stands free in the garden of the house as a canopy -consisted of a thin shell supported at each of its corners by equally thin reinforced concrete piers.