• 검색 결과가 없습니다.

Similarity Measure based on Utilization of Rating Distributions for Data Sparsity Problem in Collaborative Filtering

N/A
N/A
Protected

Academic year: 2021

Share "Similarity Measure based on Utilization of Rating Distributions for Data Sparsity Problem in Collaborative Filtering"

Copied!
8
0
0

로드 중.... (전체 텍스트 보기)

전체 글

(1)

JKSCI

Similarity Measure based on Utilization of Rating Distributions for Data Sparsity Problem in Collaborative Filtering

1)

Soojung Lee*

*Professor, Dept. of Computer Education, Gyeongin National University of Education, Anyang, Korea

[Abstract]

Memory-based collaborative filtering is one of the representative types of the recommender system, but it suffers from the inherent problem of data sparsity. Although many works have been devoted to solving this problem, there is still a request for more systematic approaches to the problem. This study exploits distribution of user ratings given to items for computing similarity. All user ratings are utilized in the proposed method, compared to previous ones which use ratings for only common items between users. Moreover, for similarity computation, it takes a global view of ratings for items by reflecting other users’ ratings for that item. Performance is evaluated through experiments and compared to that of other relevant methods. The results reveal that the proposed demonstrates superior performance in prediction and rank accuracies. This improvement in prediction accuracy is as high as 2.6 times more than that achieved by the state-of-the-art method over the traditional similarity measures.

▸Key words: Collaborative Filtering, Recommender System, Similarity Measure, Data Sparsity

[요 약]

메모리 기반의 협력 필터링은 추천 시스템의 대표적인 타입이지만 데이터 희소성이라는 본질적 인 문제를 갖고 있다 . 이 문제를 해결하기 위해 많은 연구 업적들이 이루어졌으나, 보다 체계적인 접근 방법은 여전히 요구된다. 본 연구는 사용자 간의 유사도를 산출하기 위하여 항목들에 대한 사용자 평가치 분포를 활용한다 . 따라서 제안 방법은 사용자의 모든 평가치를 이용하므로, 공통 항목에 대한 평가치만을 이용하는 기존 방법들과 대비된다 . 더욱이, 각 항목에 대한 다른 사용자 들의 평가치들을 유사도 계산에 반영함으로써 항목 평가치의 광역적인 관점을 취한다. 제안 방법 의 성능은 실험을 통하여 평가하였고 , 연관된 다른 방법들과 비교하였다. 그 결과, 제안 방법은 예측과 순위 정확도 측면에서 우수한 성능을 보였다 . 이러한 예측 정확도의 향상은 전통적인 유 사도 척도에 비해 최근의 방법으로 달성한 것보다 최고 2.6배 더 높다.

▸주제어: 협력 필터링, 추천 시스템, 유사도 척도, 데이터 희소성

∙First Author: Soojung Lee, Corresponding Author: Soojung Lee

*Soojung Lee ([email protected]), Dept. of Computer Education, Gyeongin National University of Education

∙Received: 2020. 10. 26, Revised: 2020. 12. 10, Accepted: 2020. 12. 10.

Copyright ⓒ 2020 The Korea Society of Computer and Information http://www.ksci.re.kr pISSN:1598-849X | eISSN:2383-9945

(2)

I. Introduction

Recommender systems have become essential in e-commerce areas these days. They assist customers to acquire useful information efficiently in time. Several types of recommender systems have been developed in literature[1]. Representative ones include content-based, collaborative, and hybrid filtering, but later demographic filtering, social network-based, knowledge-based, and trust-based filtering also draw attention of many researchers. In [2], the authors discuss five main hotspots, issues, and solutions of current recommendation system research.

Content-based filtering analyzes the user or item profiles to extract features that people might like for recommendation. Accordingly, it has shortcomings of reliance on the amount of profiles which is usually hard to obtain in reality. On the contrary, collaborative filtering (CF) is based on users’ interactions with the system such as explicit and implicit feedbacks. These feedbacks data are readily available in most current systems, thus giving more advantages to CF [1][2].

The principle of CF systems is that they analyze user feedbacks on items, find other users with similar responses, and recommend those items which other similar users called the nearest neighbors show preferences for. This methodology obviously creates two main issues: feedback data sparsity and scalability problems. These issues are related to the reliability and complexity of similarity measures [1][3].

Various similarity measures have been developed in literature. Major traditional measures include Pearson correlation, the cosine similarity, and the mean squared differences, while variants of those such as constrained Pearson correlation, Spearman rank, and the adjusted cosine are also designed [3].

All of these, however, heavily rely on the number of items co-rated by two users for computing similarity between the two users. Hence, if the user feedback data, mainly implemented as user ratings,

are sparse, the resulting similarity can not be reliable, thus producing poor recommendation.

Another issue of the scalability problem occurs due to the enormous number of users in the system which requires extensive time for similarity computation. As the number of users are usually much more than the number of items in most recommender systems, the scalability problem can be reduced by having similarity between items rather than between users and recommending items similar to those which the current user prefers in the past. This is called item-based CF systems [1][3].

This paper focuses on CF systems and addresses the data sparsity problem. Instead of utilizing the user ratings for only common items as in previous measures, the proposed method considers the distribution of ratings in computing similarity between users. Thus, all of the user ratings are taken into account. Moreover, it reflects the other users’ ratings for each item onto similarity computation to have a global view of ratings with respect to the item. The proposed method is experimented for performance evaluation to demonstrate superior results especially in prediction accuracy.

The remaining of the paper is organized as follows: Section 2 describes existing CF strategies for the data sparsity problem. The proposed method is presented in Section 3, followed by experimental results in Section 4. Section 5 concludes this paper.

II. Related Works

The approaches to the data sparsity problem in

CF systems for similarity computation can be

categorized into Jaccard index-based and rating

distribution-based. Jaccard index [4] is

representative, belonging to the first category. It is

defined as the ratio of the co-rated items among all

the items rated by the two users. This index is

(3)

usually incorporated into previous similarity measures to define a new measure. The work in [5]

incorporated Jaccard into the mean squared differences and reported to have better recommendation results. Sun et al. integrated Triangle [6] and Jaccard similarities to successfully improve the prediction errors [7]. Mu et al.

proposed an improved Common Pearson Correlation Coefficient measure and further combined it with global similarity Hellinger Distance [8] and Jaccard similarity [9]. In [10], Jaccard similarity is improved and integrated into the mean squared differences. They emphasized their proposed relevant Jaccard similarity performed more accurately and effectively than other traditional ones.

The rating distribution-based approaches utilize probability density distribution of ratings to calculate similarity. The benefit of this approach is that it uses all rating data as opposed to Jaccard index-based ones. In [11], Bhattacharyya coefficient (BC) is used to introduce a new similarity measure.

Kullback–Leibler(KL)-divergence is another distribution-based index measuring differences between two sequences. The difference between BC and KL-divergence is described in the study of [12].

Also, this study designed an item similarity measure based on the KL-divergence, which is used as a weight to correct the output of an adjusted Proximity–Significance–Singularity model [13]. Deng et al. also presented an item similarity measure based on the KL-divergence which identifies the relation between items based on the probability density distribution of ratings [14]. BC is further utilized in [12] such that it is incorporated into an existing nonlinear similarity computation model to recommend items with higher prediction accuracy. Meanwhile, Wang et al. proposed a more generalized concept of divergence named α -divergence for developing a new item similarity measure to address the sparsity problem and reduce the dependence on co-rated cases [15].

III. Proposed Methodology

1. Basic Idea

In order to take care of the issue of ratings data sparsity and obtain reliable similarities, we make use of the distribution of user ratings for similarity computation. The advantage of our strategy is:

First, it no more relies on common item ratings as in conventional similarity measures; Second, it utilizes all ratings provided by a user.

Assume that three users u, v, and w give a rating 4, 5, and 2 to an item x, respectively. Then it can be said that users u and v are more generous in giving ratings than user w, thus regarded more similar to each other, when confined to this item.

We utilize this point of rating behavior in our method. That is, the degree of generosity of users is reflected on the similarity formula.

2. Formulation of the Algorithm

Users have different opinions on movies and movies may have different range of ratings accordingly. There are some movies for which most users show high preference, thus producing small variations between user ratings, while the opposite cases also occur. Thus, each user rating for an item should be translated with respect to all the ratings given to the same item. Therefore, we make use of normalized user ratings and their distribution for each user. The detailed procedure follows.

1. Calculate the average (m x ) and standard deviation (σ x ) of the ratings given to each item x.

2. For a rating of user u for item x (r u,x ), convert it into z value (z u,x ) using

     

    

... (1) 3. Obtain the rating distribution of user u. That

is, let N u,z be the number of z rating values of user u and N u the total number of ratings of user u. Then the probability of normalized rating value z by user u is given as

     

 

...(2)

(4)

Once the distribution is obtained as above, we compute similarity between users based on their distributions. KL divergence is one of the well-known metrics that measures difference between two sequences from the perspective of probability distributions [16]. We use this metric for computing similarity. Specifically, we first adjust p u,z to make this value non-zero as suggested by [16] as follows.

          

    

      ...(3) where Z is the number of all possible z values. We use z values to include one decimal point and compute KL divergence between two users u and v as below, where ±4 are taken as a maximum and minimum possible values of z.

     

   

       log     

    

...(4) KL divergence is asymmetric as seen in the formula above. Hence, in order to have similarity symmetric, we finally compute similarity between the two users as follows.

              

 ...(5)

3. Example

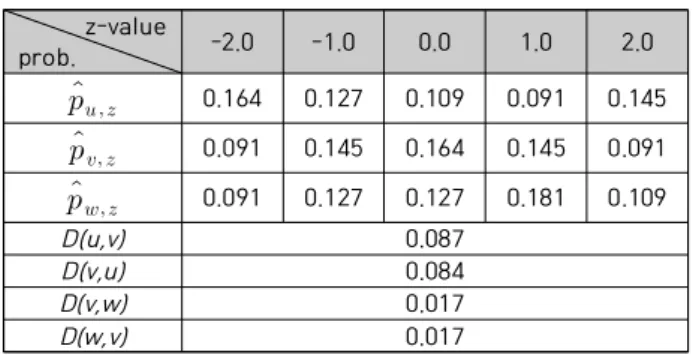
In this section, we give an illustration of the proposed similarity computation. Let us use an integer value of z within the range from –2 to 2 for simplicity. Assume that z distributions of three users u, v, and w are as presented in Table 1. The non-zero z values and KL-divergences can be computed as in Table 2 using Eq. (3) and (4). From this, similarity between two users is computed as

sim(u, v) = 1/(1+(0.087+0.084)/2) = 0.9212 sim(v, w) = 1/(1+(0.017+0.017)/2) = 0.9837

z-value

prob. -2.0 -1.0 0.0 1.0 2.0

   0.4 0.2 0.1 0 0.3

  0 0.3 0.4 0.3 0

  0 0.2 0.2 0.5 0.1

Table 1. z distributions of user ratings

z-value

prob. -2.0 -1.0 0.0 1.0 2.0

     0.164 0.127 0.109 0.091 0.145

    0.091 0.145 0.164 0.145 0.091

    0.091 0.127 0.127 0.181 0.109

D(u,v)

0.087

D(v,u)

0.084

D(v,w)

0.017

D(w,v)

0.017

Table 2. Non-zero z distributions of user ratings

IV. Performance Experiments

1. Experiments Design 1.1 Dataset

For experimentation, we adopt the well-known dataset in the related field used for research purpose, MovieLens 1M. This dataset contains 1M number of ratings made by 6,040 users on 3,952 movie items. The users provide integer rating values from one to five, where the higher rating means the most satisfaction.

We reduced the original set to a small one in order to test the proposed methodology for a sparser set. Table 3 lists up the details of the dataset used by our experiments. Only those users who rated not more than 40 items are included.

Thus, the sparsity level, defined by one minus the ratio of total number of ratings over the user-rating matrix size, turns out 0.99268 from 0.9581 of the original dataset, proving our set much sparser than the original one. We used 80%

of the reduced data for training, i.e., for obtaining nearest neighbors, and the rest for testing.

Feature Value

Number of users 1351

Number of items 3952

Number of ratings per user ≤40

Total number of ratings 39,106

Sparsity level 0.99268

Table 3. Dataset Description

1.2 Performance Metrics

Performance evaluation is made in terms of

various metrics widely used in literature. First,

(5)

prediction of un-rated items is evaluated through accuracy called MAE (Mean Absolute Error), which measures the degree of closeness between the predicted rating and the real rating of a user.

Thus, the lower MAE means the better prediction made by the system. Its formula is given as follows.

   

      ...(6) where N is the total number of predictions, p i the predicted rating, and r i the actual rating of the user.

Another popular metric used for estimating prediction accuracy focuses on giving bigger disadvantage to larger difference from the actual ratings, than MAE. This metric is named RMSE (Root Mean Squared Error) and used in the Netflix Prize. Its definition follows.

R M SE   N i   N

p i  r i  ...(7) It is also interesting to see how many of the items unrated by the active user can be predicted by his nearest neighbors. This proportion is referred to as coverage [1], which is investigated in our experiments.

Finally, we adopt DCG (Discounted Cumulative Gain) as a metric for rank accuracy [1]. It indicates how good is the recommendation list provided by the system in terms of relevance. In other words, if the list is ordered as the most relevant items at the top and the less relevant items at the bottom, the system can be said to yield high DCG. This metric is formulated as

  

  

 log   

   

...(8)

where p is the size of the recommendation list and rel i is the relevance value of the item with rank i. It is more common to use the normalized DCG (nDCG) instead of DCG, to reflect different length of the recommendation list. nDCG is computed as normalization based on the ideal order of the items in the list. Hence, when iDCG denotes the ideal DCG, nDCG is defined as

     ...(9)

1.3 Similarity Measures for Evaluation

In order to estimate performance of the proposed method, it is better to consider how much improvement is made compared to the traditional similarity measures. Hence, we include three representative conventional measures, namely, Pearson correlation (COR), the cosine similarity (COS), and the mean squared differences (MSD).

We also experimented some of the measures in literature, developed mainly to address the rating sparsity, Jaccard (JAC) [4] and JMSD [5]. These methods are referenced very often as baselines for performance experiments in literature. The details of these measures are explained in Section 2.

2. Results

2.1 Traditional Similarity Measures

We first compare prediction accuracy of COR, COS and MSD. Fig. 1 shows the results with varying number of nearest neighbors. A significant difference is observed between COR and the others in terms of both metrics. This implies that COR behaves very poor in a sparse data environment, while its performance is reported to be good in a normal data set [1][3]. Moreover, as seen in the figure, COR performance degrades relatively more than the others in terms of RMSE. For this reason and for closer observation between the experimented measures, we include only COS and MSD in our further experiments.

2.2 Prediction Accuracy

Fig. 2 presents the accuracy of predicted ratings using the similarity measures under experimentation. It shows a very clear difference among the measures. That is, the traditional measures, COS and MSD, turn out to have the lowest performance among all. On the other hand, JMSD achieves notable improvement over MSD.

This is because JMSD combines MSD with Jaccard

(6)

Fig. 2. Performance comparison of MAE and RMSE among the similarity measures

Fig. 1. MAE and RMSE using Pearson correlation, the cosine similarity, and the mean squared differences

index which proves to play a significant role in the sparse data condition. In fact, JAC performs much better than all the measures mentioned so far. This result is quite surprising, considering that JAC only reflects the number of co-rated items instead of their absolute numeric ratings onto similarity between users.

It is observed that the proposed method yields significantly best performance in both MAE and RMSE results. Moreover, the gap in RMSE between JAC and PROP is larger than that in MAE results, as more number of nearest neighbors are referenced.

This indicates that the proposed gives less deviation from the actual ratings compared to the other measures.

2.3 Coverage

Fig. 3 shows the coverage results of the measures. As in the results of prediction accuracy, COS and MSD yield the worst coverage. This implies that the neighbors chosen based on the ratings of co-rated items are not proper, as there should be very few common items in the sparse data environment. It turns out that COS is more vulnerable to such condition.

JAC and JMSD achieve very competitive results and the best among all the measures, followed by PROP. The reason seems that PROP neglects the number of co-rated items but only considers the rating distribution for computing similarity.

Therefore, it is discovered that the number of

(7)

Fig. 3. Performance comparison of coverage and nDCG among the similarity measures

common items should be one of the criteria for selecting neighbors when attempting to improve coverage.

2.4 nDCG

Fig. 3 also shows the rank accuracy of the measures in terms of nDCG. Since the number of ratings per user is not more than 40 in our data set and the testing set occupies only 20%, the size of recommendation list is not that large, only seven in this experiment.

Very little differences among the measures are observed, where PROP still exhibits a bit higher accuracy. This is largely due to that PROP gives the highest prediction accuracy as shown in Fig. 1.

That is, it successfully places high ranks to those items most preferred by the users.

V. Conclusions

This paper proposed a new similarity measure for collaborative filtering-based recommender systems. The proposed measure is designed to relieve the problem of data sparsity inherent in the system. Instead of relying on the number of common items between users as in previous methods, it utilizes all the ratings of a user and takes the rating distribution of each user into

account for computing similarity between users.

Furthermore, it reflects the other users’ ratings for an item onto similarity computation in order to have a global view of ratings for that item. It is found through experiments that the proposed method demonstrates superior performance in prediction and rank accuracies. As a future research, it may be valuable to focus on conducting experiments under different data environments and comparing performance with other related methods in terms of various metrics.

REFERENCES

[1] M. Jalili, S. Ahmadian, M. Izadi, P. Moradi, and M. Salehi,

“Evaluating Collaborative Filtering Recommender Algorithms: A Survey,” IEEE Access, Vol. 6, pp. 74003-74024, 2018. DOI:

10.1109/ACCESS.2018.2883742

[2] B. Shao, X. Li, and G. Bian, “A survey of research hotspots and frontier trends of recommendation systems from the perspective of knowledge graph,” Expert Systems with Applications, Vol. 165, 2021. DOI: 10.1016/j.eswa.2020.113764

[3] M. Aamir and M. Bhusry, “Recommendation System: State of the Art Approach,” International Journal Computer Applications, Vol. 120, No. 12, pp. 25–32, 2015. DOI: 10.5120/21281-4200 [4] S. Kosub, “A note on the triangle inequality for the Jaccard distance,” Pattern Recognition Letters, Vol. 120, pp. 36-38, 2019.

DOI: 10.1016/j.patrec.2018.12.007

[5] J. Bobadilla, F. Serradilla, and J. Bernal, “A new collaborative

filtering metric that improves the behavior of recommender

(8)

systems,” Knowledge-Based Systems, Vol. 23, No. 6, pp. 520-528, 2010. DOI: 10.1016/j.knosys.2010.03.009

[6] A. Iftikhar, M. A. Ghazanfar, M. Ayub, Z. Mehmood, and M.

Maqsood, “An Improved Product Recommendation Method for Collaborative Filtering,” IEEE Access, Vol. 8, pp. 123841-123857, 2020. DOI: 10.1109/ACCESS.2020.3005953

[7] S.-B. Sun, Z.-H. Zhang, X.-L. Dong, H.-R. Zhang, T.-J. Li, L.

Zhang, and F. Min, “Integrating triangle and Jaccard similarities for recommendation,” PLoS ONE, Vol. 12, No. 8, 2017. DOI:

10.1371/journal.pone.0183570

[8] J. Guo, J. Deng, X. Ran, Y. Wang, and H. Jin, “An efficient and accurate recommendation strategy using degree classification criteria for item-based collaborative filtering,” Expert Systems with Applications, Vol. 164, 2021. DOI: 10.1016/j.eswa.2020.113756 [9] Y. Mu, N. Xiao, R. Tang, L. Luo, and X. Yin, “An efficient similarity measure for collaborative filtering,” Procedia Computer Science, Vol. 147, pp. 416–421, 2019. DOI: 10.1016/j.procs.201 9.01.258

[10] S. Bag, S.K. Kumar, and M.K. Tiwari, “An efficient recommendation generation using relevant Jaccard similarity,”

Information Sciences, Vol. 483, pp. 53-64, 2019. DOI:

10.1016/j.ins.2019.01.023

[11] B. K. Patra, R. Launonen, V. Ollikainen, and S. Nandi. “A new similarity measure using Bhattacharyya coefficient for collaborative filtering in sparse data,” Knowledge-Based Systems, Vol. 82, pp. 163–177, 2015. DOI: 10.1016/j.knosys.2015.03.001 [12] A. Jain, P. K. Singh, and J. Dhar, “Multi-objective item evaluation

for diverse as well as novel item recommendations,” Expert Systems with Applications, Vol. 139, 2020. DOI: 10.1016/j.esw a.2019.112857

[13] H. Liu, Z. Hu, A. Mian, H. Tian, and X. Zhu, “A new user similarity model to improve the accuracy of collaborative filtering,” Knowledge Based Systems, Vol. 56, pp. 156–166, 2014. DOI: 10.1016/j.knosys.2013.11.006

[14] J. Deng, Y. Wang, J. Guo, Y. Deng, J. Gao, and Y. Park, “A similarity measure based on Kullback–Leibler divergence for collaborative filtering in sparse data,” Journal of Information Science, Vol. 45, No. 5, pp. 656-675, 2018. DOI: 10.1177/016 5551518808188

[15] Y. Wang, P. Wang, Z. Liu, and Leo Zhang, “A new item similarity based on α-divergence for collaborative filtering in sparse data,”

Expert Systems with Applications, Vol. 166, 2021. DOI:

10.1016/j.eswa.2020.114074

[16] Y. Wang, J. Deng, J. Gao, and P. Zhang, “A hybrid user similarity model for collaborative filtering, Information Sciences,” Vol.

418-419, pp. 102-118, 2017. DOI: 10.1016/j.ins.2017.08.008

Authors

Soojung Lee received the B.S. degree in Mathematics Education from Ewha University, Korea in 1985. She received M.S. and Ph.D.

degrees in Computer Science from Texas A&M University, U.S.A, in 1990 and 1994,

respectively. Dr. Lee joined the faculty of the Department of

Computer Education at Gyeongin National University of

Education, Gyunggi-do, Korea, in 1998, as a professor. She

is interested in recommender systems, information filtering,

data mining techniques, and computer education.

수치

Table  1.  z  distributions  of  user  ratings
Fig.  2.  Performance  comparison  of  MAE  and  RMSE  among  the  similarity  measures
Fig.  3.  Performance  comparison  of  coverage  and  nDCG  among  the  similarity  measures

참조

관련 문서