Construction of Ovine Customer cDNA Chip and Analysis of Gene Expression Patterns in the Muscle and Fat Tissues of Native Korean Cattle
Kyung Ho Han1, Eun Young Choi2, Yeon-Hee Hong3, Jae Yeong Kim3, In Soon Choi2, Sang-Suk Lee4, Yun Jaie Choi5 and Kwang Keun Cho3*
1Department of Cell and Molecular Biology, Scripps Research Institute, La Jolla, CA 92037, USA
2Department of Biological Science, Silla University, Busan 617-736, Korea
3Department of Animal Resources Technology, Gyeongnam National University of Science and Technology, Chinju 660-758, Korea
4Department of Animal Science and Technology, Sunchon National University, Suncheon 540-742, Korea
5School of Agricultural Biotechnology, Seoul National University, San 56-1, Shillim-dong, Kwanak-Gu, Seoul 151-742, Korea Received January 15, 2015 /Revised March 31, 2015 /Accepted April 13, 2015
To investigate the molecular events of controlling intramuscular fat (or marbling), which is an im- portant factor in the evaluation of beef quality, we performed cDNA microarray analyses using the longissimus dorsi muscle and back fat tissues. For this study, we constructed normalized cDNA li- braries: fat tissues in native Korean cattle (displaying 1,211 specific genes), and muscle tissues in na- tive Korean cattle (displaying 1,346 specific genes). A bovine cDNA chip was constructed with 1,680 specific genes, consisting of 760 genes from muscle tissues and 920 genes from fat tissues. The micro- array analysis in this experiment showed a number of differentially expressed genes, which compared the longissimus dorsi muscle (Cy5) with back fat tissue (Cy3). Among many specific differentially ex- pressed genes, 12-lipoxygenase (oxidizing esterified fatty acids) and prostaglandin D synthase (differentiation of fibroblasts to adipocytes) are the key candidate enzymes that should be involved in controlling the accumulation of intramuscular fat. In this study, differentially and commonly ex- pressed genes in the muscle and fat tissues of native Korean cattle were found in large numbers, us- ing the hybridization assay. The expression levels of the selected genes were confirmed by semi-quan- titative RT-PCR, and the results were similar to those of the cDNA microarray.
Key words : Back fat tissue, cDNA microarray, longissimus dorsi muscle, native Korean cattle, rump tissue
*Corresponding author
*Tel : +82-55-751-3286, Fax : +82-55-751-3689
*E-mail : [email protected]
This is an Open-Access article distributed under the terms of the Creative Commons Attribution Non-Commercial License (http://creativecommons.org/licenses/by-nc/3.0) which permits unrestricted non-commercial use, distribution, and reproduction in any medium, provided the original work is properly cited.
Journal of Life Science 2015 Vol. 25. No. 4. 376~384 DOI : http://dx.doi.org/10.5352/JLS.2015.25.4.376
Introduction
Intramuscular fat (or marbling) is an important factor for the evaluation of beef quality, and therefore is often re- garded as a direct economic index. Marbling not only assists in preventing moisture loss during cooking, but also stim- ulates flavor and juiciness during eating. Research studies conducted on consumers' taste preferences have consistently shown that marbling has a strong influence on the enjoy- ment of beef through its effects on flavor, juiciness, and tenderness. As such, improving the marbling score of beef is a top priority for the livestock industry and producers
who wish to compete with imported beef and other types of meats. One of the few choices for achieving such a goal is doing research on molecular mechanisms and the signal- ing pathways involved in fat and muscle synthesis. Not only is the molecular mechanism of intramuscular fat tissue not well understood, but the genomes of livestock have not been as well studied as those of humans or mice. Our tissue-spe- cific libraries will facilitate bovine functional genomics and proteomics. Microarray-based studies have uncovered broad patterns of genetic activity, providing new understanding of gene functions; they have sometimes generated un- expected, (but valuable) insights into transcriptional proc- esses and biological mechanisms. Identifying key genes that regulate differential expression in muscle and fat tissues of native Korean cattle can be greatly facilitated with the use of microarray. In particular, an awareness of the dynamics of where, when, and how much a given gene is expressed is often vital to understanding its biological function. For this reason we designed a study that would allow us to see differential gene expression in longissimus dorsi muscle
(sirloin, intramuscular fat randomly distributed in muscle) compared to back fat tissue (mostly consisting of fat tissue) using cDNA microarray.
Materials and methods
Preparation of samples
Native Korean steers (n=26) were slaughtered at different time points. The steers were slaughtered in accordance with standard Korean industry-practice guidelines for the ethical treatment of animals. The carcasses, with weights ranging from 550 to 600 kg, were dressed in a commercial slaughter- house. Longissimus dorsi muscles and back fat tissues were obtained from the eighth through the thirteenth thoracic rib sections. The samples were quickly frozen in liquid nitrogen (-196°C) soon after being processed.
Total RNA and mRNA isolation
Total RNA isolation was carried out with TRIzolTM re- agent (Gibco BRL, USA) according to modified manu- facturer’s instruction. mRNA isolation from total RNA was performed by using PolyATtractR mRNA isolation systems (Promega, Madison, WI, USA).
cDNA library construction
cDNA libraries of bovine muscle and fat tissue were con- structed using a SuperScript plasmid system for cDNA syn- thesis and plasmid cloning (Gibco BRL, USA). Each library was synthesized in pSPORT 1 vector using Not I and Sal I adapters. Transformation with ligated cDNA into E. coli Top 10F´ was carried out.
Screening of bovine clones
White colonies on LB / X-Gal (20mg/ml stock; 40 μl/
plate) and IPTG (0.5 M stock; 8 μl /plate) plate were trans- ferred onto other LB agar plates using tooth-picks, and in- cubated overnight at 37°C.
To remove cDNA clones smaller than 300 bp in each li- brary, a PCR master mix for each 20 μl reaction was pre- pared for direct PCR with the following reagents: 2 μl of 10× PCR reaction buffer, 2 μl of MgCl2 (25 mM), 0.5 μl of dNTP mix (10 mM), 0.5 μl of forward PCR primer (10 μM), 0.5 μl of reverse PCR primer (10 μM), 0.2 μl of Taq polymer- ase mix (Promega, Madison, WI, USA), and 14.3 μl of sterile H2O. Twenty microliters of the master mixture was ali- quoted into each reaction tube. After picking up the white
colony, they were streaked on the master plate and dipped in each reaction tube. PCR was immediately incubated at 94°C for 2 min and subjected to 27 cycles of denaturation at 94°C for 30 sec, annealing at 60°C for 30 sec, and extension at 72°C for 1.5 min (Bio-Rad, Hercules, USA). The PCR prod- ucts (10 μl) were electrophoresed from each reaction on a 0.8% agarose gel prepared in 1× TAE buffer and stained with 5 μl /ml ethidium bromide (EtBr).
Plasmid preparation was carried out by Wizard plus SV Minipreps DNA Purification System (Promega, Madison, WI, USA).
Sequencing of selected clones
DNA was sequenced by using ABI 377 automatic se- quencer (Applied Biosystems, USA) or on multi-capillary electrophoresis using ABI 3700 automatic sequencer (Applied Biosystems, USA). Sequencing results were searched with other sequences on the Genbank by using the Advanced BLAST search program (http://www.ncbi.nlm.nih.gov/
BLAST/).
cDNA microarray PCR amplification
A PCR master mix for each 100 μl reaction was prepared with the following reagents: 10 μl of 10× PCR reaction buffer (Clontech, Mountain View, CA, USA), 8 μl of dNTP mix (2.5 mM), 0.4 μl of M13 forward PCR primer (100 pM), 0.4 μl of M 13 reverse PCR primer (100 pM), 10 μl of MgCl2 (25 mM), 1 μl of Taq polymerase (Clontech, Mountain View, CA, USA), 1 μl of template DNA (0.2 μg/μl), and 69.2 μl of sterile H2O. 100 μl of master mix was aliquoted into each reaction well of 96-well plates. PCR was immediately incubated at 94°C for 2 min and subjected 27 cycles of denaturation at 94°C for 30 sec, annealing at 60°C for 30 sec, and extension at 72°C for 1.5 min (MWG Biotech, USA). The PCR products (100 μl) were electrophoresed on a 1 % agarose gel prepared in 1× TAE buffer, and the gel was stained with 0.5 mg/ml EtBr. Subsequently, PCR products were purified as follows:
transfer PCR reactions to the 96-well U-bottom tissue culture plates; add 1/10 volume of 3M sodium acetate (pH 5.2) and same volumes of isopropanol; then store PCR product at -70°C for 1 hr; centrifuge at 3,000 rpm for 1 hr; add 100 μl of ice-cold 70% ethanol and centrifuge again for 1 hr; dry the pellets for 10 min at room temperature; resuspend DNA in 10 μl of 3× SSC; transfer 10 μl aliquots to 384-well plates.
Microarrays were printed on poly-lysine treated slides
(Sigma, USA) using a PixSys 5500 arrayer (Cartesian Tech- nologies, USA). To reduce non-specific binding of strongly negatively charged target on microarray slides, the pos- itively charged amine groups on poly-L-lysine coated slides were passivated by reaction with succinic anhydride.
Direct labeling and hybridization
Sample total RNA was labeled by incorporation of either Cy3-dCTP or Cy5-d CTP during a reverse transcription. We prepared the samples as follows: heat probe at 65°C for 10 min and cool on ice; add 10 μl of reaction mixture to Cy3 and Cy5 reactions prepared with the following reagents: 13.4 μl of total RNA (40 μg/13.4 μl), 2 μl of Oligo-dT (18 mer) (2 μg/2 μl), 6 μl of 5× first-strand buffer, 3 μl of 0.1M DTT, 0.6 μl of unlabeled dNTPs, 3 μl of Cy3 or Cy5 (1 mM, Amersham), and 2 μl of superscript II (200 U/μl). Incubate at 42°C for 2 hr; degrade RNA by adding 1 μl of 1.5 M NaOH and 1.2 μl of 25 mM EDTA, and incubate at 65°C for 10 min. Neutralize by the addition of 1 μl of 1 M HCl, and bring the volume to 500 μl with TE buffer (pH 8.0); spin in Microcon-30 for 8 min at 14,000 rpm. Hybridize the micro- arrays with different total RNA probes (longissimus dorsi muscle: Cy5; back fat tissue: Cy3); mix each sample (Cy3 and Cy5) (12 μl); add 2.5 μl of 20× SSC and 0.6 μl of 10%
SDS. Denature the probe by heating for 2 min at 100°C. hy- bridize on spotted slide (15 μl) and cover with cover slide;
hybridize at 62°C for 8 hr in a slide chamber with humidity maintained by a small reservoir of 3× SSC (spot around 3 μl 3× SSC at each corner of the slide, as far away from the array as possible). Ready the washing solution: 1.5 l volume (2× SSC [wash I] with 0.2% SDS [add this to the wash first]), followed by 1.5 l volume 0.05× SSC (wash II: prepare two of these chambers). Place arrays, singly, in a rack, inside the wash I chamber (maximum four arrays at a time). Agitate for 15 sec; wash arrays by submersion and agitation for 5 min. Wash arrays in wash II chamber for 1 min; spin dry by centrifugation in a slide rack at 500 rpm for 2 min. Scan arrays immediately (Axon Instruments, Foster City, CA, USA).
Microarray scanning & Image analysis and normalization Microarrays were scanned using a confocal laser scanner GenePix 4000B Array Scanner (Axon Instruments, Foster City, CA, USA) containing a 532 nm (20 mW) laser for Cy3 measurement and 635 nm (15 mW) laser for Cy5 measure- ment.
The global normalization procedure consisted of two steps. First, a signal intensity threshold was set. Second, we
also eliminated spots where the difference between the Cy5/Cy3 ratios of duplicate spots was higher than half their mean value.
Cloning for transcriptional factors of adipogenesis RT-PCR
After assessing the quality of the RNA template by gel electrophoresis, cDNA synthesis was performed by using MMLV reverse transcriptase (Promega, Madison, WI, USA).
PCR master mix for each 20 μl reaction was prepared as follows; 2 μl 10× PCR buffer (with 15 mM MgCl2), 1 μl for- ward primer, 1 μl reverse primer, 0.2 μl Ex Taq DNA poly- merase (Takara, Japan), ddH2O to 17 μl, and 3 μl of cDNA first strand products. The samples were cycled according to the following profile, which had been optimized for thermal cyclers with heated lids (Bio-Rad, Hercules, CA, USA). PCR was incubated at 94°C for 2 min and subjected 40 cycles of denaturation at 95°C for 30 sec, annealing at 48°C for 30 sec, and extension at 72°C for 1.5 min (Bio-Rad, Hercules, CA, USA). The PCR products (20 μl) were electrophoresed from each reaction on 1% agarose gel prepared in 1× TAE buffer and stained with 5 μg /ml EtBr.
TA cloning
Each partial length of C/EBP α, C/EBP β, C/EBP δ, PPAR γ1, and SREBP-1C/ADD cDNA was electrophoresed on 1.0%
agarose gel. The specific DNA bands were eluted and puri- fied from the gel by using the agarose gel extraction kit (Bio101, Canada). Taq A-tailed eluted cDNA was ligated into a pGEM-T easy vector exhibiting a 3’ T-overhang on each strand (Promega, Madison, WI, USA) that possessed a lacZ gene for blue/clear color selection. The ligation was medi- ated by T4 DNA ligase (MBI Fermentas, Amherst, NY, USA), and the ligation was continued overnight at 16°C. The li- gated product was transformed into E-coli Top10F´ and clones were selected. Each sequence of adipogenic genes were verified by sequencing analysis and confirmed by BLAST search.
Results
Total RNA isolation
Total RNA from the Longissimus dorsi muscles and back fat tissues were extracted by TRIzolTM reagent. 5 μg of total RNA per each sample was electrophoresed on 1.2% form- aldehyde agarose gel under denaturing condition.
A
B
Fig. 1. Composition of cDNA clones from bovine fat and muscle tissue.
Bovine muscle and fat tissue cDNA library con- struction
cDNA libraries were constructed in pSPORT 1 vector us- ing synthesized double strand cDNA from longissimus dorsi muscles and back fat. The number of primary cDNA trans- formants was 4×10⁵ pfu/ml; this indicated that expressed clones were abundant regardless of their identities.
Screening of bovine clones
Recombinant vector was transformed into electro-com- petent E-coli TOP10F´ cells by electroporator. We performed direct PCR to check the size of the insert from each clone.
10 μl of PCR product was electrophoresed on a 0.8% agarose gel containing 5 μg /ml of EtBr. cDNA clones (which were not available for the cDNA microarray experiment) were re- moved, and sizes larger than 300 bp were selected for further experimentation.
With the selected clones, we carried out plasmid prepara- tion with 1,680 clones for bovine fat tissue and 1,500 clones for bovine muscle tissue. We performed PCR to confirm the purity of plasmids with randomly selected clones. 10 ng of each selected PCR product was electrophoresed on a 0.8%
agarose gel prepared containing 5 μg/ml of EtBr.
Construction of bovine cDNA microarray
1,680 selected clones from bovine fat tissue and 1,500 clones from bovine muscle tissue were partially sequenced with ABI 377 or ABI 3700 automatic sequencers. Through homology searches of sequencing results in the Advanced BLAST search program, we have constructed cDNA library of native Korean cattle containing 1,211 genes from fat tissue and 1,346 genes from muscle tissue. Fig. 1-A shows the com- position of cDNA clones from fat tissues. Among the 1,211 cDNA clones, 161 bovine genes (13.3%), 347 human ortholog
genes (28.6%), 142 ortholog genes from other species (12.2%), 211 EST (18%) and 40 novel genes (3%) were classified based on BLAST search. It is worth noting that the 40 novel genes were obtained from fat tissues; further investigation is need- ed to obtain novel genes from muscle tissue. As shown in Fig. 1-B, 1,346 cDNA clones were obtained from bovine mus- cle tissues. Based on sequencing analysis and BLAST search, 108 bovine genes (14%), 368 human ortholog genes (48%), 103 ortholog genes from other species (14%), 134 EST (18%), and 42 novel genes (6%) were identified. There are 42 novel genes that are waiting to be studied further. Several re- dundant genes (295/1,211 and 582/1,346) were found in the fat and muscle tissues, respectively.
Cloning for transcriptional factors of adipogenesis Five genes of potential interest on function and differ- entiation in adipogenesis were identified. Partial cDNAs of C/EBP α, C/EBP β, C/EBP δ, PPAR γ1, and SREBP-1C/
ADD were cloned through PCR amplification and TA cloning. Each clone was confirmed using sequencing analy- sis and BLAST search.
cDNA microarray analysis
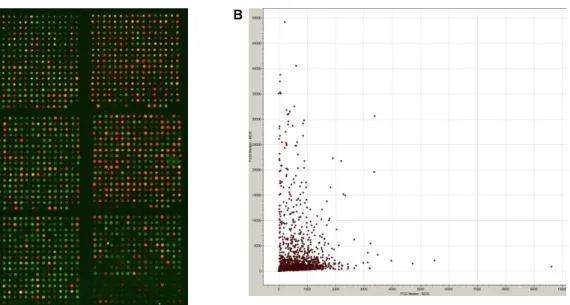
Discounting 877 overlapping genes or non-amplified PCR products in libraries, the bovine chip was constructed with 1,680 specific genes from muscle and fat. In these experi- ments, genes were considered to be differentially expressed only if the change was >2.0-fold. Fig. 2 illustrates corre- sponding portions of arrays, in which longissimus dorsi muscle (labeled Red, Cy5) was compared with back fat tis- sues (labeled Green, Cy3). In addition, the fluorescence lev- els of expressed genes were plotted. The expression levels of several genes were altered as a result of these hybrid- izations. According to hybridization (longissimus dorsi mus-
A B
Fig. 2. Gene expression monitored on a microarray and scatter plot between longissimus dorsi muscle and back fat tissue. The array contains 1,680 specific bovine cDNAs and housekeeping genes (GAPDH and β-actin). Fluorescent scans represented in a pseudocolor scale correspond to expression levels. The pseudocolored image represents portions of a microarray with reference target; longissimus dorsi muscle is in red (Cy5) and back fat tissue is in green (Cy3).
cle versus back fat tissue), 592 genes were increased (>2.0-fold) and 310 genes were decreased (<-2.0- fold). Only 97 genes (0.07%) were similarly expressed (>0.9-fold,
<1.1-fold) in both control and test (Table 1).
Expression of genes by microarray analysis The expression levels of selected genes were confirmed by semi-quantitative RT-PCR. The results showed that the expression levels measured by microarray were similar to those measured by quantitative RT-PCR (Fig. 3).
Discussion
Microarray technology promises not only to simulta- neously monitor differential expression of hundreds of genes but also to make possible a whole new experimental ap- proach in molecular biology. There have been no reports on differential gene expression profiles of bovine muscle and fat tissues, however. In this study, a large number of differ- entially expressed genes and commonly expressed genes from muscle and fat tissues of native Korean cattle were found in hybridization.
Only with hybridization will longissimus dorsi muscle (Cy5) versus back fat tissue (Cy3) possibly not predict main candidate genes to regulate molecular events in muscle and fat tissue. There are 902 differential expression genes be- tween longissimus dorsi muscle tissue (Cy5) and back fat
tissue (Cy3). It is difficult to define which genes really func- tion to synthesize muscle or fat. We thus made different de- signs to hybridize between longissimus dorsi muscle (Cy5) and rump tissue (Cy3). According to this and previous hy- bridization, 43 genes turned out to be commonly up-regu- lated (that is, more than two-fold in the ratio of Cy5/Cy3).
Seven genes were commonly down-regulated (<-2-fold, Cy5/Cy3) on each hybridization (data are not shown). It is probable that 50 genes might be specifically expressed as candidate genes to elucidate molecular mechanisms in long- issimus dorsi muscle tissue. This result agrees with other studies, which have shown that cysteine and glycine-rich protein 3 is a novel essential regulator of myogenesis and is a promoter of myogenic differentiation [1]. Other studies have shown that myosin light chain-2 plays a role in the regulation of cardiogenic development [4], and tropomyosin 1 (TPM1) acts to stabilize actin microfilaments [10]. Carbonic anhydrase III is highly expressed in muscle and fat tissue, where it constitutes up to 25% of the soluble protein [5].
A number of studies have shown the tissue-specific ex- pression of genes. For instance, alpha-actinin-2-associated LIM protein (ALP) was expressed at a high level only in differentiated skeletal muscle [12]. Nebulin has a function as a giant filamentous protein specific for vertebrate skeletal muscles [6]. Other studies have found genes that are in- volved in certain functions. Cardiac alpha tropomyosin is a regulatory protein associated with the thin filament in ver-
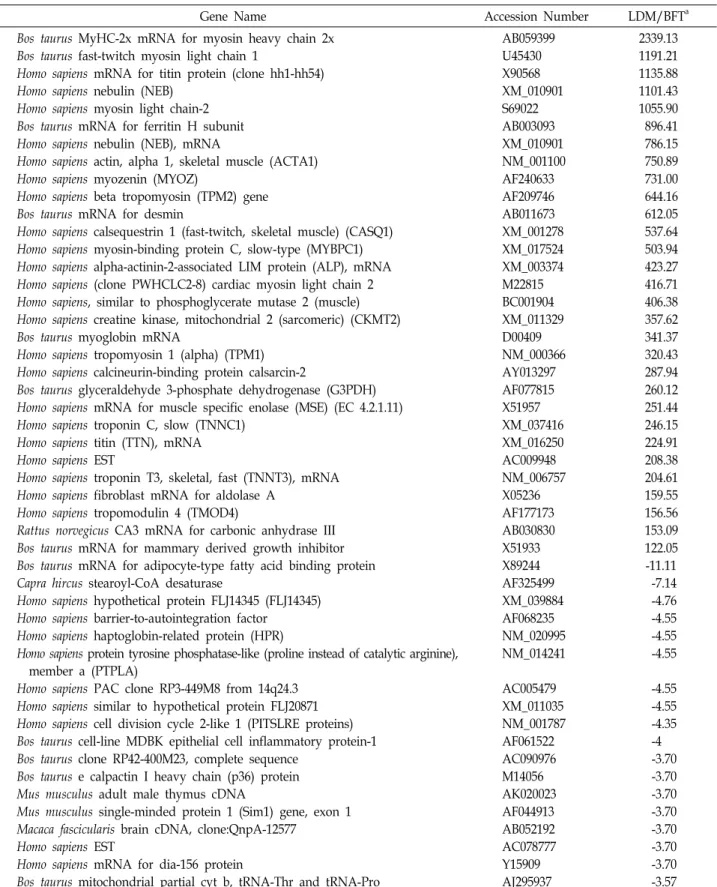
Table 1. Significantly differentially expressed genes between longissimus dorsi muscle and back fat tissue by microarray analysis
A) Up-regulation
Gene Name Accession Number LDM/BFTa
Bos taurus MyHC-2x mRNA for myosin heavy chain 2x Bos taurus fast-twitch myosin light chain 1
Homo sapiens mRNA for titin protein (clone hh1-hh54) Homo sapiens nebulin (NEB)
Homo sapiens myosin light chain-2 Bos taurus mRNA for ferritin H subunit Homo sapiens nebulin (NEB), mRNA
Homo sapiens actin, alpha 1, skeletal muscle (ACTA1) Homo sapiens myozenin (MYOZ)
Homo sapiens beta tropomyosin (TPM2) gene Bos taurus mRNA for desmin
Homo sapiens calsequestrin 1 (fast-twitch, skeletal muscle) (CASQ1) Homo sapiens myosin-binding protein C, slow-type (MYBPC1) Homo sapiens alpha-actinin-2-associated LIM protein (ALP), mRNA Homo sapiens (clone PWHCLC2-8) cardiac myosin light chain 2 Homo sapiens, similar to phosphoglycerate mutase 2 (muscle) Homo sapiens creatine kinase, mitochondrial 2 (sarcomeric) (CKMT2) Bos taurus myoglobin mRNA
Homo sapiens tropomyosin 1 (alpha) (TPM1) Homo sapiens calcineurin-binding protein calsarcin-2
Bos taurus glyceraldehyde 3-phosphate dehydrogenase (G3PDH) Homo sapiens mRNA for muscle specific enolase (MSE) (EC 4.2.1.11) Homo sapiens troponin C, slow (TNNC1)
Homo sapiens titin (TTN), mRNA Homo sapiens EST
Homo sapiens troponin T3, skeletal, fast (TNNT3), mRNA Homo sapiens fibroblast mRNA for aldolase A
Homo sapiens tropomodulin 4 (TMOD4)
Rattus norvegicus CA3 mRNA for carbonic anhydrase III Bos taurus mRNA for mammary derived growth inhibitor Bos taurus mRNA for adipocyte-type fatty acid binding protein Capra hircus stearoyl-CoA desaturase
Homo sapiens hypothetical protein FLJ14345 (FLJ14345) Homo sapiens barrier-to-autointegration factor
Homo sapiens haptoglobin-related protein (HPR)
Homo sapiens protein tyrosine phosphatase-like (proline instead of catalytic arginine), member a (PTPLA)
Homo sapiens PAC clone RP3-449M8 from 14q24.3 Homo sapiens similar to hypothetical protein FLJ20871 Homo sapiens cell division cycle 2-like 1 (PITSLRE proteins) Bos taurus cell-line MDBK epithelial cell inflammatory protein-1 Bos taurus clone RP42-400M23, complete sequence
Bos taurus e calpactin I heavy chain (p36) protein Mus musculus adult male thymus cDNA
Mus musculus single-minded protein 1 (Sim1) gene, exon 1 Macaca fascicularis brain cDNA, clone:QnpA-12577
Homo sapiens EST
Homo sapiens mRNA for dia-156 protein
Bos taurus mitochondrial partial cyt b, tRNA-Thr and tRNA-Pro
AB059399 U45430 X90568 XM_010901 S69022 AB003093 XM_010901 NM_001100 AF240633 AF209746 AB011673 XM_001278 XM_017524 XM_003374 M22815 BC001904 XM_011329 D00409 NM_000366 AY013297 AF077815 X51957 XM_037416 XM_016250 AC009948 NM_006757 X05236 AF177173 AB030830 X51933 X89244 AF325499 XM_039884 AF068235 NM_020995 NM_014241
AC005479 XM_011035 NM_001787 AF061522 AC090976 M14056 AK020023 AF044913 AB052192 AC078777 Y15909 AJ295937
2339.13 1191.21 1135.88 1101.43 1055.90 896.41 786.15 750.89 731.00 644.16 612.05 537.64 503.94 423.27 416.71 406.38 357.62 341.37 320.43 287.94 260.12 251.44 246.15 224.91 208.38 204.61 159.55 156.56 153.09 122.05 -11.11 -7.14 -4.76 -4.55 -4.55 -4.55
-4.55 -4.55 -4.35 -4 -3.70 -3.70 -3.70 -3.70 -3.70 -3.70 -3.70 -3.57
aThe ratio expression values for the average expression values of each gene between longissimus dorsi Muscle (Cy5) and back fat tissue (Cy3). This list only represents 30 genes out of 592 genes that were up-regulated between Cy5 and Cy3.
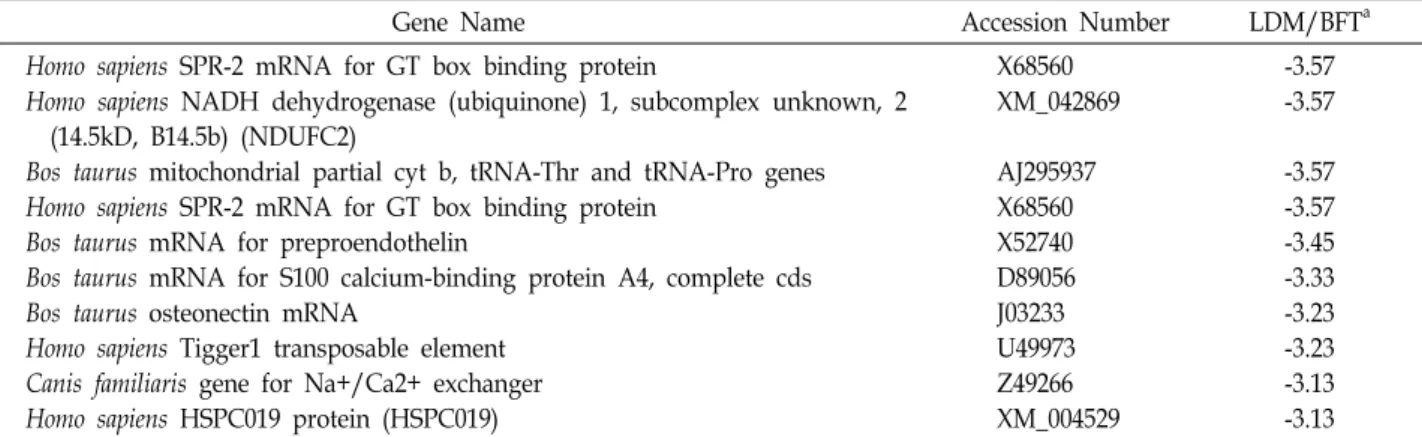
B) Down-regulation
Gene Name Accession Number LDM/BFTa
Homo sapiens SPR-2 mRNA for GT box binding protein
Homo sapiens NADH dehydrogenase (ubiquinone) 1, subcomplex unknown, 2 (14.5kD, B14.5b) (NDUFC2)
Bos taurus mitochondrial partial cyt b, tRNA-Thr and tRNA-Pro genes Homo sapiens SPR-2 mRNA for GT box binding protein
Bos taurus mRNA for preproendothelin
Bos taurus mRNA for S100 calcium-binding protein A4, complete cds Bos taurus osteonectin mRNA
Homo sapiens Tigger1 transposable element Canis familiaris gene for Na+/Ca2+ exchanger Homo sapiens HSPC019 protein (HSPC019)
X68560 XM_042869
AJ295937 X68560 X52740 D89056 J03233 U49973 Z49266 XM_004529
-3.57 -3.57
-3.57 -3.57 -3.45 -3.33 -3.23 -3.23 -3.13 -3.13
aThe ratio expression values for the average expression values of each gene between longissimus dorsi muscle (Cy5) and back fat tissue (Cy3). This list only representats 30 genes out of 310 genes that were down-regulated between Cy5 and Cy3.
Fig. 3. RT-PCR was used to confirm the differential gene expression of five genes by microarray analysis. Each panel contains a gene name; pictures of the actual dots represent that gene from microarrays and electrophoresis pictures of RT-PCR, and a bar graph represent the intensity values from RT-PCR. Band intensities were measured using multi-analyst software, normal- ized against corresponding background. L= Longissimus dorsi muscle; R= rump tissue; B= back fat tissue; M= marker. Beta actin used as a control.
tebrate-striated muscle [7], and myosin heavy chain dictates contractile velocity and contraction force. It is almost certain that commonly expressed genes within both hybridizations were involved in muscle metabolism, energy metabolism, growth and development in the longissimus dorsi muscle.
It is clear that 43 genes from the longissimus dorsi muscle were up-regulated at least two-fold compared to rump tissue or back fat tissue. On the other hand, seven genes were down-regulated in the longissimus dorsi muscle. These genes thus must be involved in signaling pathways as well
as functions. Although in our study there were 50 genes for which the molecular mechanism was not well known, these genes could be important candidate genes to regulate the formation of muscle and fat in longissimus dorsi muscle.
These genes were differentially expressed, and they might be involved in forming the characteristics of longissimus dorsi muscle tissue.
In this study, 344 genes were specifically expressed in this hybridization. Although the genes originated from back fat tissue, 219 out of the 344 genes were up regulated (>2-fold,
Cy5/Cy3). When genes were derived from the longissimus dorsi muscle, 125 out of 344 genes were down regulated (<2-fold, Cy5/Cy3) between muscle and fat. The specifically expressed genes that were found in this experiment were also partially studied by other groups. Galactose-binding lec- tin plays an important role in embryogenesis, oncogenesis, adhesion and proliferation of the cells, mRNA splicing, bac- terial colonization, apoptosis, and the modulation of the im- mune response [11]. Creatine kinase is an essential tran- scription factors in skeletal myogenesis [9]. In our study, the activities of a number of enzymes, such as the 12-lipoxygen- ase gene and prostaglandin D synthase, were differentially expressed; this result agrees with other studies. For example, the 12-lipoxygenase gene is capable of directly oxidizing es- terified fatty acids in lipoproteins and phospholipids [3]. In this study, the 12-lipoxygenase gene was expressed 16 times higher in the longissimus dorsi muscle than in back fat tissue. Also, prostaglandin D synthase is responsible not on- ly for the differentiation of fibroblasts to adipocytes but also for the regulation of activated macrophages [8]. In our study, it is interesting to note that prostaglandin D synthase had five times higher expression in longissimus dorsi muscle.
This result suggests that prostaglanding D synthase is capa- ble of trans-differentiating muscle tissue into intramuscular fat. Based on these observations with supporting results from other studies, it is probable that differentially expressed 344 genes might be involved in muscle, lipid, or energy me- tabolism, signal transduction, antioxidant defencse, pro- liferation, differentiation, and transcription initiation.
Stearoyl-CoA desaturase (SCD), a rate-limiting enzyme in the biosynthesis of unsaturated fatty acids, catalyzes the de- saturation of stearic acid and palmitic acid into oleic acid and palmitoleic acid, respectively [2]. In addition, it plays an important role in the regulation of fat cell metabolism.
Fig. 3 shows the expression level of SCD by microarray and RT-PCR. Although rump tissue mostly consists of muscle tissue, the expression level of SCD was higher in the rump tissue than in the longissimus dorsi muscle. The SCD gene thus could be used as a model to study mechanisms of cel- lular differentiation and the pattern of tissue-specific gene expression.
In the present study, the results of cDNA microarray, which scanned thousands of genes simultaneously, revealed a complex genotype between muscle and fat tissues of native Korean cattle. Profiles of differentially expressed genes were listed based on the results of each hybridizations. Even
though some genes had already been found and their func- tions studied, the overall molecular mechanism of long- issimus dorsi muscle has not yet been exposed. To elucidate the basic mechanisms of intramuscular fat and intercellular communication, many candidate genes were found in the current study using microarray analysis. It is clear that fur- ther experiments are needed to explain the relationship among differentially expressed genes from the longissimus dorsi muscle of native Korean cattle with known genes, ESTs, and novel genes.
In conclusion, the comparison of differential gene ex- pression in the fat and muscle tissues from native Korean cattle showed that a substantial number of genes were displayed. Certain genes were expressed to a high level in the designated tissue, as was expected. For instance, myosin light chain-2, nebulin, and creatine kinase were shown to be highly specific to longissimus dorsi muscle. We also ob- served, however, that a few genes, such as prostaglandin D synthase and 12-lipoxygenase gene, expressed in both tis- sues unexpectedly; this type of gene could be a good candi- date gene to study the mechanisms and signaling pathways for the synthesis of intramuscular fat.
Acknowledgement
This work was supported by Gyeongnam National University of Science and Technology Grant 2014.
References
1. Arber, S., Halder, G. and Caroni, P. 1994. Muscle LIM pro- tein, a novel essential regulator of myogenesis, promotes myogenic differentiation. Cell 79, 221-231.
2. Enoch, H. G., Catala, A. and Strittmatter, P. 1976. Mechan- ism of rat liver microsomal stearyl-CoA desaturase. Studies of the substrate specificity, enzyme-substrate interaction, and the function of lipid. J. Biol. Chem. 251, 5095-5103.
3. George, J., Afek, A., Shaish, A., Levkovitz, H., Bloom, N., Cyrus, T., Zhao, L., Funk, C. D., Sigal, E. and Harats, D.
2001. 12/15-Lipoxygenase gene disruption attenuates athe- rogenesis in LDL receptor-deficient mice. Circulation 104, 1646-1650.
4. Ghatpande, S., Shafiq, S. and Siddiqui, M. A. 2001.
Ventricular myosin light chain-2 gene expression in devel- oping heart of chicken embryos. Biol. Res. 34, 1-6.
5. Kim, G., Lee, T., Wynshaw-Boris, A. and Levine, R. L. 2001.
Nucleotide sequence and structure of the mouse carbonic anhydrase III gene. Gene 265, 37-44.
6. Labeit, S. and Kolmerer, B. 1995. The complete primary structure of human nebulin and its correlation to muscle
초록:cDNA microarray를 이용하여 한우의 근육과 지방조직의 유전자 발현 패턴 분석 및 bovine customer cDNA chip 구성 연구
한경호1․최은영2․홍연희3․김재영3․최인순2․이상석4․최윤재5․조광근3*
(1스크립스연구소, 2신라대학교 생물과학과, 3경남과학기술대학교 동물소재공학과, 4순천대학교 동물자원과학과,
5서울대학교 농업생명과학대)
소의 질을 평가하기 위해서는 중요한 인자인 근육내 지방(또는 마블링)을 조절하는 분자를 연구해야 한다.
cDNA microarray를 사용하여 등지방 조직과 최장근의 유전자발현 차이를 비교하였다. 이 연구를 통해, 우리는 한우의 지방조직에 1211개, 근육조직에서 1346개의 특이 유전자를 확인하였다. bovine chip은 지방조직의 920개 유전자와 근육조직의 760개 유전자로 이루어진 1680개의 특이 유전자로 구성되어있다. 이 실험에서 Microarray 분석은 등지방조직(Cy3)과 최장근(Cy5)의 유전자 발현에 있어서 큰 차이를 보여준다. 차이를 보이는 많은 특이유 전자 중에서, 12-리폭시게나아제 유전자와 프로스타글란딘 D 합성효소는 근육내 지방의 축적을 조절하는 중요한 효소이다. 본 연구에서, 일반적으로 발현되지만 한우의 근육과 지방 조직에서 차이를 보이는 많은 유전자를 hy- bridization 분석을 통해 발견하였다. 선택된 유전자의 발현 수준은 반정량적 RT-PCR을 통해 확인하였고, 그 결과 는 cDNA microarray와 유사하였다.
structure. J. Mol. Biol. 248, 308-315.
7. Murphy, R. A. 1976. Structural proteins in the myofilaments and regulation of contraction in vertebrate smooth muscle.
Fed. Proc. 35, 1302-1306.
8. Ohara, M. and Sawa, T. 1999. Current topics in the regu- lation of prostanoids-4. The feedback regulation by PPAR-gamma. Masui 48, 146-151.
9. Qin, W., Khuchua, Z., Cheng, J., Boero, J., Payne, R. M. and Strauss, A. W. 1998. Molecular characterization of the crea- tine kinases and some historical perspectives. Mol. Cell Biochem. 184, 153-167.
10. Shah, V., Bharadwaj, S., Kaibuchi, K. and Prasad, G. L. 2001.
Cytoskeletal organization in tropomyosin-mediated re- version of ras-transformation: Evidence for Rho kinase pathway. Oncogene 20, 2112-2121.
11. Wada, J. and Makino, H. 2001. Galectins, galactoside-bind- ing mammalian lectins: clinical application of multi-func- tional proteins. Acta. Med. Okayama 55, 11-17.
12. Xia, H., Winokur, S. T., Kuo, W. L., Altherr, M. R. and Bredt, D. S. 1997. Actinin-associated LIM protein: identification of a domain interaction between PDZ and spectrin-like repeat motifs. J. Cell Biol. 139, 507-515.