Research Report
성목기 ‘후지’/M.9 사과나무의 해거리 방지와 수세안정을 위한 재식거리별 적정 착과 수준
사공동훈1,2, 윤태명3*
1대구대학교 원예학과
2대구대학교 생명환경연구소
3경북대학교 원예과학과
Optimum Crop Load in Different Planting Densities of Adult ‘Fuji’/M.9 Apple Tree for Preventing Biennial Bearing and Stabilizing Tree Vigor
Dong-Hoon Sagong
1,2and Tae-Myung Yoon
3*1
Department of Horticulture, Daegu University, Gyeongsan 712-714, Korea
2
Institute of Life and Environment, Daegu University, Gyeongsan 712-714, Korea
3
Department of Horticultural Science, Kyungpook National University, Daegu 702-701, Korea
Abstract: This study was conducted in three years (7-9 years after planting) to investigate vegetative growth, yield, fruit quality, and return bloom for optimum crop load based on different planting densities of adult ‘Fuji’/M.9 apple trees. As plant materials,
‘Fuji’/M.9 apple trees planted at 3.5 × 1.5 m (190 trees per 10 a), 3.5 × 1.2 m (238 trees per 10 a), and 3.2 × 1.2 m (260 trees per 10 a) spacing and trained as slender spindles were used. The crop load was assigned to five different object ranges as follows: 55-64, 65-74, 75-84, 85-94, and 95-104 fruit per tree. TCA increment, total shoot growth, return bloom, yield per tree, and yield efficiency tended to increase as planting density decreased, and fruit weight and soluble solid content tended to increase as the object range of crop load decreased. Fruit red color tended to increase as shoot growth decreased. For apple trees planted with 238 trees and 260 trees per 10a, biennial bearing occurred when the crop load was over 85-94 and 75-84 fruits, respectively. However, biennial bearing did not occur when the crop load was 95-104 fruits in apple trees planted with 190 trees per 10a. Accumulated yield tended to increase as planting density and crop load increased, but that of biennial bearing did not show such a difference. Based on our results, optimum crop load recommendations are to set 95-104 fruits per tree in ‘Fuji’/M.9 mature apple trees planted at 190 trees per 10a, 75-84 fruits per tree at 238 trees per 10a, and 65-74 fruits per tree at 260 trees per 10a.
Additional key words: accumulated yield, fruit red color, Malus domestica Borkh., shoot growth, yield efficiency
*Corresponding author: [email protected]
※ Received 13 August 2013; Revised 14 May 2014; Accepted 3 July 2014.
Ⓒ 2015 Korean Society for Horticultural Science
서 언
사과의 수량, 품질, 경제수명 및 작업의 효율성은 재식밀 도에 따라 달라진다(Wertheim, 2005). 밀식을 할수록 조기 수량은 높아지나, 해가 갈수록 수관이 복잡해져 품질 및 수 량이 저하되면서 관리가 어려워지기 쉽고, 반대로 넓게 심 으면 통풍과 채광이 잘되고 관리가 편리해지나 단위면적당
수량이 적다(Eccher and Granelli, 2006; Hampson et al., 1997; Robinson, 2003).
세계 사과 주산지의 권장 재식밀도를 살펴보면, 캐나다에 서는 300주/10a 정도(Granger et al., 1986), 독일 Bodensee 지역은 400주/10a 정도(Weber, 2001), 슬로베니아는 600주 /10a 정도를 권장하였다(Hudina et al,, 2001). 스위스에서는 600주/10a의 과실품질이 300주/10a보다 떨어져 문제가 된다
(Widmer and Krebs, 2001)고 하였고, 폴란드에서는 600- 1,000주/10a의 수량 및 과실품질이 200-400주/10a보다 떨어 져 300주/10a 이상 재식하는 것은 경제성이 낮다고 하였다 (Mika and Piskor, 1997).
우리나라의 M.9 대목을 이용한 밀식 사과재배는 이태리 남티롤 지역을 모델로 하고 있는데(Yoon et al., 2005), 남티 롤을 비롯한 유럽에서는 ‘후지’/M.9의 경우 우량한 측지묘 를 재식거리 3.0-3.2×1.0-1.1m(280-330주/10a)로 심도록 권 장하고 있다(Costa et al., 1997; Eccher and Granelli, 2006;
Wertheim, 2005). 그러나 Park(2004)은 국내에서 ‘후지’/M.9 사과나무를 190주/10a 이상으로 재식하면 수관 내 광투과율 이 불량해진다고 하였다.
사과나무의 적정 착과수준은 품종, 지력, 상품과의 기준, 관리 상태에 따라 달라져야 한다(Choi et al., 2009; Foshey and Elfving, 1989). ‘후지’는 타 품종에 비해 영양생장이 왕 성하고 해거리가 심한 경향이 있어(Costa et al., 1997; Ogata et al., 1986; Tustin et al., 1993), 나무 크기에 비해 과도하게 착과가 되면 해거리가 발생하여 안정적인 과실생산이 힘들 어지므로 착과수준을 나무 크기에 맞게 적절히 조절하여야 한다(Choi et al., 2009). 즉, ‘후지’/M.9의 적정 착과수준은 재식밀도에 따라 달라져야 하는데, 국내에는 유목과 성목
‘후지’/M.9의 적정 착과수준만 제시되어 있을 뿐(Choi et al., 2009; Park et al., 2008), 재식밀도를 고려한 ‘후지’/M.9의 적정 착과수준은 보고되어 있지 않다.
본 시험은 성목기 ‘후지’/M.9 사과나무의 재식거리별 착 과수준에 따른 영양생장, 과실품질, 10a당 생산량 및 수량효 율을 조사하여 재식밀도별 적정 착과수준을 제시하고자 실 시하였다.
재료 및 방법
시험재료 및 처리방법
경북대학교 부속 실습 사과원에서 1998년 봄에 3.5 × 1.5m (190주/10a), 3.5 × 1.2m(238주/10a), 3.2 × 1.2m(260주/10a) 로 재식하여 세장방추형으로 키운 ‘후지’/M.9 사과나무를 공시하여 시험하였다.
시비관리는 과원 개원 전에 10a당 퇴비 4톤과 석회 100kg 을 시용하였고, 재식 2년차에는 유기질비료 500kg・10a-1를 추 가로 시용한 후 경운하였다. 과수복합비료(N:P:K = 21:17:17) 는 재식 1년차부터 8년차까지 주당 100g씩 시용하였다. 재 식 9년차(2006년)에는 3월 중순에 완숙퇴비를 10a당 4톤
정도 시비한 후 수세에 따라 나무 별로 과수복합비료를 80-160g 정도 추가로 주었다. 정지전정은 경북대학교 키 낮 은 사과원 관리기준(수고 2.5m의 세장방추형)에 따라 겨울 철에 약한 결실지를 주간연장지로 대체하면서 수고를 2.5m 내외로 제한하였고, 수폭은 약한 결과지나 꽃눈이 발생된 가지, 연령 변환부에서 제한하면서 옆의 나무와 겹쳐지지 않도록 관리하였다(Yang et al., 2010). 토양수분은 부족하지 않게 수시로 점적관수를 실시하였으며, 기타 관리는 경북대 학교 키 낮은 사과원 관리기준에 따랐다.
시험기간은 재식 7년차부터 9년차(2004-2006년)까지 이 었으며, 시험수의 재식 7년차 3월 말의 평균 주간직경은 190 주 재식구가 65mm이었고, 238주와 260주 재식구는 60mm 이었다. 재식 7년차의 목표 착과수준(object range of crop load)은 5월 말에 주당 과실수를 5수준(55-64과, 65-74과, 75-84과, 85-94과, 95-104과)으로 하였다. 재식 8, 9년차 시 험수의 과실수는 매년 5월 초에 주당 착과수를 조사한 뒤 5월 말에 조절하였는데, 5월 초 착과수가 목표 착과수준보 다 적은 나무는 적과하지 않았다. 시험구 배치는 한 나무를 1반복으로 한 2요인(재식거리: 3수준, 주당 결실수: 5수준) 5반복이었다.
영양생장과 이듬해 개화율
주간횡단면적(trunk cross-sectional area, TCA)의 증가는 시험기간 동안 시험수 모두 생장 개시 전(3월 말)과 생장 종료 후(11월 말)에 접목부 상단 5cm에서의 줄기직경을 방 향을 바꾸어 2회 측정 평균하여 TCA 차이를 cm2로 표시하 였다.
총 신초는 재식 7년차와 8년차 12월에 나무당 길이 3cm 이상인 신초수와 각각의 길이를 모두 조사하였다.
이듬해 개화율은 이듬해 개화 전에 나무전체의 정아 수를 조사하고, 4월에 개화한 정아의 수를 조사하여 나타내었다.
생산량 및 수량 효율
10월말부터 11월 초 사이에 주당 과실수와 생산량을 조사 하여 과중과 10a당 생산량을 산출하였다. 10a당 누적생산량 은 3년(2004-2006년) 동안의 생산량을 합하여 나타내었다.
착과밀도(crop density)는 매년 3월 말에 측정한 TCA당 (cm2) 수확 시 주당 과실수, 수량 효율(yield efficiency)은 매 년 11월 말에 측정한 TCA당(cm2) 주당 생산량으로 나타내 었다(Robinson et al., 1991; Yang et al., 2010).
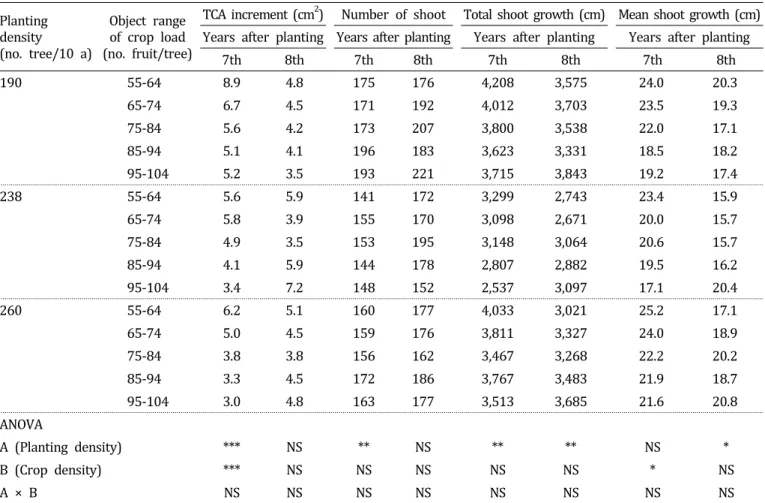
Table 1. TCA increment, shoot number, total shoot growth, and mean shoot growth per tree according to planting density and crop load of adult ‘Fuji’/M.9 apple tree for 2 years.
Planting density (no. tree/10 a)
Object range of crop load (no. fruit/tree)
TCA increment (cm
2) Number of shoot Total shoot growth (cm) Mean shoot growth (cm) Years after planting Years after planting Years after planting Years after planting
7th 8th 7th 8th 7th 8th 7th 8th
190 55-64 8.9 4.8 175 176 4,208 3,575 24.0 20.3
65-74 6.7 4.5 171 192 4,012 3,703 23.5 19.3
75-84 5.6 4.2 173 207 3,800 3,538 22.0 17.1
85-94 5.1 4.1 196 183 3,623 3,331 18.5 18.2
95-104 5.2 3.5 193 221 3,715 3,843 19.2 17.4
238 55-64 5.6 5.9 141 172 3,299 2,743 23.4 15.9
65-74 5.8 3.9 155 170 3,098 2,671 20.0 15.7
75-84 4.9 3.5 153 195 3,148 3,064 20.6 15.7
85-94 4.1 5.9 144 178 2,807 2,882 19.5 16.2
95-104 3.4 7.2 148 152 2,537 3,097 17.1 20.4
260 55-64 6.2 5.1 160 177 4,033 3,021 25.2 17.1
65-74 5.0 4.5 159 176 3,811 3,327 24.0 18.9
75-84 3.8 3.8 156 162 3,467 3,268 22.2 20.2
85-94 3.3 4.5 172 186 3,767 3,483 21.9 18.7
95-104 3.0 4.8 163 177 3,513 3,685 21.6 20.8
ANOVA
A (Planting density) *** NS ** NS ** ** NS *
B (Crop density) *** NS NS NS NS NS * NS
A × B NS NS NS NS NS NS NS NS
NS,*,**,***
Not significant or significant at p ≤ 0.05, 0.01, and 0.001, respectively.
과실품질
가용성고형물 함량, 산 함량 및 착색 등의 과실품질은 재식 7년차와 8년차에 시험수 모두 주당 5개의 사과를 임 의로 택하여 조사하였다. 착색도는 색차계(NR-3000, Minolta, Japan)를 사용하여 각각의 과실을 3부분(양광면, 음광면, 중 간부분)의 평균값을 Hunter a value로 표시하였다. 가용성고 형물 함량은 다섯개 과실을 모두 분쇄하여 착즙한 후 거름 종이로 걸러 디지털당도계(PR-101, Atago Co., Japan)로 측 정하였고, 산 함량은 과즙 5mL를 증류수 20mL로 희석한 후 0.1N NaOH로 적정하여 pH 8.1이 되는 점의 적정치를 사과산으로 환산하였다.
결과 및 고찰
영양생장과 이듬해 개화율
재식 7년차의 TCA 증가는 재식밀도와 목표 착과수준이
높을수록 감소하였다. 총 신초수와 총 신초장은 재식밀도가 높을수록 감소하였고, 평균 신초장은 목표 착과수준이 높을 수록 감소하였다. 그러나 재식 8년차의 TCA 증가와 총 신 초수는 재식밀도와 목표 착과수준에 영향을 받지 않았고, 총 신초장과 평균 신초장은 238주 재식구에서 가장 적었다 (Table 1).
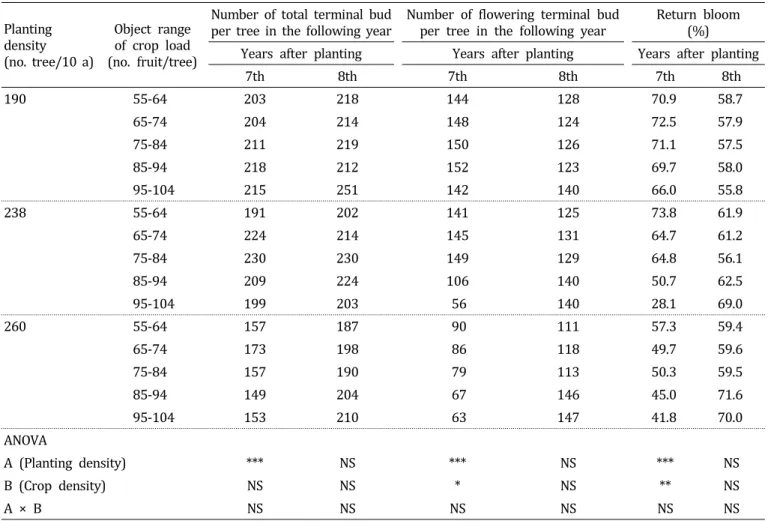
재식 7년차의 이듬해 총 정아수는 재식밀도가 높을수록 감소되었고, 이듬해 개화된 총 정아수와 개화율은 재식밀도 와 목표 착과수준이 높을수록 감소하였다. 그러나 재식 8년 차의 이듬해 총 정아수, 개화된 총 정아수 및 개화율은 재식 7년차와 달리 재식밀도 및 목표 착과수준에 영향을 받지 않 았다(Table 2).
재식밀도가 높을수록 나무의 영양생장은 감소하고(Hampson et al., 2002; Ogata et al., 1986; Park, 2004; Tustin et al., 1993), 주당 결실량이 많을수록 수체 내 탄수화물 축적이 감소 되어 당년 및 이듬해의 영양생장과 꽃눈 수가 감소한다(Choi
Table 2. Total terminal bud number and flowering terminal bud number per tree in the following year, and return bloom according to planting density and crop load of adult ‘Fuji’/M.9 apple tree for 2 years.
Planting density (no. tree/10 a)
Object range of crop load (no. fruit/tree)
Number of total terminal bud
per tree in the following year Number of flowering terminal bud
per tree in the following year Return bloom (%) Years after planting Years after planting Years after planting
7th 8th 7th 8th 7th 8th
190 55-64 203 218 144 128 70.9 58.7
65-74 204 214 148 124 72.5 57.9
75-84 211 219 150 126 71.1 57.5
85-94 218 212 152 123 69.7 58.0
95-104 215 251 142 140 66.0 55.8
238 55-64 191 202 141 125 73.8 61.9
65-74 224 214 145 131 64.7 61.2
75-84 230 230 149 129 64.8 56.1
85-94 209 224 106 140 50.7 62.5
95-104 199 203 56 140 28.1 69.0
260 55-64 157 187 90 111 57.3 59.4
65-74 173 198 86 118 49.7 59.6
75-84 157 190 79 113 50.3 59.5
85-94 149 204 67 146 45.0 71.6
95-104 153 210 63 147 41.8 70.0
ANOVA
A (Planting density) *** NS *** NS *** NS
B (Crop density) NS NS * NS ** NS
A × B NS NS NS NS NS NS
NS,*,**,***
Not significant or significant at p ≤ 0.05, 0.01, and 0.001, respectively.
et al., 2009; Erf and Proctor, 1987; Forshey and Elfving, 1989; Giuliani et al., 1997; Palmer et al., 1997; Volz et al., 1993). 본 시험에서는 재식 7년차의 경우 재식밀도와 목표 착과수준이 높을수록 당년의 영양생장 및 이듬해 개화율이 감소하는 경향이 있었다. 그러나 재식 8년차 영양생장 및 이듬해 개화율에 대한 재식밀도 및 목표 착과수준의 영향은 재식 7년차만큼 크지 않았다. 또한, 시험구들의 평균 신초장 은 15-25cm 사이로, ‘후지’/M.9 밀식재배 시 성목기의 안정 된 수세 기준은 평균 신초장이 20-25cm 정도라는 보고(Park et al., 2008)보다 다소 적은 편이었다(Tables 1 and 2).
재식 8년차의 영양생장 및 이듬해 개화율이 재식 7년차만 큼 재식밀도 및 목표 착과수준의 영향을 받지 않았던 것 (Tables 1 and 2)은 재식 8년차에 238주와 260주 재식구에서 해거리가 각각 발생하였기 때문으로 판단되었다. 이는 재식 년차에 190주 재식구의 평균 신초장은 목표 착과수준이 높
을수록 감소되는 경향이 있었지만 238주와 260주 재식구는 반대였고(Table 1), 190주 재식구의 모든 착과구는 2년 모두 이듬해 개화된 정아수가 목표 착과수준보다 높았던 반면, 238주와 260주 재식구의 95-104과 착과구는 재식 7년차의 이듬해 개화된 정아수가 목표 착과수준의 절반 수준에 불과 했다가 재식 8년차에 7년차 대비 2배 이상 증가하였던 결과 (Table 2)에서 확인할 수 있었다.
생산량 및 수량 효율
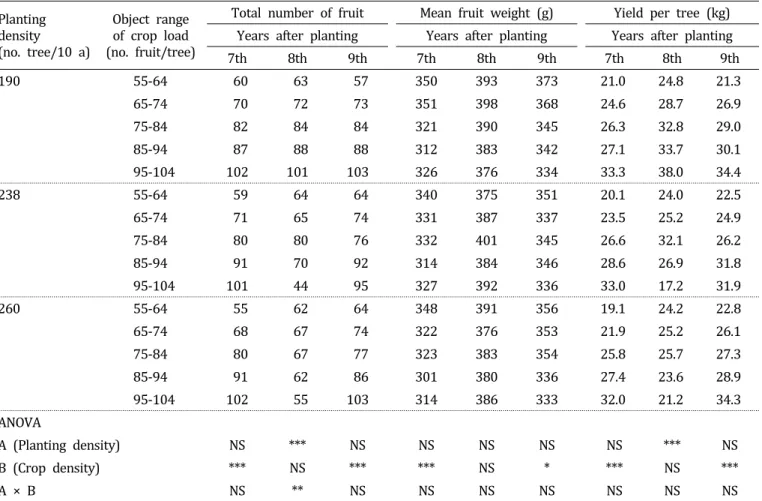
수확 과실수는 재식 7년차와 9년차 모두 목표 착과수준에 도달하였다. 그러나 재식 8년차 238주 재식구는 85-94과 이 상 착과구, 260주 재식구는 75-84과 이상 착과구의 수확 과 실수가 목표 착과수준보다 낮았다. 평균과중은 재식 8년차 만 재식밀도 및 목표 착과수준에 영향을 받지 않았을 뿐, 재식 7년차와 9년차에는 목표 착과수준이 높을수록 감소되
Table 3. Total fruit number, mean fruit weight, and yield per tree according to planting density and crop load of adult ‘Fuji’/M.9 apple tree for 3 years.
Planting density (no. tree/10 a)
Object range of crop load (no. fruit/tree)
Total number of fruit Mean fruit weight (g) Yield per tree (kg) Years after planting Years after planting Years after planting
7th 8th 9th 7th 8th 9th 7th 8th 9th
190 55-64 60 63 57 350 393 373 21.0 24.8 21.3
65-74 70 72 73 351 398 368 24.6 28.7 26.9
75-84 82 84 84 321 390 345 26.3 32.8 29.0
85-94 87 88 88 312 383 342 27.1 33.7 30.1
95-104 102 101 103 326 376 334 33.3 38.0 34.4
238 55-64 59 64 64 340 375 351 20.1 24.0 22.5
65-74 71 65 74 331 387 337 23.5 25.2 24.9
75-84 80 80 76 332 401 345 26.6 32.1 26.2
85-94 91 70 92 314 384 346 28.6 26.9 31.8
95-104 101 44 95 327 392 336 33.0 17.2 31.9
260 55-64 55 62 64 348 391 356 19.1 24.2 22.8
65-74 68 67 74 322 376 353 21.9 25.2 26.1
75-84 80 67 77 323 383 354 25.8 25.7 27.3
85-94 91 62 86 301 380 336 27.4 23.6 28.9
95-104 102 55 103 314 386 333 32.0 21.2 34.3
ANOVA
A (Planting density) NS *** NS NS NS NS NS *** NS
B (Crop density) *** NS *** *** NS * *** NS ***
A × B NS ** NS NS NS NS NS NS NS
NS,*,**,***
Not significant or significant at p ≤ 0.05, 0.01, and 0.001, respectively.
었다. 주당 생산량은 재식 7년차와 9년차의 경우 목표 착과 수준이 높을수록 증가되었고, 재식 8년차에는 재식밀도가 높을수록 감소되었다(Table 3).
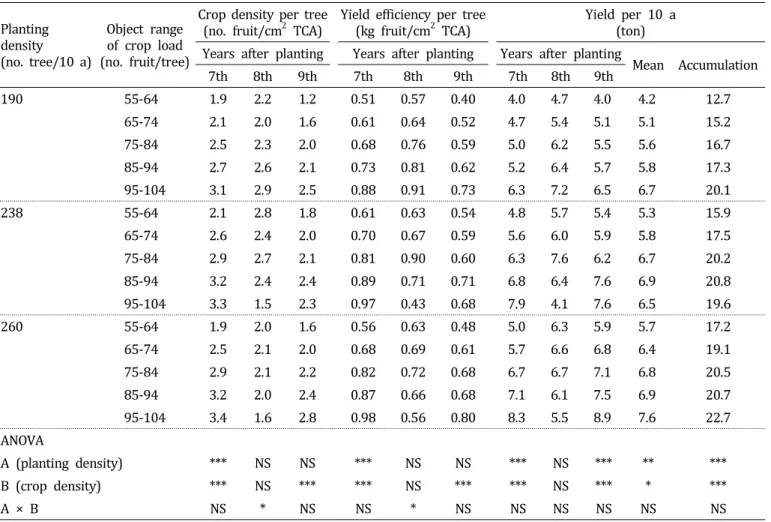
착과밀도, 수량효율 및 10a당 생산량은 재식 7년차와 9년 차의 경우 재식밀도 및 목표 착과수준이 높을수록 증가하였 다. 그러나 재식 8년차에는 190주 재식구의 경우 목표 착과 수준이 높을수록 착과밀도, 수량 효율 및 10a당 생산량이 증가하는 경향이 있었지만 238주와 260주 재식구의 착과밀 도와 수량 효율은 95-104과 착과구가 가장 낮았고, 10a당 생산량은 재식밀도 및 목표 착과수준에 영향을 받지 않았다 (Table 4). 3년 동안의 10a당 누적생산량은 재식밀도 및 목 표 착과수준이 높을수록 많아졌다. 그러나 238주 재식구에 서 해거리가 발생한 90과 이상 착과구들의 10a당 누적생산 량은 19.6-20.8ton 사이로 해거리가 발생하지 않은 75-84과 착과구의 20.2ton과 차이가 거의 없었고, 260주 재식구에서
해거리가 발생한 80과 이상 착과구들의 10a당 누적생산량 은 20.5-22.7ton 사이로 해거리가 발생하지 않은 65-74과 착 과구의 19.1ton보다는 높은 경향이 있었지만 해거리가 발생 한 착과구들 간의 유의차는 없었다(Table 4).
일반적으로 재식밀도가 높을수록 주당 생산량은 감소되 지만 단위면적당 생산량은 증가된다고 알려져 있다(Clayton- Greene, 1993; Costa et al., 1997; Cripps et al., 1975; Sansavini et al., 1986; Wertheim, 1985) 그러나 Sansavini and Corelli- Grappadelli(1997)은 재식밀도가 높을수록 해거리가 발생하 여 재식밀도에 따른 누적생산량 차이는 없어진다고 하였다.
본 시험에서는 190주 재식구의 경우 3년 동안의 주당 과 실수와 생산량은 매년 비슷하였던 반면에 238주 재식구는 재식 7년차에 주당 과실수가 90과(85-94과), 260주 재식구 는 80과(75-84과)를 넘으면 재식 8년차 주당 과실수 및 생산 량이 줄었다가, 재식 9년차에 다시 재식 7년차의 수준으로
Table 4. Crop density per tree, yield efficiency per tree, and accumulated yield per 10 a according to planting density and crop load of adult ‘Fuji’/M.9 apple tree for 3 years.
Planting density (no. tree/10 a)
Object range of crop load (no. fruit/tree)
Crop density per tree
(no. fruit/cm
2TCA) Yield efficiency per tree
(kg fruit/cm
2TCA) Yield per 10 a (ton) Years after planting Years after planting Years after planting
Mean Accumulation
7th 8th 9th 7th 8th 9th 7th 8th 9th
190 55-64 1.9 2.2 1.2 0.51 0.57 0.40 4.0 4.7 4.0 4.2 12.7
65-74 2.1 2.0 1.6 0.61 0.64 0.52 4.7 5.4 5.1 5.1 15.2
75-84 2.5 2.3 2.0 0.68 0.76 0.59 5.0 6.2 5.5 5.6 16.7
85-94 2.7 2.6 2.1 0.73 0.81 0.62 5.2 6.4 5.7 5.8 17.3
95-104 3.1 2.9 2.5 0.88 0.91 0.73 6.3 7.2 6.5 6.7 20.1
238 55-64 2.1 2.8 1.8 0.61 0.63 0.54 4.8 5.7 5.4 5.3 15.9
65-74 2.6 2.4 2.0 0.70 0.67 0.59 5.6 6.0 5.9 5.8 17.5
75-84 2.9 2.7 2.1 0.81 0.90 0.60 6.3 7.6 6.2 6.7 20.2
85-94 3.2 2.4 2.4 0.89 0.71 0.71 6.8 6.4 7.6 6.9 20.8
95-104 3.3 1.5 2.3 0.97 0.43 0.68 7.9 4.1 7.6 6.5 19.6
260 55-64 1.9 2.0 1.6 0.56 0.63 0.48 5.0 6.3 5.9 5.7 17.2
65-74 2.5 2.1 2.0 0.68 0.69 0.61 5.7 6.6 6.8 6.4 19.1
75-84 2.9 2.1 2.2 0.82 0.72 0.68 6.7 6.7 7.1 6.8 20.5
85-94 3.2 2.0 2.4 0.87 0.66 0.68 7.1 6.1 7.5 6.9 20.7
95-104 3.4 1.6 2.8 0.98 0.56 0.80 8.3 5.5 8.9 7.6 22.7
ANOVA
A (planting density) *** NS NS *** NS NS *** NS *** ** ***
B (crop density) *** NS *** *** NS *** *** NS *** * ***
A × B NS * NS NS * NS NS NS NS NS NS
NS,*,**,***
올라가는 해거리가 발생하였다(Table 3). 이는 해거리가 발 생한 착과구의 재식 7년차 이듬해 개화된 정아수가 목표 착 과수준에 달하지 못하는 경우가 발생했기 때문이었다(Table 2). 3년 평균 10a당 생산량 대비 해거리가 발생한 착과구의 재식 8년차 10a당 생산량 감소 정도는 목표 착과수준이 높 아질수록 커졌는데, 95-104과 착과구의 경우 3년 평균 대비 37%까지 감소되었다(Table 4). 이처럼 238주와 260주 재식 구에서 해거리가 발생하였음에도 불구하고 10a당 누적생산 량이 190주 재식구보다 높았던 것(Table 4)은 238주와 260 주 재식구의 재식 주수가 190주 재식구보다 많은데다가, 해 거리가 발생한 이들 착과구의 재식 9년차 주당 생산량이 재 식 7년차와 비슷해졌기 때문으로 판단되었다(Table 3).
수량 효율은 유년기에 비해 성년기가 현저히 높고, 착과 수준이 높을수록 증가하는 것으로 알려져 있다(Barden and Neilsen, 2003; Choi et al., 2009; Yang et al., 2010). 본 시험
에서의 착과밀도와 수량 효율은 재식밀도 및 목표 착과수준 이 높아질수록 증가되는 경향이 있었으나, 해가 지날수록 감소되는 경향이 있었고, 해거리가 발생한 착과구(238주: 90 과 이상 착과구, 260주: 80과 이상 착과구)의 재식 8년차 수 량 효율은 해거리가 발생하지 않은 착과구의 수량 효율과 대비하여 46%까지 감소되었다(Table 4). 본 시험에서 해가 지날수록 착과밀도와 수량 효율이 감소된 것(Table 4)은 재 식 7년차 3월에 28-33cm2범위였던 TCA가 재식 9년차 3월 에 37-44cm2 범위로 증가하였기 때문으로 생각되었다. 또 한, 재식 8년차에 해거리가 발생한 착과구들의 착과밀도와 수량 효율이 해거리가 발생하지 않은 착과구보다 감소된 것 (Table 4)은 해거리 발생 시험구들의 주당 생산량이 해거리 가 발생하지 않은 착과구보다 낮은데다가(Table 3), 재식 8 년차 TCA 증가는 반대로 높아졌기 때문(Table 1)으로 판단 되었다.
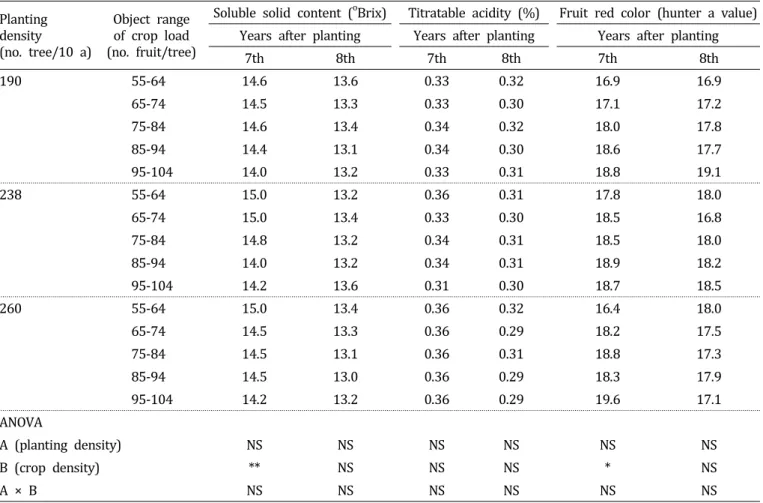
Table 5. Soluble solid content, titratable acidity and fruit red color according to planting density and crop load of adult ‘Fuji’/M.9 apple tree for 2 years.
Planting density (no. tree/10 a)
Object range of crop load (no. fruit/tree)
Soluble solid content (
oBrix) Titratable acidity (%) Fruit red color (hunter a value) Years after planting Years after planting Years after planting
7th 8th 7th 8th 7th 8th
190 55-64 14.6 13.6 0.33 0.32 16.9 16.9
65-74 14.5 13.3 0.33 0.30 17.1 17.2
75-84 14.6 13.4 0.34 0.32 18.0 17.8
85-94 14.4 13.1 0.34 0.30 18.6 17.7
95-104 14.0 13.2 0.33 0.31 18.8 19.1
238 55-64 15.0 13.2 0.36 0.31 17.8 18.0
65-74 15.0 13.4 0.33 0.30 18.5 16.8
75-84 14.8 13.2 0.34 0.31 18.5 18.0
85-94 14.0 13.2 0.34 0.31 18.9 18.2
95-104 14.2 13.6 0.31 0.30 18.7 18.5
260 55-64 15.0 13.4 0.36 0.32 16.4 18.0
65-74 14.5 13.3 0.36 0.29 18.2 17.5
75-84 14.5 13.1 0.36 0.31 18.8 17.3
85-94 14.5 13.0 0.36 0.29 18.3 17.9
95-104 14.2 13.2 0.36 0.29 19.6 17.1
ANOVA
A (planting density) NS NS NS NS NS NS
B (crop density) ** NS NS NS * NS
A × B NS NS NS NS NS NS
NS,*,**
Not significant or significant at p ≤ 0.05 and 0.01, respectively.
과실품질
재식 8년차의 가용성고형물 함량은 목표 착과수준이 낮 을수록 증가하였으나, 착색은 반대로 목표 착과수준이 높을 수록 증가하였고, 산 함량은 재식밀도 및 목표 착과수준에 영향을 받지 않았다. 재식 8년차의 가용성고형물 함량, 산 함량 및 착색은 재식밀도 및 목표 착과수준에 영향을 받지 않았다(Table 5).
과중 및 과실품질은 재식밀도 및 착과수준이 높을수록 나 무의 영양생장과 수관 내 광 투과율이 떨어져 감소된다(Choi et al., 2009; Eccher and Granelli, 2006; Granger et al., 1986;
Ogata et al., 1986; Sansavini et al., 1986; Stover et al., 2001;
Tustin et al., 1993). 그러나 Costa et al.(1997) 및 Widmer et al.(2001)은 재식밀도보다는 기후적 요인이 과실품질에 더 영향을 준다고 하였다.
본 시험에서 과중 및 과실품질은 재식밀도에는 영향을 받
지 않았다(Tables 3 and 5). 이는 착과량과 영양생장이 균형 을 이루어야 과중 및 과실품질이 증가된다는 보고(Forshey and Elfving, 1989)를 미루어 보아, 각 재식밀도별 영양생장 이 평균과중을 감소시킬 정도로 적거나 혹은 많은 편이 아 니면서 주어진 공간 내에 적절하게 조절되어(Table 1), 재식 밀도에 따른 수관 내 광투과율의 차이가 없었기 때문으로 추정되었다. 그러나 재식 7년차의 과중과 가용성고형물 함 량은 목표 착과수준이 높을수록 감소되었고, 착색은 반대로 증가하였다(Tables 3 and 5). 본 시험의 이러한 상반적 결과 (Tables 3 and 5)는 착색의 경우 과실수가 많을수록 평균 신 초장이 감소(Table 1)되면서 수관 내 광투과율이 개선되어 증가하지만, 과중과 가용성고형물 함량은 수관 내 광투과율 보다는 과실수에 따른 동화산물 분배에 영향을 더 받았기 때문(Erf and Proctor, 1987)으로 추정되었는데, Marini et al.(2002)은 과중과 가용성고형물 함량은 대목의 종류보다
는 착과수준에 더 큰 영향을 받았다고 하였다.
이상의 결과를 종합해 보면, 10a당 190주의 재식밀도에서 는 주당 100과 정도 결실시켜도 매년 주당 30kg 이상(10a당 6톤 내외)의 과실을 안정적으로 생산하면서, 수세가 안정되 어 착색이 증진되었다(Tables 1, 2, 3, 4, and 5). 그러나 238 주와 260주 재식구는 주당 각각 90과, 80과 이상 착과시키 면 신초생장이 억제되어 착색은 증진되었지만 처리당년의 가용성 고형물 함량이 감소되고, 이듬해 생산량이 전년도의 절반수준으로 감소되는 해거리가 발생하였다(Tables 1, 2, 3, 4 and 5). 따라서 190주로 재식된 ‘후지’/M.9 사과나무의 성 목기(재식 7년차 이후) 적정 결실량은 95-104과 정도, 238주 재식구는 75-84개 정도, 260주 재식구는 65-74개 정도라고 판단되었고, 재식밀도별로 적정 착과수를 준수하면 매년 10a 당 6톤 이상의 과실을 안정적으로 생산할 수 있을 것으로 생각되었다.
한편, 최근 국내외에서는 세장방추형의 수고 2.5m 제한에 따른 재배자들의 수고 상단부 관리노력 증가 및 주당 생산 량의 불만족이 문제가 되면서 세장방추형의 수고를 3.0-4.0m 정도로 높이는 추세이다(Kon et al., 2013; Robinson et al., 2006; Song et al., 2009; Wang and Cheng, 2011; Yang et al., 2009). 일반적으로 수고가 높을수록 주당 과실수 및 생 산량은 증가되는데(Callesen, 1993; Wagenmakers and Callesen, 1989; 1995), Barritt(1998)는 수고가 3.0m인 ‘후지’의 단위 면적당 생산량은 수고가 2.0m인 나무 대비 29% 정도 높았 다고 하였으며, Yang et al.(2009)은 3.2 × 1.2m로 재식된 수고 3.5m의 ‘후지’/M.9는 과실을 90-100개 정도 착과시켜 도 이듬해에 해거리가 발생하지 않았고, 수고가 3.5m인 나 무의 주당 과실수 및 생산량은 수고가 2.5m인 나무 대비 각 각 21-35% 정도(과실수 15-20개 정도), 12-25% 정도 많았다 고 하였다. 즉, 최근의 추세에 따라 세장방추형 ‘후지’/M.9 의 수고가 2.5m에서 3.5m로 높아지면서 주당 과실수 및 생 산량이 25% 정도 증가된다(Barritt, 1998; Yang et al., 2009) 고 가정할 경우, 수고가 3.5m인 세장방추형 ‘후지’/M.9의 재 식거리별 적정 과실수는 190주 재식구의 경우 119-130과 정 도, 238주 재식구는 94-105개 정도, 260주 재식구는 81-93개 정도 되며, 매년 7톤 이상의 과실을 생산할 수 있을 것으로 추정되었다. 그러나 재배환경, 품종 및 재식밀도에 따라 적 정 수고는 달라지므로(Robinson, 2003), 향후 수고가 3.5m 인 세장방추형 ‘후지’/M.9 사과나무의 적정 재식밀도에 대 한 연구가 수행되어야 할 것으로 생각되었다.
초 록
본 시험은 성목기 ‘후지’/M.9 사과나무의 재식밀도별 적 정 착과수를 조사하고자 영양생장, 생산량, 과실품질 및 이 듬해 개화율을 3년(재식 7-9년차) 동안 조사하였다. 시험재 료는 3.5 × 1.5m(190주/10a), 3.5 × 1.2m(238주/10a), 3.2 × 1.2m(260주/10a)로 심어 세장방추형을 목표수형으로 관리 하고 있는 ‘후지’/M.9 사과나무이었다. 목표 착과수 범위는 주당 55-64과, 65-74과, 75-84과, 85-94과, 95-104과의 5수준 이었다. TCA 증가, 총 신초장, 이듬해 개화율, 주당 생산량 및 수량 효율은 재식밀도가 낮을수록 증가하는 경향이 있었 고, 과중과 가용성고형물 함량은 목표 착과수준이 낮을수록 증가하는 경향이 있었다. 착색은 신초생장이 감소할수록 증 가하는 경향이 있었다. 해거리는 238주과 260주 재식구의 주당 과실수가 각각 85-94과, 75-84과 이상이 되면 발생하였 다. 그러나 190주 재식구는 주당 95-104과 정도 되어도 해거 리가 발생하지 않았다. 누적 생산량은 재식밀도 및 목표 착 과수준이 높을수록 많아지는 경향이 있었으나, 해거리가 발 생한 착과구들 간의 차이는 없었다. 결론적으로 190주로 재 식된 ‘후지’/M.9 사과나무의 성목기 적정 결실량은 95-104 개, 238주 재식구는 75-84개, 260주 재식구는 65-74개 범위 가 적당할 것이라고 판단되었다.
추가 주요어 : 누적생산량, 착색, Malus domestica Borkh., 신초생장, 수량 효율