ORIGINAL ARTICLE
Contribution of Non-Point Pollution to Water Quality and Runoff Characteristics from Agricultural Area of the Upstream Watersheds of Lake Chinyang
Chun-Sik Lee, Seong-Ho Jang1)*
Department of Environmental Engineering Gyeongnam National University of Science and Technology , Gyeongnam 660-758, Korea
1)Department of Bioenviromental Energy, Pusan National University, Miryang 627-706, Korea
Abstract
In this study, non-point source(NPS) contribution was investigated based on flow rates and water qualities of streams into the lake during rainfall events. Event mean concentration(EMC) and the pollution loads were calculated to establish a database for NPS control measurement in the survey area, and so on. The runoff characteristics of NPS were investigated and estimated on the basis of the ratio of an agricultural to forest area in the stream of sub-catch basin during rainfall events. Non-point source pollution loads were also calculated to establish a database for NPS control measure in the upstream lake Chinyang. At a rainfall event, BOD concentrations rise sharply at the early peak time of runoff, however, peaks of TSS concentration were observed at the similar time of peak flow. This was a phenomenon shown at the watersheds caused by forest and geological types. The discharged EMC range was 2.9-4.8 mg/L in terms of BOD. The discharged EMC range was 6.2-8.2 mg/L in terms of SS. The discharged EMCs of T-N and T-P were 1.4-2.5 mg/L and 0.059-0.233 mg/L, respectively. Total BOD loading rate through the 3 tributaries to the lake Chinyang was 1,136 kg/d during dry weather. The upper watershed area of the Nam-river dam in this study was divided into 14 catchment basins based on the Korean guideline for total maximum daily load(TMDL) of water quality pollutants. The higher the agricultural land-use ratio, the more NPS loading rate discharged, but the more occupied a forest area, the lower more NPS loading rate discharged. In an agricultural land-use area more than 20%, the increase of NPS loadings might be dramatically diffused by increasing the integrated complex-use like vinyl-house facilities and fertilizer use etc. according to the effective land-use utilization. The NPS loading rates were BOD 0.3 kg/ha․day, SS 0.21 kg/ha․day, TN 0.02 kg/ha․day, TP 0.005 kg/ha․day under less than 10% agricultural land-use. In agricultural land-use of 20%-50%, these values were investigated in the range of 0.32 kg/ha․day-0.73 kg/ha․day for BOD, 0.92 kg/ha․day-3.32 kg/ha․day for SS, 0.70 kg/ha․day-0.90 kg/ha․day TN, 0.03 kg/ha․day-0.044 kg/ha․day for TP.
Key words : Non-point source(NPS), Event mean concentration(EMC), Loading, Discharge, Pollution, Runoff
1. Introduction1)
Control of non-point source(NPS) is a recent issue for water quality management of water resources especially in artificial reservoirs such as big multipurpose
dam in Korea. Lake Chinyang is a representative artificial reservoir which is a major water supply source in west side of Geongnam province, south-eastern part of Korean peninsula. Land use of the upstream watershed is mainly for agriculture and
Received 13 December, 2012; Revised 6 February, 2013;
Accepted 19 March, 2013
*Corresponding author : Seong-Ho Jang, Department of Bioenviron- mental Energy, Pusan National University, Miryang 627-706, Korea Phone: +82-55-350-5435
E-mail: [email protected]
ⓒ The Korean Environmental Sciences Society. All rights reserved.
This is an Open-Access article distributed under the terms of the Creative Commons Attribution Non-Commercial License (http://
creativecommons.org/licenses/by-nc/3.0) which permits unrestricted non-commercial use, distribution, and reproduction in any medium, provided the original work is properly cited.
forest. Lots of researchers reported that eutrophication in lake and dam was caused mainly by non-point source of agricultural and forest areas as well as point source like livestock. The runoff characteristics of NPS pollution load is quite complex in rural area, since the land use is diverse like farming, ranching, and other animal production systems(Loehr, 1974).
Organic and inorganic pollutants are discharged even from the forest area. Thus, an understanding of the runoff characteristics of pollutants from a given watersheds is necessary for appropriate control measure to assist policy strategies and water resource managements(Gentry et al., 2007). In most agricultural watersheds, phosphorus transport mainly occurred in surface runoff and soil erosion(Kim et al., 2006), while nitrogen transport pathways are considered to be different from those of phosphorus. In this study, NPS contribution was investigated based on flow rates and water qualities of streams into the lake during rainfall event. Event mean concentration (EMC) and the pollution loads were calculated to establish database for NPS control measure in the survey area, and so on, the runoff characteristics of NPS was investigated and estimated based on the ratio of an agricultural to forest area in the stream of sub-catch basin during rainfall event. Non-point source pollution loads were calculated to establish database for NPS control measure in the survey area.
And then those data obtained in this study will finally use for water quality improvement of water resources of upstream watersheds of lake Chinyang.
2. Materials and Methods
Runoff samples were manually collected at the 3 selected sites which located at the end of three major streams(Gyeongho, Yangcheon and Dukcheon) of the catch basin. Sampling was carried out on short interval time during the first flush rainfall. Flow rate was continuously measured by flow meter at the
sampling site. The upper watershed area of Nam-river dam in this study was divided into 14 catchment basins based on the Korean guideline for TMDL of water quality pollutants. Most of these areas are underlain by agricultural and forested area.
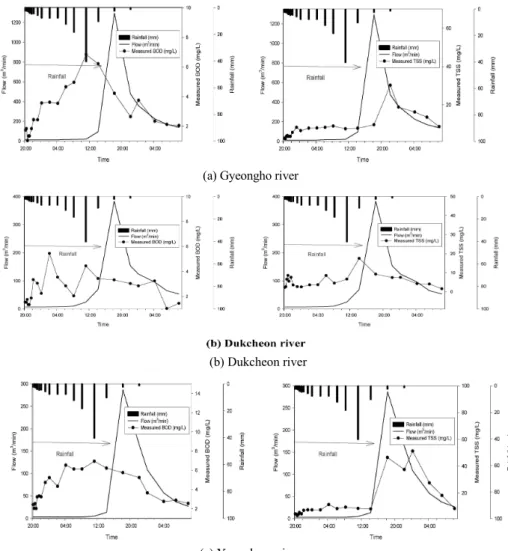
These areas were classified into agriculture and forest areas by the land use pattern(see Fig. 2). And the ratio of agriculture area occupied at sub catchment area divided into less than 10%, 20%, 30%, 40% and 50%, then the characteristics of runoff was investigated and estimated from this area.
The evaluation for NPS loading rate by runoff for rainfall used the values of flow rate and pollutant concentrations for the streams of the surveyed catch basin area. Flow rate was measured by flow meter at a monitoring site. Stream water sampled at the same site under wet and dry weather. Water quality parameters for analysis were BOD, SS, total nitrogen(TN) and total phosphorus(TP), and were determined by procedures described in the Korean Standard Methods.
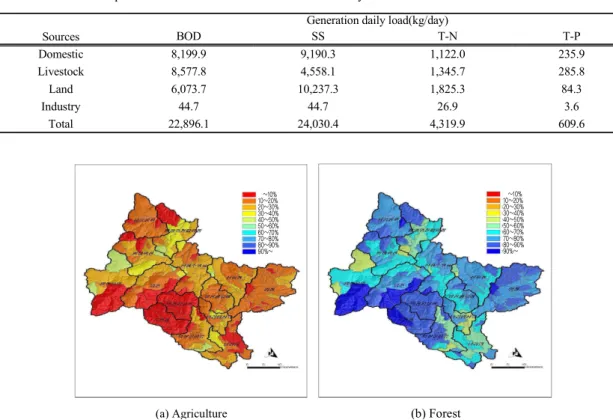
The survey was conducted at dawn stream of three major tributaries flowing into the lake Chinyang as shown in Fig. 1. Land use status was summarized for the upstream of the lake in Table 1. The upstream watershed has drainage area of 2,285 km2 and consists of mainly forest and agricultural purpose area. Average precipitation in the upper watershed is 1400 mmyr-1. As shown in Table 2, generation of pollution from land is significant such as 26% of the total BOD load, more than 40% of the SS and TN load. Although TP load is relatively low compared to point sources it is still considerable as a NPS.
The upstream watershed of lake Chinyang which was used to multi- purpose water resource like drinking, industrial and agricultural water has drainage area of 2,285 km2, length of waterway 185.6 km, average river width 18.5km and shape factor 0.1 and three main tributaries with 145 branch streams. The Nam river waterway is through two province and reach
Fig. 1. Map of survey sites (Sub-basin area at the upper watershed of the lake Chinyang).
Land use Total Dry field Residence Forest Farm Others
Area(km2) 2,285 95.81 30.45 1,728.15 9.72 183.39
Percent(%) 100 4.19 1.33 75.64 0.43 8.02
Table 1. Land use constitution of the upstream watershed of the lake Chinyang
Sources
Generation daily load(kg/day)
BOD SS T-N T-P
Domestic 8,199.9 9,190.3 1,122.0 235.9
Livestock 8,577.8 4,558.1 1,345.7 285.8
Land 6,073.7 10,237.3 1,825.3 84.3
Industry 44.7 44.7 26.9 3.6
Total 22,896.1 24,030.4 4,319.9 609.6
Table 2. Generation of pollution load from various sources in the survey area
(a) Agriculture
(b) Forest
Fig. 2. Ratio of agricultural and forest areas at 14 sub-catchment basin of the upstream watershed in lake Chinyang.
~10%
10~20%
20~30%
30~40%
40~50%
50~60%
60~70%
70~80%
80~90%
90%~
~10%
10~20%
20~30%
30~40%
40~50%
50~60%
60~70%
70~80%
80~90%
90%~
(a) Gyeongho river
(b) Dukcheon river
(c) Yangcheon river
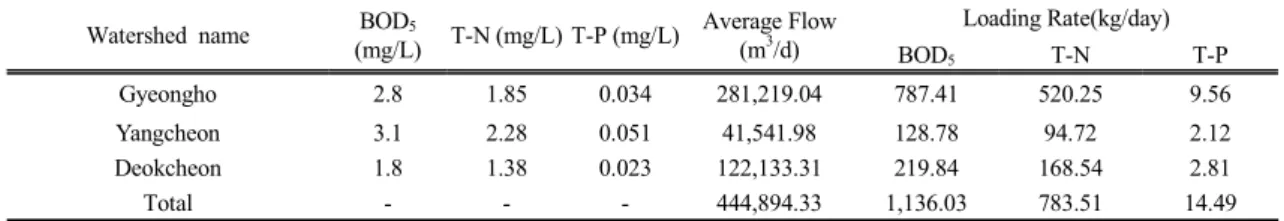
Fig. 3. Precipitation, flow rate and BOD & TSS at the survey sites during rainfall event.
of the Nakdong River. And the upstream watershed is underlain by agricultural and forested area about over 97% and begins at two (Jiri and Dukyu) mountains that are Korea national park. In the climate of this area, there is a strong seasonal cycle with virtually about over 60% of the annual rain precipitation occurring monsoon season (summer) between June and August. Average precipitation in the upper watershed is 1,400 mm/yr.
3. Results and Discussion
3.1. Hydro-pollutograph to rainfall event at the survey areas
Fig. 3 shows the precipitation, flow rate, and BOD & TSS in storm surface runoff for a typical rainfall event. Water quality of the three rivers was compared for rainfall and dry period to determine the effect of non-point pollution load by rainfall. As shown in the figure, the hydrograph during rainfall
Watershed name BOD5
(mg/L) T-N (mg/L) T-P (mg/L) Average Flow (m3/d)
Loading Rate(kg/day)
BOD5 T-N T-P
Gyeongho 2.8 1.85 0.034 281,219.04 787.41 520.25 9.56
Yangcheon 3.1 2.28 0.051 41,541.98 128.78 94.72 2.12
Deokcheon 1.8 1.38 0.023 122,133.31 219.84 168.54 2.81
Total - - - 444,894.33 1,136.03 783.51 14.49
Table 3. Water quality and loading rates of the three tributaries into the Lake Chinyang during dry weather
River
Flow rate (106㎥/d)
BOD SS T-N T-P
loadings (kg/d)
EMCs (mg/L)
loadings (kg/d)
EMCs (mg/L)
loadings (kg/d)
EMCs (mg/L)
loadings (kg/d)
EMCs (mg/L)
Gyoengho 18.9 66,159 3.5 274,089 14.5 37,805 2.0 2,023 0.107
Yangchen 4.8 23,014 4.8 180,759 37.7 8,630 1.8 408 0.085
Deokcheon 6.8 19,702 2.9 52,311 7.7 10,870 1.6 231 0.034
Table 4. Variation of EMCs and the pollution load at the survey areas during rainfall event has a similar shape in all sites, reflecting the
rainfall intensity distribution and typical runoff types in agricultural and forest areas. In general, the concentrations of pollutants sharply rise at the early peak time of runoff such as BOD in Fig. 3.
However, TSS concentration peaks was observed at the similar time of peak flow. This phenomenon at the watersheds caused by land use and geology types.
3.2. Water quality and loading rates of the three tributaries into the Lake during dry weather Table 3 shows water quality, flow rates and pollutant loading rate in dry weather in the survey sites. A mean concentration of BOD5 for three main rivers was in the range of 1.8 mg/L to 3.1 mg/L. A mean flow rate for the 3 rivers was in the range of 41,542∼281,219 m3/d. BOD loading rate to the lake Chinyang was 787 kg BOD/d, 129 kg BOD/d and 219 kg BOD/d through the 3 rivers, respectively.
The ratio on total BOD loading rate to the lake Chinyang was about 70% by Geongho river, and 19% & 11% by Dukcheon river and Yangcheon river, respectively. The contribution rate of three rivers for TN and TP was similar to the trend of BOD.
3.3. EMCs(Event Mean Concentrations) and the loading rates for rainfall event
Generally the overall runoff quality associated with each rainfall event is expressed as event mean concentration (EMC) which is calculated by integrating the product of runoff rate and concentration of substances. The EMC could be used for determining the mass loading to receiving waters. The definition of the EMC is expressed as following equation.
0
0
( ) ( )
( )
T
T
q t c t dt EMC M
V q t dt
= =
ò ò
Table 4 shows EMCs and the loading rates for storm surface runoff in the survey sites. The discharged EMC range was 2.9 mg/L~4.8 mg/L in terms of BOD. The discharged EMC of SS ranged 7.7 mg/L~37.7 mg/L. The discharged EMCs of T-N and T-P were 1.4 mg/L~2.5 mg/L and 0.059 mg/L~0.233 mg/L, respectively. The highest pollutant concentration was SS. From the analytical results, reduction of TSS from storm runoff could be a viable control to attenuate pollutant loadings to a receiving water body.
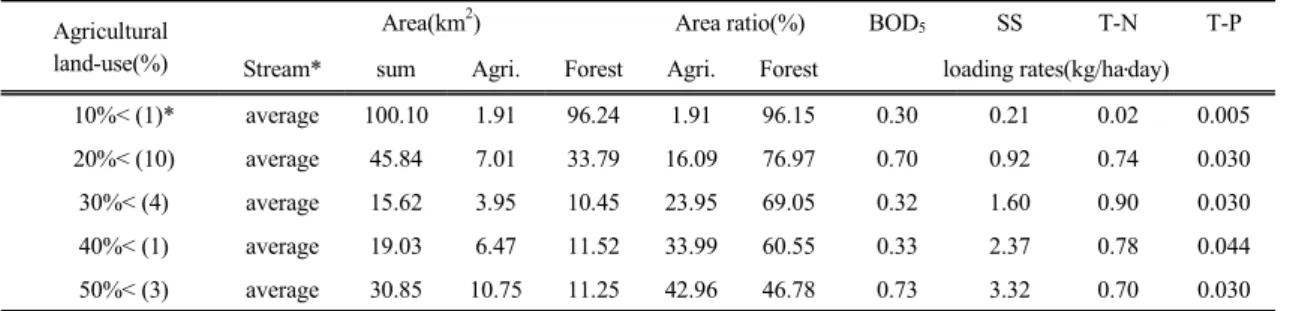
Agricultural land-use(%)
Area(km2) Area ratio(%) BOD5 SS T-N T-P
Stream* sum Agri. Forest Agri. Forest loading rates(kg/ha․day)
10%< (1)* average 100.10 1.91 96.24 1.91 96.15 0.30 0.21 0.02 0.005
20%< (10) average 45.84 7.01 33.79 16.09 76.97 0.70 0.92 0.74 0.030
30%< (4) average 15.62 3.95 10.45 23.95 69.05 0.32 1.60 0.90 0.030
40%< (1) average 19.03 6.47 11.52 33.99 60.55 0.33 2.37 0.78 0.044
50%< (3) average 30.85 10.75 11.25 42.96 46.78 0.73 3.32 0.70 0.030
* Number in parenthesis means the number of the surveyed streams in this study
Table 5. Diffuse pollutant loading rates by an agricultural land-use ratio at the sub-catch area
(a) BOD (b) SS
(c) TN (d) TP Fig. 4. Diffuse pollutant loading rates by an agricultural land-use.
3.4. NPS runoff loadings by the ratio of agricultural land-use at the sub catchment basin
Table 5 shows average runoff pollutant loadings based on agricultural land-used ratio for small stream of sub catch basin area during rainfall event 23.5 mm to 82.1 mm. It clarified to bring similar stream data according to the agricultural land-use ratio. Runoff loadings for BOD from catch basin was not correlated to agricultural land-use, but the
values for nutrients and SS was seem to correlate well according to that ratio.
Fig. 4 shows to summarize average runoff pollutant loadings according agricultural land-use ranking. Runoff loads for TN and TP at other areas except less than 10% an agricultural land-occupy area(that is, forest area) show similar values in the range of 0.7~0.992 kg/ha․d of TN and 0.03~0.0492 kg/ha․d of TP, respectively. These facts might
present that many factors affect the miserly different nutrients(TN and TP) runoff loadings from agricultural operation regardless of increasing the agricultural land occupy ratio. Among those are various types of local agricultural land use and community character, the types of crop, crop rotation, soil on which crop is grown, climate change pattern, farming technologies, and irrigation and drainage etc. Another reason is discharged pollutant loadings from waste piles during rain fall events at feedlots and barnyard which is known as the most intensive animal production. The higher the agricultural land-occupy ratio, the more NPS runoff loading rate discharged, but at forest area occupied over 90%, NPS runoff loading rate extremely discharged low. At an agricultural land-use area more than 20%, the NPS runoff loadings might be dramatically more diffuse than 10% by increasing the integrated complex-use like vinyl-house facilities and fertilizer use etc. The results obtained from the survey for agricultural areas, pollutant loads for BOD, SS, T-N, and T-P below those areas 10% were 0.3 kg/ha․d, 0.21 kg/h a․d, 0.02 kg/ha․d, and 0.005 kg/ha․d, respectively.
In agricultural land-use of 20%-50%, these values were investigated in range of 0.32~0.73 kg/ha․d for BOD, 0.92~3.32 kg/ha․d for SS, 0.70~0.90 kg/ha․d for TN, 0.03~ 0.044 kg/ha․d for TP.
Table 6 compares average pollutant runoff load from agricultural area investigated in this survey with respect to those data from that of Kyung-an watershed reported by Kim et al.(2002) and of Sumjin river watershed reported by Park et al.(2005). From the results, average pollutants runoff loads of this survey were the values of 58.75 kg/
㎢.day for TN, 2.4 kg/㎢.day for TP, 1088.94 kg/
㎢.day for SS, and 44.71 kg/㎢.day for BOD, respectively.
Runoff load for TN of these survey areas was about 18 times lower than that of Kyung-an watershed areas, and then approximately double that of Sumjin
river area. Kyung-an watershed area in which is located nearby Seoul, the capital city of Korea is urban agricultural land-use types, and then Sumjin- river watershed area is mainly occupied rural agricultural land-use, that is almost composed of forest area. It should be noted that the Kyung-an watershed runoff data were representative of urban agricultural watersheds. Runoff loads in that area was strongly affected by the land-development activities around farmland. However TP was not so affected by the land use activity.
BOD SS T-N T-P ref.
44.71 108.94 58.75 2.4 this study
7.6 26.8 1,066.5 4.8 6)
51.02 93.93 25.16 1.05 7)
Table 6. Comparison of runoff NPS pollutant loadings at an agricultural land-use area
Unit : kg/㎢.day
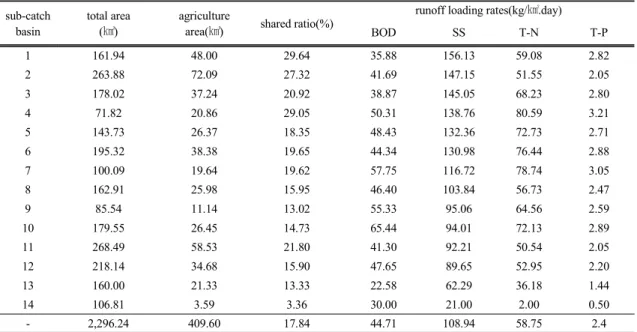
3.5. Pollutant runoff loadings at 14 sub-catchment basins of the upstream watershed of Nam-river Dam
Table 7 shows in order of SS runoff loads according to large amount. As shown in Table 7, there was totally a correlation between that value for SS and the ratio of agricultural land-use to total area, specially into a turbid stream water when it rains.
But there is hardly correlation between their values of BOD, TN and TP and the ratio of that. As mentioned above, there are various different types of local agricultural land use and community character, the types of crop, farming technologies, irrigation and drainage, development, and water source conservation zone etc.. Another reason is discharged pollutant loadings from waste piles during rain fall events at feedlots and barnyard which is known as the most intensive animal production. Therefore the contribution degree of diffuse pollutant loadings to water quality of lake Chinyang was strongly affected
sub-catch basin
total area (㎢)
agriculture
area(㎢) shared ratio(%)
runoff loading rates(kg/㎢.day)
BOD SS T-N T-P
1 161.94 48.00 29.64 35.88 156.13 59.08 2.82
2 263.88 72.09 27.32 41.69 147.15 51.55 2.05
3 178.02 37.24 20.92 38.87 145.05 68.23 2.80
4 71.82 20.86 29.05 50.31 138.76 80.59 3.21
5 143.73 26.37 18.35 48.43 132.36 72.73 2.71
6 195.32 38.38 19.65 44.34 130.98 76.44 2.88
7 100.09 19.64 19.62 57.75 116.72 78.74 3.05
8 162.91 25.98 15.95 46.40 103.84 56.73 2.47
9 85.54 11.14 13.02 55.33 95.06 64.56 2.59
10 179.55 26.45 14.73 65.44 94.01 72.13 2.89
11 268.49 58.53 21.80 41.30 92.21 50.54 2.05
12 218.14 34.68 15.90 47.65 89.65 52.95 2.20
13 160.00 21.33 13.33 22.58 62.29 36.18 1.44
14 106.81 3.59 3.36 30.00 21.00 2.00 0.50
- 2,296.24 409.60 17.84 44.71 108.94 58.75 2.4
Table 7. The diffuse pollutant loadings of agricultural area runoff at 14 sub catchment basin in this survey(see Fig. 1)
by land-use activity character and use types such as intensive livestock, vinyl-house facilities. To be effective in controlling runoff pollutant loads from agriculture, therefore, it is important to understand the local characters and issues for the environments and control options of agricultural production on both public and individual types of land. So the diffuse pollutants were firstly controlled from agriculture land to improve water quality of the upper watershed water body of lake Chinyang.
4. Conclusions
1) At a rainfall event, BOD concentrations rise sharply at the early peak time of runoff, however peaks of TSS concentration was observed at the similar time of peak flow. This was a phenomenon shown at the watersheds caused by forest and geological types. The discharged EMC range was 2.9-4.8 mg/L in terms of BOD. The discharged EMC range was 6.2-8.2 mg/L in terms of SS. The discharged EMCs of T-N and T-P were 1.4-2.5
mg/L and 0.059-0.233 mg/L, respectively.
2) Total BOD loading rate through the 3 tributaries to the lake Chinyang was 1,136 kg/d during dry weather. However it increased to 108,875 kg/d by rainfall which is 95 times greater than that of dry period. Similarly TN and TP load were increased by the NPS to 73 times and 184 times, respectively.
3) The higher the agricultural land-use ratio, the more NPS loading rate discharged, but the more occupied a forest area, the lower more NPS loading rate discharged.
4) At an agricultural land-use area more than 20%, the increase of NPS loadings might be dramatically diffused by increasing the integrated complex-use like vinyl-house facilities and fertilizer use etc. according to the effective land-use utilization.
The NPS loading rates were BOD 0.3 kg/ha․day, SS 0.21 kg/ha․day, TN 0.02 kg/ha․day, TP 0.005 kg/ha․
day under less than 10% agricultural land-use, respectively. In agricultural land-use of 20%-50%,
these values were investigated in range of 0.32 kg/ha․
day-0.73 kg/ha․day for BOD, 0.92 kg/ha․day-3.32 kg/ha․day for SS, 0.70 kg/ha․day-0.90 kg/ha․day TN, 0.03 kg/ha․day-0.044 kg/ha․day for TP.
5) The contribution ratio of diffuse pollutant loadings to Nam-river Dam was strongly affected by land-use activity such as intensive livestock, vinyl- house facilities. So the diffuse pollutants were firstly controlled from agriculture land to improve water quality of the upper watershed water body of lake Chinyang.
Acknowledgement
This work was supported by Science and Technology Grant of Gyeongnam National University.
References
Gentry, L. E., David, M. B., Royer, T. V., Mitchell, A., Starks, K. M., 2007, Phosphorus transport pathways to streams in tile-drained agricultural watersheds, J. Environ. Qual., 36, 408-415.
Kim, J. S., Oh, Y. S., Oh, Y. K., 2006, Nutrient runoff from a Korean rice paddy watershed during multiple storm events in the growing season, J. Hydrol., 327(1-2), 128-139
Kim, S. S., 2002, NPS loadings discharged by land-use at Kyungan stream, NIER, Korea.
Loehr, R. C., 1974, Characteristics and comparative magnitude of non-point sources, Journal of Water poll. Control Fed., 46(8), 1849-1872
Nak-dong river Committee, 2006, The cause analysis report for excessive Algae propagation at Chingyang Lake.
Nam-river Dam Management Group., 2005~2008, Fundamental Survey Report for Nam-river Dam Watershed Areas, KOWACO.
Park, S. C., 2005, NPS loadings from an Agricultural area in Sumjin River region, NIER, Korea.