ORIGINAL ARTICLE
Infection Properties of Oak Wilt Disease in Bukhansan National Park Adjacent to Metropolitan Areas in Korea
Jin-Woo Choi, Jung-Hun Yeum1)*
Environmental Ecosystem Research Foundation, Seoul 05643, Korea
1)National Wetlands Center, National Institute of Environmental Research, Changnyeong 50303, Korea
Abstract
In this study of the oak wilt disease that has occurred in a large scale in a protected area located near South Korea’s metropolitan region, a detailed analysis has been conducted on the terrain, species and Diameters at Breast Height (DBH) of infected trees to identify the distribution of infection properties in the affected area. Taking into consideration the distribution of oak tree vegetation, a total of 4,640 quadrats in a size of 10 m by 10 m, have been set; and oak tree species, the DBH and infection damage per quadrat have been investigated. Geological properties have been analyzed according to elevation, slope, aspect and micro topography while a weighted value has been given according to the degree of infection in order to calculate an infection index. Through correlation analysis, the infection ratio of seriously-damaged and withered trees and the infection index have been analyzed with regards to the geological properties, tree species and DBH. The analysis shows that the disease tends to affect an area with medium elevation rather than those in the highest or lowest areas and that serious damage has been observed at rugged spots with a steep gradient (more than 30°). Although there has been no distinct tendency with regards to aspect, the infection ratio is relatively high in areas facing the north while the seriously-damaged and withered ratio are high in areas facing the south. In terms of micro topography, more damage has been spotted in valley terrain. Quercus mongolica has sustained more damage than other species. When it comes to the DBH, as seen in previous studies, large trees have suffered severe damage, but the analysis has also revealed conspicuous damage to medium trees with a DBH of 15-20 cm, which had not previously been considered at high risk.
Key words : Protected area, Quercus spp., Geological property, Infection index
1)1. Introduction
An infectious disease can seriously damage the forest ecosystem across the globe (Gibbs and Wainhouse, 1986; Loo, 2009). However, since measures to control such infectious diseases are very limited, disease incidence prediction, understanding
of the infection process and a thorough examination of the impact of infectious diseases are of fundamental importance to effective forest management (Oguro et al., 2015). In particular, elements affecting the outbreak of an infectious disease, including the movement pattern of insects and properties of host trees, as well as the impact on
Received 16 March, 2017; Revised 10 July, 2017;
Accepted 11 July, 2017
*Corresponding author: Jung-Hun Yeum, National Wetlands Center, National Institute of Environmental Research, Changnyeong 50303, Korea
Phone : +82-55-530-5533 E-mail : [email protected]
ⓒ The Korean Environmental Sciences Society. All rights reserved.
This is an Open-Access article distributed under the terms of the Creative Commons Attribution Non-Commercial License (http://
creativecommons.org/licenses/by-nc/3.0) which permits unrestricted non-commercial use, distribution, and reproduction in any medium, provided the original work is properly cited.
the surrounding environment are crucial elements for consideration (Yamasaki and Sakimoto, 2009; Park et al., 2013). Thus far, there has been only limited analytical research regarding the scenery structure of the environment where infectious diseases develop (Meentemeyer et al., 2012).
The infectious oak wilt disease, caused by the vascular disorder from a pathogenic fungus (Kuroda and Yamada, 1996), was first identified in 1944 in the United States (Henry et al., 1944), and it was recognized that oak wilt disease was widespread in the 1950s (Henry et al., 1944), In Japan, there was a rapid decline in oak trees after the 1980s and it was reported that Quercus grosseserrata and Quercus serrata were affected by the disease (Kubono and Ito, 2002). In the case of South Korea, there were many infected trees in Ibaejae, Seongnam city in 2004.
Since then, the metropolitan areas have been hit hardest. Starting from 2006, the disease spread to the nation’s central region as well, affecting the entire nation (Kim, 2007). Because oak trees make up about 25% of South Korea’s forests, the disease has taken a heavy toll on the country’s forest vegetation (Korea Forest Research Institute, 2010).
There have been active studies on oak wilt disease in the United States, Japan and South Korea, involving various pathogenic fungi, types of beetles, and kinds of trees infected. Juzwik(2000) said that a total of 33 different species of oak had been infected by the pathogenic fungus Ceratocystis fagacearum. In the United States, research has been done relating vulnerability to infection with species (Menges and Loucks, 1984; Jacobi and MacDonald, 1980), degree of damage and disease symptoms depending on the density of the oak trees (Appel and Maggio, 1984), management methods and review (Koch et al., 2010) and methodology of monitoring areas affected by the oak wilt disease, using Airborne Digital Imagery analysis (Everitt et al., 1999). There has also been research on the pattern of fungus movement by the
bark beetle (Kinuura, 2002; Kubono and Ito, 2002), disease outbreak mechanisms (Kinuura, 2002;
Yamasaki et al., 2014), disease damage (Kuroda and Yamada, 1996; Kuroda, 2001) and scenery structure analysis including such factors as land usage and geological properties in relation to the affected species (Oguro et al., 2015) in Japan. The pathogenic fungus of the oak wilt disease in South Korea is known as Raffaelea quercus-mongolicae (Kim et al., 2009) while the ambrosia beetle involved is the Platypus koryoensis (Park and Lyu, 2007). Previous research on the oak wilt disease primarily examined the ecological properties of the insect vector Platypus koryoensis, including its distribution, behavior and life cycle (Hong et al., 2006); microbiological properties of Raffaelea spp., a symbiotic fungus (Kim, 2007; Park, 2009; Yoo, 2009; Choi, 2010); and the internal and external symptoms and infection properties of the infected trees (Choi et al., 2008). In a study on colony property in areas affected by the oak wilt disease (Um et al., 2009), it was recognized that there was high correlation among the perforation rate and dominance of oak trees and the outbreak of the disease. In addition, research relevant to the environment in which the disease emerges revealed that correlations could be identified between infection damage and geographical features, including gradient and an elevation (Lee et al., 2011) and slope, aspect (Korea Forest Research Institute (KFRI), 2008; 2010); Quercus mongolica was the species that suffered the most severely (KFRI, 2008;
National Park Research Institute (NPRI), 2010; Lee et al., 2011); and large trees were found to have suffered heavy damage. With regards to a way to predict damage, NPRI(2010) established a map predicting damage distribution, using multi-variable analysis based on the GIS.
In the studies conducted thus far, there has been extensive research on the source of infection, the life cycle of the ambrosia beetle, disease outbreak
mechanisms and damage properties; however, research on the spatial characteristics of disease incidence regarding the regions afflicted by the oak wilt disease and on the properties of the trees infected has been limited. In most cases, survey areas were confined to forests distant from cities, where oak is the dominant species. Little research was conducted on forests located near cities where there was serious damage. Above all, it is essential to identify the infection pattern from a spatial perspective since conventional methods of disease or pest control cannot be used in forests located in national parks, which have policies aimed at the conservation of biodiversity.
Thus, this study focuses on Bukhansan National Park, a protected area located adjacent to metropolitan areas in South Korea; and thorough analysis has been done on infection properties such as terrain, the species of trees infected and DBH, in order to identify methodology for reasonable management of an area affected by oak wilt disease.
2. Materials and Methods 2.1. Survey area
One of the main mountain ranges of South Korea, the Hanbukjeong Range, includes Mt. Bukhansan located in the central region of the Korean Peninsula (E 126° 58'40 , N 37° 39'31 ). This mountain is home to Insubong Peak (810 m), Mangyeongdae Terrace (799 m), Jaunbong Peak (740 m) and Sapaesan mountain (552 m) including the highest peak, Baekundae Peak (836 m). The area was designated as a national park in 1983. It is a primary example of a national park located adjacent to metropolitan areas, in this case including the extensive Seoul metropolitan area, as well as the smaller cities of Uijeongbu, Goyang and Yangju.
Bukhansan National Park is divided into eight different management districts, the Jeongneung,
Suyu, Ui, Dobong, Sanseong, Gugi, Wondobong and Songchu districts. The scope of the survey area for the study is 79.79 including a region that was lifted due to the adjustment of the park boundaries in 2011 (Fig. 1). More than 50% of the oak trees located in Bukhansan National Park were found to be thriving (Yeum et al., 2013), and in 2008 the inhabitation of the area by Platypus koryoensis, also known as the ambrosia beetle of the oak wilt disease, was observed through a study made by Lee et al.
(2008).
Key map
Fig. 1. Location map of Bukhansan National Park.
2.2. Methodology of research analysis
2.2.1. Research on infected trees and analysis of infection index
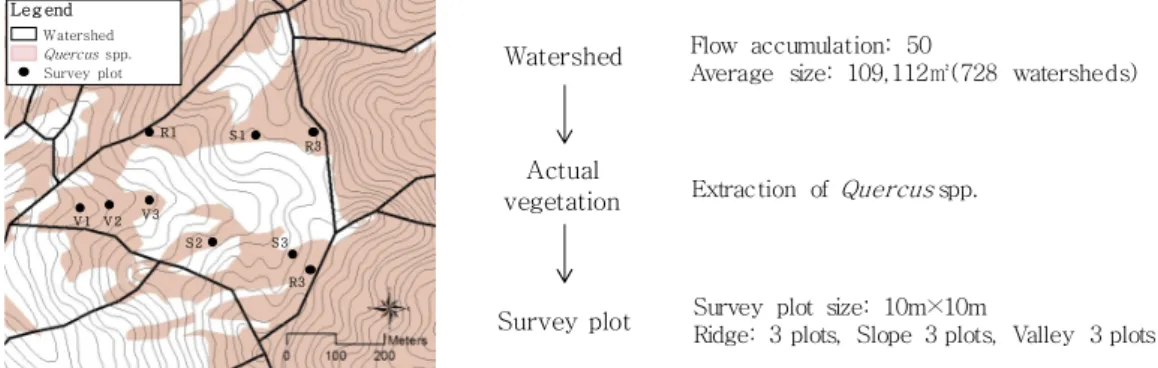
Since the infected trees are distributed widely throughout the survey area, the distribution boundary of the actual vegetation, in the form of a polygon, has been set as a basic unit for analysis. The Natural Ecological Map created in 1/5,000 scale to manage the national parks (with a minimum block size of 50 m x 50 m) has been used as the source for the actual vegetation data. The core survey area has been selected by locating actual vegetation data indicating oak colonies on the Natural Ecological Map, and then site research has been conducted. In cases where
Watershed Flow accumulation: 50
Average size: 109,112㎡(728 watersheds)
Watershed Quercusspp.
Survey plot Leg end
V 1
Survey plot size: 10m×10m
Ridge: 3 plots, Slope 3 plots, Valley 3 plots Actual
vegetation
Survey plot
Extraction of Quercusspp.
V 2 V 3 R1
R3
R3 S 1
S 2 S 3
Fig. 2. Method of setting up the survey plots in watershed.
other oaks were located adjacent to the polygons identified through site research based on the actual vegetation extraction, the distribution area of those oak trees has been added to the polygon. In cases where entire oak colonies in valley were omitted, they have been included. Such omissions may have occurred owing to some polygons, such as pine tree colonies, being largely divided along ridge lines. The final survey map has been digitized, using Autocad Map 2004 and drawn on ArcGIS 10.0. A basin zone which is normally used in traditional ecosystems has been used as a plan unit incorporating the actual vegetation data (Berkes et al., 1998), and the concept of the basin zone was applied as a basic unit for ecological management in some preceding research (Seo and Park, 2000). The basin zone refers to a range of rivers that create precipitation from a watershed. The methods of Horton(1945) and Strahler(1952) have been used to distinguish the water system, and analysis has been done, using the Hydrology Tool in the ArcMap 10.0 program after converting the contours in the digital map (1/5,000) into DEM (Digital Elevation Method). As for the appropriate size of the basin zone, the catchment discharge of Grid 50 has been selected, taking into consideration the survey area’s geological conditions and the state of disease outbreak after extending and analyzing the catchment discharge into Grid 50, 100,
300 and 500 out of Flow Accumulation while conducting a preliminary study on the Soguicheon Valley in the Ui district.
The study on infected trees was conducted from November 4 to December 5 in 2011, with 4,640 quadrats (10 m x 10 m) set for the mapped oak polygons. It was set up as a three-part repetitive study on ridges, slopes and valleys, considering the geological features on the digital map (1/5,000) in the watershed (Fig. 2). The number of quadrats was determined as 4,640 taking into consideration the areas where oak tree vegetation is distributed.
Research was done on the individual oak trees distributed in each quadrat, categorizing them according to tree species, DBH and degree of infection. Due to research limitations, research on the DBH in the Ui and Suyu districts has been excluded.
Degrees of infection on oak wilt disease specified in manuals produced by KFRI(2010) were used as standards to distinguish infected trees. Taking into account the duration of the survey from October to November, in order to readily identify the degree of damage at the site based on easily observed factors such as the level of perforation and the range of wooden power distributed on the ground, the degrees of infection were classified in four categories as follows: minor damage with some perforation spotted; medium damage with some sawdust shed or
10 to 50% of frass on the ground; serious damage with perforation deeper than a man’s height or more than 50% of frass; and withered if the trees showed signs of an almost withered state even though they may include new sprouts.
The infection degree has been analyzed in accordance with the infection ratio, seriously -damaged and withered ratios and an infection index of the oak trees in each quadrat, while the infection index is to produce an aggregate figure for the quadrat in consideration of each individual tree’s damage level. The index can be calculated after giving a weighted value to each damage grade. The damage grades should be adjusted to a significant value through the quantification of damage degree identified at each infection stage. In this study, a weighted value has been set for minor (0.25), medium (0.50), serious damage (0.75) and withered trees (1) as the way to generally used to reflect the importance with increments of equal value (Cheng, 2002).
Infection index 〓
No. of oak trees in quadrat per damage degree × weighed value No. of oak trees in quadrat
2.2.2. Analysis of geological features
The geological features that were analyzed included the altitude above sea level, slope, aspect and micro topography. The 3D Analyst Tool and the Spatial Analyst Tool of the ArcGIS 10.0 program have been used. The DEM (Digital Elevation Model) has been analyzed after exporting the contour data from the digital map (1/25,000). The altitude has been divided into eight sections at intervals of 100 m.
As for a slope, division standards applied in the research by Cantón et al.(2004) to survey spots including mountain ranges have been reset and used.
The slopes can be divided into flat spots (0~5°), gently-inclined spots (0~15°), inclined spots (15~20°),
steeply-inclined slopes (20~30°), rugged spots (30~45°) and absolutely-rugged spots (45° or higher).
Excluding flat spots, the direction has been divided into eight sections (Yeon et al., 2006). As for the classifications of micro topography used in the survey, each area of terrain has been distinguished as a ridge, a slope or a valley.
2.2.3. Analysis of infection properties
The infection properties have been analyzed depending on topography, tree species and DBH. In terms of topography, the damage degree has been identified according to the seriously damaged ratio, withered ratio and infection index and analyzed in accordance with elevation, slope, aspect and micro topography. The infection degree has been also compared among Quercus acutissima, Quercus aliena, Quercus dentata, Quercus mongolica, Quercus serrata and Quercus variabilis. A graph has been created to analyze the infection degree of oak trees of different sizes, categorized according to the DBH at intervals of 5 cm.
3. Results
3.1. Study of infected trees and analysis of infection index
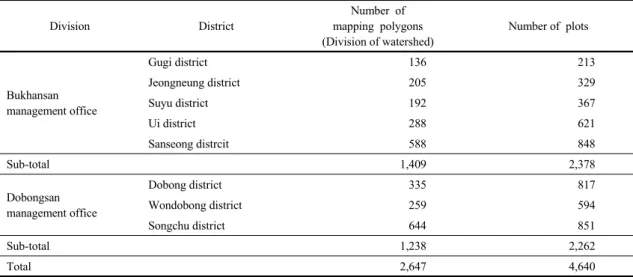
The number of mapping polygons for oak trees divided by the watershed stands at 2,674. By district, the Songchu and Sanseong districts with the large land areas have the largest number of polygons with 644 and 588 respectively, followed by Dobong (335), Ui (288), Wondobong (259), Jeongneung (205), Suyu (192) and Gugi (136). The entire number of quadrats set for the mapping polygons is 4,640 out of which Songchu has 851, Sanseong 848, Dobong 817, Ui 621, Wondobong 594, Jeongneung 329, Suyu 367 and Gugi 213 (Table 1).
Given the average and standard deviation values for the survey plots in Bukhansan National Park (Table 2), the average number of infected trees for all
Division District
Number of mapping polygons (Division of watershed)
Number of plots
Bukhansan management office
Gugi district 136 213
Jeongneung district 205 329
Suyu district 192 367
Ui district 288 621
Sanseong distrcit 588 848
Sub-total 1,409 2,378
Dobongsan management office
Dobong district 335 817
Wondobong district 259 594
Songchu district 644 851
Sub-total 1,238 2,262
Total 2,647 4,640
Table 1. Number of mapping polygons and survey plot according to the district in Bukhansan National Park
Plot Number of infected individual
Seriously damaged ratio(%) + withered ratio(%)
Infection ratio(%)
Infection index Average±
standard deviation
4.8±2.1 14.4±23.8 60.1±38.4 0.27±0.2
Table 2. Infection analysis based on survey plots of Bukhansan National Park the quadrats in the entire survey stands at 4.8 with a
standard deviation of ±2.1. The seriously-damaged ratio and withered ratio of infected trees amount to 14.4% on average with a standard deviation of ±23.8.
The infection ratio reaches 60.1% with a standard deviation of ±38.4. The average infection index per quadrat after giving a weighted value depending on damage degree is 0.27 with a standard deviation of
±0.2.
3.2. Analysis of geological features
The results of analysis in Bukhansan National Park of the geological properties of elevation, slope and aspect can be seen below in Fig. 3. The spots with an elevation of 100 to 200 m (25.5%) and 200 to 300 m (22.7%) comprise the highest proportion of the survey area. Spots including mainly rocky peaks such as Baekundae peak (836 m), Jaun peak (740 m) and
Insu peak (810 m) with an elevation of 500 m or higher make up only 8.7% of the total area, while low-lying forests with an elevation of 100 m or lower are distributed on the outskirts of the forests. In terms of a gradient, gently-inclined spots (5~15°) including valleys and low-lying spots outside the forests take up the largest share with 34.9%, followed by steeply-inclined spots (20~30°) with 28.2% and inclined spots (15~20°) with 24.6%. The analysis of aspect shows that the eastern direction segment accounts for the largest proportion of the survey area with 16.3%, while spots generally facing the south (32.7%) are slightly less numerous than those facing the north which have the little sunlight (35.6%).
The findings from the analysis of the number of trees infected by the oak wilt disease and their DBH by species at Bukhansan National Park are as follows
Fig. 3. Topology analysis of Bukhansan National Park.
Fig. 4. Number of individuals according to species and DBH of infected trees in Bukhansan National Park.
in Fig. 4. A total of six species have been analyzed including Quercus mongolica with the largest number of trees as 16,364, followed by Quercus serrata, Quercus variabilis, Quercus acutissima, Quercus aliena and Quercus dentata. Yeum et al.(2013) maintained that the analysis of the actual vegetation at Bukhansan National Park showed that Quercus mongolica (44.3%) came in the first in terms of its population, followed by Quercus serrata (5.1%), Quercus variabilis (2.3%) and Quercus acutissima (1.8%), and there was an insignificant number of Quercus aliena. But, there is a gap in the population of individual trees per species surveyed depending on differences in the quantitative area of distributed vegetation. When it comes to the DBH, the number of oaks trees with the DBH of 20 to 25 cm reaches the largest number of 2,449. There are 2,254 trees with the DBH of 15 to 20 cm and 1,580 trees with 25 to 30 cm. The number of large trees with the DBH of 30 cm or larger stands at 1,260.
4. Discussion
4.1. Infection degree depending on topography Analyzing the effect of the geological properties at Mt. Bukhansan, the correspondence between infection degree and elevation (5) yields the highest infection at an elevation of 400 to 500 m. The infection rate of spots at 200 m to 600 m is higher than lower or higher spots. When it comes to the seriously-damaged and withered ratios, more damage is inflicted on low-lying spots than areas higher than 600 m. Considering weighted infection damage, the elevation range from 300 m to 500 m tops the list with an infection index of 0.32. Analysis by the Korea Forest Research Institute (KFRI)(2010) also concluded that more trees were infected by the disease at 250 m to 400 m rather than low-lying forests with elevations of less than 200 m. KFRI also reported that at an elevation of 350 m which is point of 6 out of 10 on a ridge had relatively many
Fig. 5. Relationship graph between elevation and infection degree.
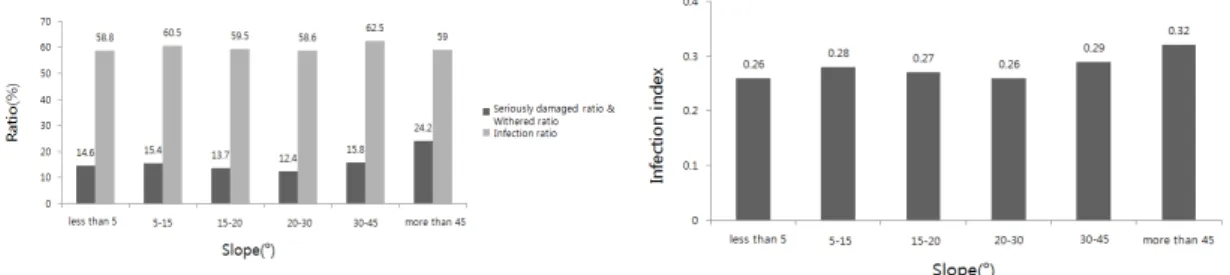
Fig. 6. Relationship graph between slope and infection degree.
withered trees. A similar result has also been echoed in this study, in which the elevation of 480 m, which can be considered point of 6 out of ten on a ridge shows a high infection ratio and index. According to the research by Oguro et al.(2015), at a forest with the maximum elevation of 600 m, although there is an altitude gap of 2° with the survey area, the elevation has a big impact on trees’ being withered.
In fact, their analysis showed that the withered ratio was high at 200 to 500 m for Quercus grosseserrata and Quercus serrata. Based on this, indications are that the disease tends to prefer the mid-level elevation rather than very high or very low spots.
Looking at another geological property, the gradient, analysis of the infection degree according to gradient (Fig. 6) shows that the infection ratio ranges from 58.6 to 62.5% with the highest for rugged spots (30~45°) at 62.5% and the lowest for the steeply-inclined (20~30°) at 58.6%. The seriously- damaged and withered ratios range from 12.4% to
24.2% with the highest for absolutely-rugged spots (more than 45°) as 24.2% and the lowest for the steeply-inclined (20~30°) as 12.4%. The infection index is somewhere between 0.26 and 0.32 with the highest for absolutely-rugged spots (more than 45°) and the lowest for the steeply-inclined (20~30°) at 0.26. Overall, rugged spots including the absolutely -rugged (more than 30°) tend to sustain the most serious damage. Kim et al.(2010) said that the gradient could affect the density of damage inflicted by beetles, and the KFRI(2008; 2010) maintained that the outbreak of the oak wilt disease was high from steeply-inclined spots to absolutely-rugged spots based on the their findings regarding the relationship between gradient and infection damage.
Lee et al.(2011) also said that the infection damage was related to gradient although there should be more definitive research in the future, and went on to say that trees located in steeply-inclined spots had high probability of infection since poor supply of water to
12.2 14.0 17.7 17.9 15.1 14.6 12.6 9.7
62.2 64.5 63.7 63.4
56.5 60.1
52.1 55.0
0 10 20 30 40 50 60 70
북 북동 동 남동 남 남서 서 북서
심피해 및 고사율(%) 감염율(%) Seriously damaged ratio &
Withered ratio Infection ratio
North North-East East South-East South South-West West North-West
Aspect
Ratio(%)
Fig. 7. Relationship graph between aspect and infection degree.
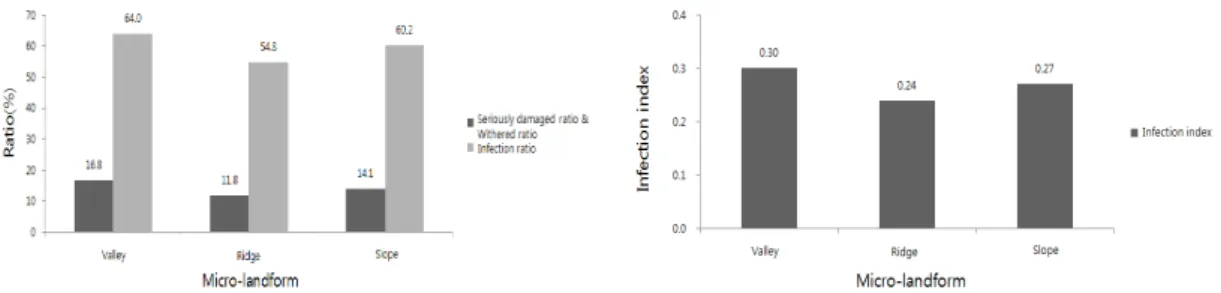
Fig. 8. Relationship graph between micro-topography and infection degree.
trees in those spots could affect their vitality.
The findings from the analysis of infection degree according to aspect, another geological property (Fig.
7), show that the infection ratio, which ranges from 52.1% to 64.5% per spot, is the highest for the northeast (64.5%) and the lowest for the west (52.1%). The seriously-damaged and withered ratios range from 9.7% to 17.9% with the highest for the southeast (17.9%) and the lowest for the northwest (9.7%). The infection ratio is recorded at from 0.23 to 0.31 with the highest for the southeast (0.31) and the lowest for the west (0.23). The analysis indicates that the seriously-damaged and withered ratios and the infection index, which applies a weighted value according to degree of damage, are high in sunny areas facing the south whereas the infection ratio tends to be high in cold spots facing the north. Korea National Park Service (NPRI, 2010) predicted that the disease would develop from the northern or northeastern slopes.
The results from the analysis of infection degree depending on the final geographical property, micro topography (Fig. 8), show that the infection ratio ranges from 54.8 to 64.0. The seriously-damaged and withered ratios are somewhere between 11.8% and 16.8% while the infection index has a range of 0.24 to 0.30. The infection ratio, seriously-damaged and withered ratios and the infection index are all high in valley areas while there is relatively little damage in areas on a slope. KFRI(2008) said that the disease normally occurred on slopes along with ridges. But in this study, the incidence ratio and degree of the oak wilt disease are higher in wet valley areas than on ridge or slope areas.
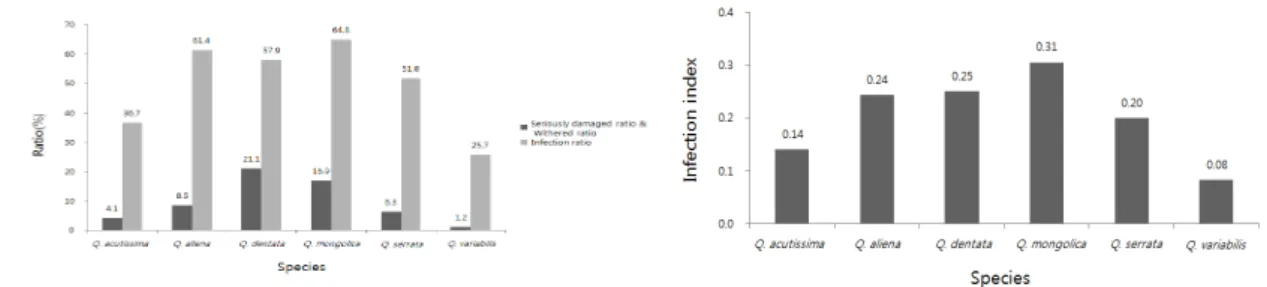
4.2. Infection degree depending on species and DBH The analysis of infection degree of the oak wilt disease at Mt. Bukhansan (Fig. 9) shows that the infection ratio depending on species ranges from 25.7% to 64.8%. Quercus mongolica has the highest
Fig. 9. Relationship graph between species and infection degree.
Fig. 10. Relationship graph between DBH and infection degree.
infection ratio as 64.8% while Quercus variabilis has the lowest as 25.7%. The seriously-damaged and withered ratios stand at from 1.2% to 21.1% with the highest for Quercus dentata (21.1%) and the lowest for Quercus variabilis (1.2%). The infection index is somewhere between 0.08 and 0.31. Quercus mongolica shows the highest index with 0.31 whereas Quercus dentata has the lowest with 0.08. Menges and Loucks (1984) said that vulnerability to the oak wilt disease varied depending on the kinds of host trees, and Yamada(2008) also mentioned that the degree of damage to oak trees in Japan was different for each species and that the damage to Quercus crispula was especially severe. In this study, the most serious damage has been seen in Quercus mongolica, while damage to Quercus dentata, Quercus aliena and Quercus serrata is also relatively severe. On contrary, little damage has been inflicted on Quercus variabilis and Quercus acutissima. Findings from previous research (KFRI, 2008; KNPS, 2010; Lee et al., 2011)
also indicated that Quercus mongolica has suffered the most. Choi(2011) postulated that the effects of global warming on Quercus mongolica--which is adaptable to cold weather had made it vulnerable, contributing to this result.
According to the analysis of the disease’s infection degree depending on the DBH at Bukhansan National Park (Fig. 10), the infection ratio ranges from 24.2%
to 77.4% while the seriously-damaged and withered ratios vary from 1.8% to 37.7% and the infection index from 0.08 to 0.44. The infection ratio, seriously-damaged and withered ratios and infection index all show the most severe damage at the DBH of 35 to 40 cm, while minor damage has been inflicted on small-and-medium sized trees with the DBH of 15 cm or less. Overall, the larger the DBH, the more severe the damage, which is a finding similar to that of KFRI(2010) which said the in the Quercus mongolica with bigger DBH, the infection ratio would go higher. The research of the infection
properties of oaks in Japan also showed that wood borers preferred trees with a larger DBH and large trees had a high withered ratio. (Shore et al., 2000;
Kobayashi and Shibata, 2001; Yamasaki and Futai, 2012). However, Oguro et al.(2015) was careful to point out that the existing research focused only on a small number of quadrats and limited geographical boundaries. Having said that, this study has conducted a detailed analysis of 4,640 quadrats and confirmed the infection ratio and degree tend to go up as a tree’s DBH gets bigger. Nishimura et al.(2005) mentioned that in the analysis of infection trends for Quercus grosseserrata, small trees with less than 10 cm DBH had little damage. This study has also revealed that the degree of damage to oak trees with the DBH of 15 cm or less is markedly low.
5. Conclusion
Many previous studies on the oak wilt disease dealt primarily with the source of infection, the life cycle of the ambrosia beetles, the disease incidence mechanism and damage properties, while there was only a limited amount of research on the disease’s spatial movement pattern and properties of infected trees, information which could yield the data necessary to effectively respond to the disease. In particular, studies on forests adjacent to cities is crucial since the incidence of the disease is observed to be disproportionately high in forestation near South Korea’s metropolitan areas. Now is the time to set reasonable management directions by establishing basic data regarding the progress of the disease in a protected area. To this end, this study has analyzed the correlation among the disease’s infection ratio, seriously-damaged and withered ratios and infection index considering a weighted value based on damage degree per quadrat to identify infection properties according to the geographical elements of Bukhansan National Park such as elevation, slope, aspect and
micro topography as well as with regards to species and the DBH. The analysis shows that the disease prefers mid-level elevation rather than overly high or low spots; serious damage has been observed at rugged spots whose gradient is higher than 30°; the infection ratio tends to be slightly higher at spots facing the north while the seriously damaged and withered ratios are high at spots facing the south, which requires more detailed research down the road;
severe damage has been spotted in wet valley areas;
Quercus mongolica has sustained the most serious damage, matching results seen in previous studies;
and severe damage has been inflicted on large trees, which also matches results from the preceding research, though marked observation of damage to medium trees with the DBH of 15 to 20 cm has also been made, which was not previously reported. These findings could be used as basic data to establish management directions for protected forest areas located near metropolitan areas in the future. In particular, given that the location where the oak wilt disease emerges on a large scale is not in isolated forests but a national park with a favorable natural ecosystem and scenery, found in proximity to large metropolitan areas, a factor which can largely alter the environmental conditions due to the degradation imposed by the urban environment, there is a need to create a concept of disease prevention and control for protected areas near cities. To accomplish this, it is indicated that a series of management directions need to be established, including such policies as minimum impact and disturbance on the ecosystem due to pest/disease control and differentiated zoning management taking into consideration the nature of the soil, along with management policies that reinforce the ecosystem’s tolerance, limiting large -scale tree cutting, fumigation and chemical spraying, while minimizing unilateral pest control against insect vectors. Last but not least, for effective safeguard against the oak wilt disease, research
should continue regarding the inflicting pattern of the ambrosia beetle in relation to structural elements in the landscape environment.
REFERENCES
Appel, D. N., Maggio, R. C., 1984, Aerial survey for oak wilt incidences at three locations in central Texas, Plant Dis., 68, 661.
Berkes, F., Kislalioglu, M., Folke, C., Gadgil, M., 1998, Exploring the basic ecological unit: Ecosystem-like concepts in traditional societies, Ecosystems, 1, 409- 415.
Cantón, Y., Barrio, G. D., Solé-Benet, A., Lázaro, R., 2004, Topographic controls on the spatial distribution of ground cover in the Tabernas badlands of SE Spain, Catena, 55, 341-365.
Cheng, J., 2002, Discussion of importance index in technology foresight, Science and Technology Foresight Center, National Inst. of Science and Technology Policy, Tokyo, 1-13.
Choi, E. H., 2010, Comparison in characteristics of Raffaelea species causing oak wilt disease, and analysis efficacy of fungicides injection, Master Thesis, Kangwon National University, Korea.
Choi, W. I., 2011, Influence of global warming on forest coleopteran communities with special reference to ambrosia and bark beetles, J. Asia Pac. Entomol., 14, 227-231.
Choi, W. I., Lee, J. S., Choi, K. S., Kim, J. K., Shin, S. C., 2008, Tree trunk level distribution of entry hole by Platypus koryoensis (Coleoptera: Platypodidae) and its implication to tree damage, Korean J. Appl.
Entomol., 47(2), 127-131.
Everitt, J. H., Escobar, D. E., Appel, D. N., Riggs, W. G., Davis, M. R., 1999, Using airborne digital imagery for detecting oak wilt disease, Plant Dis., 83, 502-505.
Gibbs, J. N., Wainhouse, D., 1986, Spread of forest pests and pathogens in the northern-hemisphere, Forestry, 59, 141-153.
Henry, B. W., Moses, C. S., Richards, C. A., Riker, A. J., 1944, Oak wilt: Its significance, symptoms, and cause, Phytopathology, 34, 636-4547.
Hong, K. J., Kwon, Y. D., Park, S. W., Lyu, D. P., 2006,
Platypus koryoensis (Murayama) (Platypodidae;
Coleoptera), the vector of oak wilt disease, Korean J.
Appl. Entomol., 45(2), 113-117.
Horton, R. E., 1945, Erosional development of streams and their drainage basins-hydrological approach to quantitative morphology, Geol. Soc. of Amer., 56, 275-370.
Jacobi, W. R., MacDonald, W. L., 1980, Colonization of resistant and susceptible oaks by Ceratocystis fagacearum, Phytopathology, 70, 620.
Juzwik, J., 2000, An Oak wilt primer, J. Int. Oak Soc., 11, 14-20.
Kim, H. J., 2007, Cultural characterization and genetic diagnosis of Raffaelea sp. by Polymerase Chain Reaction (PCR) using ITS-specific primer in Korea, Master Thesis, Kangwon National University, Korea.
Kim, K. H., Choi, Y. J., Seo, S. T., Shin, H. D., 2009, Raffaelea quercus-mongolicae sp. nov. associated with Platypus koryoensis on oak in Korea, Mycotaxon., 110, 189-198.
Kinuura, H., 2002, Relative dominance of the mold fungus, Raffaelea sp., in the mycangium and proventriculus in relation to adult stages of the oak platypodid beetle, Platypus quercivorus (Coleoptera:
Platypodidae), J. For. Res., 7, 7-12.
Kobayashi, M., Shibata, S., 2001, Infestation of Platypus querciuorus (Murayama)(Coleoptera: Platypodidae) at a newly damaged forest by the beetle (I):
Investigation in Maizuru Kyoto Prefecture, Appl. For.
Sci., 10, 73-78.
Koch, K. A., Quiram, G. L., Venette, R. C., 2010, A Review of oak wilt management: A Summary of treatment options and their efficacy, Urban For. Urban Gree., 9, 1-8.
Korea Forest Research Institute, 2008, Outbreak status and measure of Oak wilt disease, Korea Forest Research Institute, 1-9.
Korea Forest Research Institute, 2010, Research of occurrence status and control of oak wilt disease, Korea Forest Service, 1-137.
Kubono, T., Ito, S., 2002, Raffaelea quercivora sp. nov.
associated with mass mortality of Japanese oak, and the ambrosia beetle (Platypus quercivorus), Mycoscience, 43, 255-260.
Kuroda, K., 2001, Responses of Quercus sapwood to
infection with the pathogenic fungus of a new wilt disease vectored by the ambrosia beetle Platypus quercivorus, J. Wood Sci., 47, 425-429.
Kuroda, K., Yamada, T., 1996, Discoloration of sapwood and blockage of xylem sap ascent in the trunks of wilting Quercus spp. following attack by Platypus quercivorus, J. Jpn. For. Soc., 78, 84-88.
Lee, C. K., Cho, H. S., Lyu, D. P., 2008, Distribution of forest insect pests in Bukhansan National Park, Korea, Kor. J. Env. Eco., 22, 75-82.
Lee, J. S., Haack, R. A., Choi, W. I., 2011, Attack pattern of Platypus koryoensis (Coleoptera: Curculionidae:
Platypodinae) in relation to crown dieback of Mongolian oak in Korea, Environ. Entomol., 40, 1363 -1369.
Loo, J., 2009, Ecological impacts of non-indigenous invasive fungi as forest pathogens, Biol. Invasions, 11, 81-96.
Meentemeyer, R. K., Haas, S. E., Vaclavik, T., 2012, Landscape epidemiology of emerging infectious diseases in natural and human-altered ecosystems, Annu. Rev. Phytopathol., 50, 379-402.
Menges, E. S., Loucks, O. L., 1984, Modeling of disease-caused patch disturbance: Oak wilt ill tile midwestern United States, Ecology, 65, 488.
National Park Research Institute, 2010, Report of status of oak wilt disease's outbreak and prediction of spread in Bukhansan National Park, Korea National Park Service, 1-67.
Nishimura, M., Mori, Y., Narita, H., 2005, Difference of the number of entry holes bored by Platypus quercivorus according to log size of Quercus crispula killed by mass attacks of the beetles, J. Toyama For.
For. Prod. Res. Center, 18, 1-4.
Oguro, M., Imahiro, S., Saito, S., Nakashizuka, T., 2015, Relative importance of multiple scale factors to oak tree mortality due to Japanese oak wilt disease, Forest Ecol. Manag., 356, 173-183.
Park, J. E., 2009, Study on the identification and characterization of bacteria isolated from wilt-diseased oak wood and the wilt disease-vectoring ambrosia beetle, Platypus koryoensis, Master Thesis, Dankook University, Korea.
Park, S., Lyu, D., 2007, Checklist of the family Platypodidae (Coleoptera) in Korea, J. Asia Pac.
Entomol., 10, 275-280.
Park, Y. S., Chung, Y. J., Moon, Y. S., 2013, Hazard ratings of pine forests to a pine wilt disease at two spatial scales (individual trees and stands) using self-organizing map and random forest, Ecol. Inf., 13, 40-46.
Seo, C. W., Park, J. H., 2000, Wild boar(Sus scrofa coreanus Heude) habitat modeling using GIS and logistic regression, J. Korea Spat. Inf. Soc., 8(1), 85-99.
Shore, T. L., Safranyik, L., Lemieux, J. P., 2000, Susceptibility of lodgepole pine stands to the mountain pine beetle: Testing of a rating system, Can. J. For.
Res., 30, 44-49.
Strahler, A. N., 1952, Hypsometric of erosional topography, Bulletin Geol. Soc. Amer., 63, 1117-1142.
Um, T. W., Chun, J. H., Kim, K. H., 2009, Stand structure characteristics of oak wilt infected forest, Korea, Kor.
J. Env. Eco., 23(2), 220-232.
Yamada, T., 2008, Frontiers of pathological researches on the Japanese oak wilt, Tree For. Health, 12, 67-72.
Yamasaki, M., Futai, K., 2012, Discrimination among host tree species by the ambrosia beetle Platypus quercivorus, J. For. Res., 17, 149-155.
Yamasaki, M., Ito, Y., Ando, M., 2014, The effect of stem density on the probability of attack by the ambrosia beetle Platypus quercivorus varies with spatial scale, Agric. For. Entomol., 16, 54-62.
Yamasaki, M., Sakimoto, M., 2009, Predicting oak tree mortality caused by the ambrosia beetle Platypus quercivorus in a cool-temperate forest, J. Appl.
Entomol., 133, 673-681.
Yeon, M. H., Suh, M. H., Yang, K. C., Choi, S. K., Shim, J.
K., 2006, Distribution of plant communities of Mt. Jiri with its geomorphological variation, J. Kor. Geomo.
Assoc., 13, 57-67.
Yeum, J. H., Han, B. H., Choi, J. W., Jeong, H. U., 2013, Mapping of the damaged forest by oak wilt disease in Bukhansan National Park, Kor. J. Env. Eco., 27, 704-717.
Yoo, H. D., 2009, Identification and characterization of yeasts isolated from the oak infesting insect pest Platypus koryoensis and the pest-infested oak wood, Master Thesis, Dankook University, Korea.