접수일자: 2014년 9월 14일 심사(수정)일자: 2014년 9월 28일 게재확정일자 : 2014년 12월 5일
†Corresponding author : Young-Seok Choi
이 논문은 2014년도 정부(미래창조과학부)의 재원으로 한국연구 재단의 기초연구사업 지원을 받아 수행된 것임 (No.
2012R1A1A1019451).
This is an Open-Access article distributed under the terms of the Creative Commons Attribution Non-Commercial License (http://creativecommons.org/licenses/by-nc/3.0) which permits unre- stricted non-commercial use, distribution, and reproduction in any medium, provided the original work is properly cited.
소뇌 운동실조 이상 환자를 위한 운동상상 기반의 뇌-컴퓨터 인터페이스
Motor Imagery based Brain-Computer Interface for Cerebellar Ataxia
최영석*†․신현출**․Sarah H. Ying***․Geoffrey I. Newman****․Nitish Thakor****
Young-Seok Choi, Hyun-Chool Shin, Sarah H. Ying, Geoffrey I. Newman and Nitish Thakor
*강릉원주대학교 전자공학과
Department of Electronic Engineering, Gangneung-Wonju National University
**숭실대학교 정보통신공학과
School of Electronic Engineering, Soongsil University
***Johns Hopkins University School of Medicine, Dept. Radiology
****Johns Hopkins University School of Medicine, Dept. Biomedical Eng.
요 약
소뇌 운동실조는 점차 진행되는 신경퇴행질병이며 운동 조절을 위한 기능의 상실을 동반하기에 환자의 삶을 심각하게 저 하시킨다. 소뇌 운동실조 환자는 운동제어 과정에서 부적절한 폐회로 소뇌 반응으로 인해 운동 명령이 제한된다. 본 논문 에서는 최근 뇌-컴퓨터 인터페이스 기술을 이용하여 소뇌의 이상으로 인한 운동실조 환자들이 외부기기를 제어할 수 있도 록 운동상상 기반의 뇌파의 특성을 분석하고 이를 이용한 뇌-컴퓨터 인터페이스 기법을 제안한다. 뇌파 기반의 뇌-컴퓨터 인터페이스의 효용성을 검증하기 위하여 소뇌 운동실조 환자와 정상인 그룹에서 운동상상에 따른 뮤밴드 파워를 조절하는 능력을 비교하였다. 이를 통하여 소뇌 운동실조 환자에의 뇌-컴퓨터 인터페이스의 가능성을 보여준다.
키워드 : 뇌-컴퓨터 인터페이스, 뇌파, 소뇌, 운동실조, 운동상상 Abstract
Cerebellar ataxia is a steadily progressive neurodegenerative disease associated with loss of motor control, leaving patients unable to walk, talk, or perform activities of daily living. Direct motor instruction in cerebella ataxia patients has limited ef- fectiveness, presumably because an inappropriate closed-loop cerebellar response to the inevitable observed error confounds motor learning mechanisms. Recent studies have validated the age-old technique of employing motor imagery training (mental rehearsal of a movement) to boost motor performance in athletes, much as a champion downhill skier visualizes the course prior to embarking on a run. Could the use of EEG based BCI provide advanced biofeedback to improve motor im- agery and provide a “backdoor” to improving motor performance in ataxia patients? In order to determine the feasibility of using EEG-based BCI control in this population, we compare the ability to modulate mu-band power (8-12 Hz) by perform- ing a cued motor imagery task in an ataxia patient and healthy control.
Key Words : 3D Reconstruction, Optical Flow, Kalman Filter, Mirror Neuron System, Gesture Recognition.
1. Introduction
Cerebellar ataxia is a rare neurodegenerative disease associated with loss of motor control. Some in- dependence could be restored through the use of a brain-computer interface (BCI), which has been used to decode brain signals to drive a computer controller, a wheelchair joystick, or even a prosthetic arm for other patients with motor impairments.
BCIs use electrophysiological measures of brain function to enable individuals to communicate directly with their external world, bypassing normal neuro-
muscular pathways.
Recently, noninvasive BCIs have used a variety of electroencephalogram (EEG) based features to commu- nicate the intent of the user, such as slow cortical po- tentials and event-related desynchronization via motor imagery. This noninvasive EEG-BCI has been a highly active research topic in neuroscience, engineering, and signal processing. One of the reasons for this develop- ment is the remarkable advances of BCI systems with respect to usability, information transfer, and robust- ness for which modern machine learning and signal processing techniques have been instrumental [1].
One of the most important characteristics of the EEG recorded over the sensorimotor cortex is linked to pos- sible modulation of EEG rhythms through simple motor imagery, e.g., imagining a flexion of the right or left elbow. A widely used rhythm for control is the “mu”
rhythm (8-12 Hz). The reason for utilizing this is that it shows an increase in power during relaxation (event-related synchronization, ERS), and similarly, a decrease during real and imaginary motor movement performance (event-related desynchronization, ERD) [2].
This characteristic can be utilized to control a cursor in at least one dimension. The two electrodes shown to have the largest weight of mu rhythm are located at C3 and C4 or adjacent positions, but recruitment of more electrodes could be necessary for control of more so- phisticated movements.
EEG mapping may be distorted in the setting of neurologic disease, which may affect the ability of ataxia patients to use EEG-based BCI. EEG is a rough measure of neural activity, based on the voltages gen- erated by the firing of large populations of neurons, as recorded over time from the scalp at discrete sites.
Although the literature states that the EEG pattern is
“normal” in cerebellar degeneration, this presumably re- fers to the lack of heightened epileptogenic potential, which does not necessarily indicate that the EEG is comparable to that of unaffected individuals. We hy- pothesize that cortical regions of the corticocerebellar circuit may show functional abnormalities when they are connected to areas of primary cerebellar degeneration. The strong interconnections between the cerebellum and the cerebral cortex most likely contrib- ute to the distortion in the processing of sensory feedback.
Electrophysiological studies in ataxia are rarely per- formed as early EEG studies were reportedly normal [3, 4]. There are, however, some disease-specific differ- ences in visual evoked potentials, [5] and auditory evoked potentials, [6] suggestive of white matter dis- ease located outside of the cerebellum and its direct connections. Seizures are not a common clinical mani- festation, except in certain rare subtypes, such as ace- tazolamide-responsive paroxysmal ataxia [7]; EEG findings are consistent with the epileptic phenotype.
Electrophysiological biomarker studies in other non-epileptic brain conditions demonstrate that EEG measures are useful for detecting clinically relevant, disease-specific differences [8]. However, electro- physiological studies in ataxia are not routinely per- formed in the clinical setting, given that early EEG studies were reportedly normal [9]. There are, however, some disease-specific differences in visual evoked po- tentials, auditory evoked potentials, and auditory brain stem response suggesting that there may be white matter disease located outside of the cerebellum and its direct connections.
There is some evidence that motor imagery is af- fected in cerebellar ataxia. In a study of people with unilateral cerebellar stroke, patients attempting motor imagery showed decreased motor evoked potential fa- cilitation in the associated motor cortex [10]. In a sec- ond study, patients that had apparently recovered from a unilateral cerebellar stroke showed a marked slowing of motor performance in both hands (ipsi- and con- tralateral to lesion). This effect was accompanied by a similar slowing of motor imagery, suggesting that the cerebellum, traditionally implicated in the control of motor execution, is also involved in nonexecutive motor functions such as the planning and internal simulation of movements [11].
In order to demonstrate feasibility in this first study of non-invasive, EEG-based BCI in cerebellar ataxia, we assessed the ability to modulate mu-band power during a cued motor imagery task. We also examined possible differences in performance associated with ataxia, as these differences might necessitate mod- ification in BCI decoding algorithms.
2. Methods
Four cerebellar ataxia patients (Functional Staging for Ataxia FSFA score 1-5 [12]) and five control sub- jects provided informed, written consent according to a research protocol approved by the Johns Hopkins University Institutional Review Boards. Subjects had never previously used an EEG-based BCI interface.
During each trial, subjects were visually cued either to enter a state of relaxation (target appears at the top of a computer screen) or to imagine motor movement (target appears at the bottom). A three-state (move up, move down, remain still) EEG-based BCI was used to control the position of a cursor in one dimension on a computer screen. EEG Signals were acquired using a QuickCap 64-channel EEG cap (modified 10-20 system, referenced between Cz and CPz, and grounded ante- riorly to Fz; Compumedics, El Paso, TX). The amplifier and signal processing modules were connected through client-server architecture, with a Neuroscan SynAmps2 64-channel amplifier system from Compumedics (El
Paso, TX) acting as the server, and the signal process- ing module running on a separate client computer. Data were sampled at 250 Hz, with a band-pass filter applied between 0.1 and 30 Hz, and transmitted over a TCP/IP protocol to the client PC for storage and real-time sig- nal processing using a custom BCI platform.
EEG signals were spatially filtered using common average referencing. The C3 and C4 electrodes, which generally overlap with the hand-area of the primary motor cortex, were then used in an autoregressive (AR) model to determine the power spectrum [13] as follows as
(1)
where E denotes the electrode of interest, denote the AR coefficients, is the order of AR model, and
is an independent identically distributed stochastic sequence sith zero means and variance [14]. Here, was set to 15. In addition, Burg's spectral estimation method was used to estimate the time-varying AR coefficients. Then, the power spectral density (in dB) of the AR processes was obtained by
(2)
and the mu-band (8-12 Hz) power was determined at time instants as the mean of , where,
denotes the mu-band frequency range.
The sum of the mu band power of the C3 and C4 electrodes were used to train a two stage hierarchical linear classifier. A gating classifier G was designed to identify significant modulations of power due to in- tention, which is given by
i f
(3)
where , , , and are the weights, bias, and threshold, respectively, as determined online. A second movement classifier was designed to distinguish between the relaxation and the motor imagery task,
i f
(4)
where , , , and are the weights, bias, and threshold, respectively, as determined online.
Finally, the output of classifiers was the product of the
two classifiers,
× (5) where +1 corresponds to relaxation, -1 to motor im- agery, and 0 to no task. If the cursor reached a target 7 steps away from the center where trials start, within 15 seconds, the trial was considered a success. To ach- ieve a trial success case, the sum of over all
within that trial must equal +7 in the relaxation trials, and -7 in the motor imagery trials before 15 seconds elapse. Subjects underwent 16 trials each set (8 relaxa- tion and 8 movement imagery trials), with a pseu- do-randomized order of presentation within each set.
To determine spatial correlation, the signal amplitude over the duration of the experiment was band-pass fil- tered (Butterworth) from 8-12 Hz. Correlations between the time-domain signals at each channel were taken pairwise with C3, then C4. To determine spectral corre- lation, the Spearman correlation between the mu-band power and successive 1 Hz bins was taken.
3. Results
Our primary endpoint was to evaluate the possibility that ataxia patients could achieve control of a BCI us- ing cued motor imagery. Indeed, subjects were able to achieve mean trial success of greater than 13.21%
(chance performance rate) on their first session. Chance performance was calculated as the probability of reach- ing the target based on an equal probability of per- forming any of the three possible movements with each step, up to the maximum allowable 30 steps. The aver- age successful chance trial duration was determined as the first moment of chance successes rates for the al- lowable step counts.
Fig. 1 suggests that the representative ataxia patient and control subject show an increased difference in power in the mu-band (8-12 Hz), between relaxation and motor imagery. Darker shades of red represent an increase in power during the relaxation task over the motor imagery task at the same time point and frequency band within the trial. The blue trace on the left indicates average power of each frequency. The bottom blue trace indicate minimum power over the range of frequencies at each time point, while the bottom green trace indicates maximum power at each time point. This difference is greater in the control subject as compared to the ataxia patient. Although trials continued on beyond 4 seconds, the power difference between the two tasks is not as obvious, due to the inability of subjects to maintain the required imagination throughout the task duration. The ataxia subject had higher power activity in low frequency bands, which is most likely due to movement artifacts.
그림 1. C3 정상인과 운동실조장애우의 두 가지 과제의 사건 연관 주파수 파워 차이
Fig. 1. The event related spectral power (ERSP) differences between the averages of the two task
condition for the control (left) and ataxia (right) subjects from the C3 electrode
(a)
(b)
그림 2. FSFA 지수에 따른 운동실조 환자에서의 C3/C4 전극과 주위 전극과의 상관관계: (a) 운동실조증의 상태에 따른 상관관계의 지형도 분석, (b) 운동실조증 상태와 평균
상관관계와의 선형 회귀 분석 결과
Fig. 2. Pairwise correlation between each electrode and C3/C4: (a) Spatial correlation according to ataxia severity, (b) Linear regression of mean correlation
against FSFA
In Fig. 2, the pairwise correlation of bandpass-filtered signals between each electrode and C3/C4. Control subjects achieved the expected modulation, which was modulation, which was isolated to the mu peak and was located primarily in C3 and C4. However, ataxia patients showed a different control profile in Fig.2(a), showing higher correlation of C3 and C4 activity with surrounding brain regions. Increasing ataxia severity (FSFA scores listed in the top of figure) is associated with broadened spatial distribution of correlation. With more cases, it is clear that the spatial correlation is broadened with increasing FSFA score (R2=0.525).
(a)
(b)
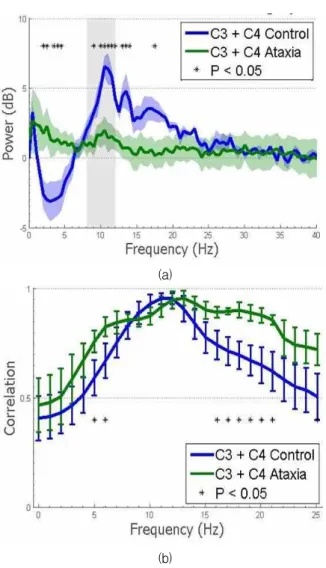
그림 3. FSFA 지수에 따른 운동실조 환자에서의 C3/C4 전극과 주위 전극과의 상관관계: (a) 운동실조증의 상태에 따른 상관관계의 지형도 분석, (b) 운동실조증 상태와 평균
상관관계와의 선형 회귀 분석 결과
Fig. 3. Pairwise correlation between each electrode and C3/C4: (a) Spatial correlation according to ataxia severity, (b) Linear regression of mean correlation
against FSFA
Fig. 3 shows, the spectral correlation over frequency ranges for both control and ataxia groups. Power mod- ulation was not isolated to mu-band range, but was correlated with broad changes in other spectral bands.
Futhermore, spectra of ataxia subjects showed a small- er mu band peak during relaxation. Here, p-value was used.In Fig. 3(a), it shows C3/C4 mean power shift ± standard error of mean (SEM) and resulting p-value.
Ataxia subjects show decreased amplitude and lack of frequency specificity. Fig. 3(b) shows C3/C4 mean spectral power correlation with mu band ± SEM. From figure, we come to know that ataxia patients show broader correlation.
4. Discussion
Our works demonstrate that despite the theoretical possibility that patients with severe ataxia may have impaired motor imagery and abnormal cortical rhythms, an ataxia patient is capable of generating sufficient changes in cortical rhythms to achieve voluntary con- trol of an EEG based BCI using cued motor imagery.
Although BCI control is possible for ataxia patients, electrophysiology is abnormal. Impaired synchronization of circuits could result in spectral smearing of the re- sulting signal, explaining the less pronounced mu-band peak during ERS as well as the increased bandwidth modulated during ERD. This reduced amplitude could lead patients to use alternative strategies to achieve BCI control, such as compensatory modulation of more distal brain regions. This could provide the necessary power shift and would explain the observed broadening of spatial correlation. Intriguingly, these EEG differ- ences correlate with disease severity, suggesting that EEG modulation could be used as a biomarker of dis- ease progression or to train motor imagery.
5. Conclusion
Our approach allows ataxia patients to control a BCI with similar efficacy to control subjects. This is the first demonstration that BCI-naïve ataxia patients are capable of using cued motor imagery to modulate mu-band power for BCI control; however, the pattern of control may differ in ataxia. This difference suggests that a disease-specific spectral and spatial decoding strategy may be necessary to optimize BCI performance and may provide a possible biomarker of disease.
References
[1] C. Guger, G. Edlinger, W. Harkam, I. Niedermayer, G. Pfurtscheller, “How many people are able to
operate an EEG-based brain-computer interface (BCI)?”, IEEE Trans Neural Systems and Rehabilitation Engineering, vol. 11, no. 2 pp.
145-147, June 2003.
[2] D. J. McFarland, L. M. McCane, S. V. David, J. R.
Wolpaw, “Spatial filter selection for EEG-based communication”, Electroencephalography Clinical Neurophysiology, vol. 103, pp. 386-394, 1997.
[3] F. R. Brown, “Degenerative cerebellar ataxias", Neurology, vol. 9, pp.799-805, 1959.
[4] L. A. Liversedge, V. Emery,
“Electroencephalographic changes in cerebellar de- generative lesions", Journal of Neurology and Neurosurgery Psychiatry, vol. 24, no. 4, pp.
326-330, 1961.
[5] L. Schols, C. Linnemann, C. Globas,
“Electrophysiology in spinocerebellar ataxias:
Spread of disease and characteristic findings", The cerebellum, pp. 198-203, 2008.
[6] M. Arai, H. Tanaka, R. D. Pascual-Marqui, K.
Hirata, “Reduced brain electric activities of frontal lobe in cortical cerebellar atrophy", Clinical Neurophysiology, vol. 114, no. 4, pp.740-747, 2003.
[7] N. L. Zasorin, R. W. Baloh, L. B. Myers,
“Acetazolamide-responsive episodic ataxia syn- drome", Neurology, vol. 33, pp. 1212-1214, 1983.
[8] J. S. Kwon, B. F. O'Donnell, G. V. Wallenstein, R.
W. Greene, Y. Hirayasu, P. G. Nestor, M. E.
Hasselmo, G. F. Potts, M. E. Shenton, R. W.
McCarley, “Gamma frequency-range abnormalities to auditory stimulation in schizophrenia", Archives of General Psychiatry, vol. 56, no. 11, pp.
1001-1005, Nov. 1999.
[9] B. A. Clementz, M. A. Geyer, D. L., Braff, “P50 Suppression among schizophrenia and normal comparison subjects: A methodological analysis", Biological Psychiatry, vol. 41, no. 10, pp.
1035-1044, May 1997.
[10] F. Battaglia, A. Quartarone, M. F. Ghilardia, R.
Dattola,S. Bagnato, V. Rizzo, L. Morgante, P.
Girlanda, “Unilateral cerebellar stroke disrupts movement preparation and motor imagery", Clinical Neurophysiology, vol. 117, no. 5, pp.
1009-1016, 2006.
[11] B. González, M. Rodriquez, C. Ramirez, M. Sabaté,
“Disturbance of Motor Imagery After Cerebellar Stroke". Behavioral Neuroscience, vol. 119, no. 2, pp. 622-626 Apr. 2005.
[12] S. H. Ying, S. I. Choi, S. L. Perlman, R. W. Baloh, D. S. Zee, A. W. Toga, “Pontine and cerebellar atrophy correlate with clinical disability in SCA2", Neurology, vol. 66, no. 3, pp. 424-42, Feb. 2006.
[13] A. Chatterjee, V. Aggarwal, A. Ramos, S.
Acharya, N. V. Thakor, “A brain-computer inter- face with vibrotactile biofeedback for haptic information." Journal of NeuroEngineering and
Rehabilitation, vol. 4, no. 1, pp. 40, Oct. 2007.
[14] R. Bos, S. deWaele, P. Broersen, “Autoregressive spectral estimation by application of the Burg al- gorithm to irregularly sampled data", IEEE Transactions on Instrumentation and Measurement.
vol. 51, no. 6, pp. 1289-1294, Dec. 2002.
저 자 소 개
최영석(Young-Seok Choi)
2000년 : 한양대학교 전자, 전자통신, 전파 공학과군 (공학사)
2007년 : 포스텍 전자컴퓨터공학부 (공학 박사)
2012년~현재 : 강릉원주대학교 전자공학 과 조교수
관심분야 : Neural engineerin, Brain-machine interface Phone : +82-33-640-2429
E-mail : [email protected]
신현출(Hyun-Chool Shin)
1997년 : 포항공과대학교 전자전기공학부 (공학사)
1999년 : 포항공과대학교 전자전기공학부 (공학석사)
2004년 : 포항공과대학교 전자전기공학부 (공학박사)
2007년~현재 : 숭실대학교 정보통신전자 공학부 부교수
관심분야 : Brain-computer interface, Bio/Neural signal processing
Phone : +82-2-828-7165 E-mail : [email protected]
Sarah Ying
1991년 : Harvard University, Biochemical Science (A.B.) 1995년 : Johns Hopkins University
School of Medicine (M.D.) 2004년~현재 : Johns Hopkins
University School of Medicine Assistant Professor
관심분야 : Neurology, Human Biology, Medical imaging E-mail : [email protected]
Geoffrey I. Newman
2008년 : City University of New York, Biomedical Engineering (B.Tech.)
2008년~현재 : Johns Hopkins University School of Medicine, Doctor's course
관심분야 : Brain-machine interface E-mail : [email protected]
Nitish V. Thakor
1974년 : Indian Institute of Technology, Electrical Engineering (B.Tech.) 1978년: University of Wisconsin, Biomedical Engineering (M.S.) 1981년: University of Wisconsin,
Electrical and Computer Engineering (Ph.D.)
1983년~현재 : Johns Hopkins University School of Medicine Professor
관심분야 : Neurological instrumentation, Biomedical sig- nal processing, Neural prosthesis, Brain-ma- chine interface
E-mail : nthakor@bme,jhu.edu