*준회원, 광운대학교 전파공학과
**정회원, 광운대학교 전파공학과 접수일자: 2010.8.17 수정일자: 2010.11.15 게재확정일자: 2011.2.11
논문 2011-1-5
자동 원격검침을 위한 전력선 통신 시스템에서의 등화 기법 연구
Performance of Equalizer Schemes in Power Line Communication Systems for Automatic Metering Reading
김요철*, 배정남*, 김진영**
Yocheol Kim, Jung-Nam Bae, Jin-Young Kim
요 약 본 논문에서는 자동 원격검침을 위한 전력선 통신에서의 등화기 기법인 zero-forcing (ZF)와 minimum mean square error (MMSE) 기법을 제안하고 분석하였다. 전력선 통신을 이용한 효율적인 AMR 시스템 구현을 위해서 임펄 스 노이즈와 다중경로 채널의 영향들은 완화되어야 한다. 이러한 영향들을 극복하기 위해, 앞서 말한 등화기 기법들 을 사용하였다. 시스템 성능은 비트오류율 (BER)에 의해서 평가되어진다. 모의실험 결과로부터 등화기가 전력선 통신 시스템의 BER 성능을 현저하게 향상시키고 MMSE가 ZF보다 더 나은 성능을 제공함을 확인하였다. 본 논문의 실험 결과는 AMR 시스템뿐만 아니라, 다양한 스마트 그리드 서비스에도 적용될 수 있다.
Abstract In this paper, we propose and analyze the equalizer schemes, zero-forcing (ZF) and minimum mean square error (MMSE) in power line communication (PLC) system for automatic meter reading (AMR) . For efficient implementation of AMR system with PLC, effects of impulsive noise and multipath channel should be mitigated. To overcome these effects, the above equalizer schemes are employed. System performance is evaluated in term of bit error rate. From simulation results, it is confirmed that the equalizer can significantly improve bit error rate (BER) performance in PLC system, and MMSE equalizer provides better performance than ZF scheme. The results of this paper can be applied to AMR system as well as various smart grid services using PLC.
Key Words : Automatic meter reading, Minimum mean square error, Power line communication, Smart grid, Zero-forcing.
Ⅰ. Introduction
Smart grid has been an important issue not only for electric industry but also for the industry overall such as car, power distribution, computer, communication, and so on. It also has huge effects on home network.
The goal of the smart grid is to use advanced, information-based technologies to increase power grid efficiency, reliability, and flexibility and reduce the rate at which additional electric utility infrastructure needs to be built. The smart grid provides a variety of services such as distribution automation system (DAS), energy management service (EMS), home area network (HAN), and supervisory control and data acquisition (SCADA) by converging with IT techniques[1]. Expecially, automatic meter reading
(AMR) is the most interested topic at the inside and outsid of the country.
AMR is a technology which automatically gathers information from energy, gas, and water metering devices and transfers it to the central office in order to analyze it for imposing utility bills. the information is read remotely, without the need to check the meter in person. AMR provide cost reduction for utility companies including as well as more efficient management capability for demand control and energy monitoring. Therefore, any complaints from the customers could be resolved and new busines market for utilities companies would be developed through AMR services[2].
AMR systems consists of three basic components:
an electrical meter, a central office, a communication system. An electrical meter is an electronic device that measures the amount of electrical energy supplied to a residence or business. It transmits data form the remote terminal to the central device. A central office is able to store and to process received information. A communication system is necessary to transmit data and to control the different signals between the remote device and the central office. AMR can be performed by both wired (power line, LAN) and wireless (RF, WLAN) ways[3].
Since AMR mainly connects with power lines, power line communication (PLC) is considered as the most promising technique for AMR system. The PLC is, as it is called, the technique transmitting data through power lines and has many advantageous features such as simple installation and low cost because this technology uses existing power line.
Moreover, the PLC system is robust for exterior environments and easy to access in anywhere with outlets since the power line system is the strongest and national wide infrastructure[4].
However, several challenging issues should be relieved for efficient implementation of the PLC system.
One of them is impulse noise, which is generated by random on/off of electrical devices. Its power spectral
density (PSD) may be from minimum 10dB up to 50dB above the background noise spectrum. Therefore, it may wipe out blocks of data symbols during data transmission[5]. In power lines, transmitting signal experiences serious attenuation due to skin effects.
Additionally, PLC system has various terminal impedances, and causes multipath fading due to reflections of the signal, which are caused by the impedance mismatches in the electric network[6,7]. Hence, inter-symbol interference (ISI) is generated and then it reduces the system performance.
In this paper, to compensate the channel effects and mitigate impulsive noise, we employ two linear equalizer schemes, zero-forcing (ZF) and minimum mean square error (MMSE). The ZF applies inverse of the channel to the received signal and restores the signal before the channel, but in noisy channel, this scheme may amplify the noise greatly. The MMSE scheme does not usually eliminate ISI completely but instead minimizes the total power of the noise and ISI components in the output.
This paper is organized as follows. In Section II, we describe a channel and a noise model in PLC system.
The equalizer scheme considered in this paper is presented in Section III and simulation results are shown in Section IV. Finally, Concluding remarks are given in Section V.
Ⅱ. Power line communication
1. System Model
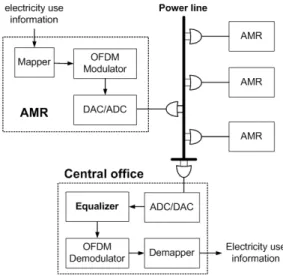
Fig. 1 illustrates the proposed AMR system model with PLC. Electricity use information is modulated as by the mapper and the OFDM modulator. The modulated signal is converted to analog at the digital-to-analog converter (DAC) and then transmitted to the central office via power lines. The received signal experienced channel effects and a variety of noises changed to digital signal at the analog-to-digital converter (ADC). Next, the equalizer
compensates the effects of the channel and noises.
Finally, the equalized signal is restored as the original information via OFDM demodulator and de-mapper.
그림 1. 전력선 통신을 이용한 AMR 시스템 모델 Fig. 1 AMR system model with PLC
2. Channel Model
The power line medium is a hostile transmission channel due to the variance of impedance caused by the variety of appliances at the end of power lines. The impedance is mostly affected by the characteristic impedance of the cables, the network topology, and the connected electrical loads. Since signal reflection is generated at the impedance mismatching part, we should notice that signal propagation does not only occur along a direct path between transmitter and receiver, but additional paths should also be considered.
This results in multipath channel with frequency selective fading[6,7].
In this paper, we employ the multipath model proposed by M. Zimmermann and K. Dostert[7]. In order to simplify the model, the terminals and lines connecting directly are assumed to be matched. Each path has a weighting factor which represents the product of the reflection and transmission factors along the path. All reflection and transmission factors at power lines are basically less or equal to one. Thus, the
weighting factor gi is also less or equal to one. As the number of transitions and reflections increase, will be smaller. Furthermore, signals transmitted via longer paths experience higher attenuation, so they can not affect to the overall signal at the receiving point. Due to these facts, it is reasonable to approximate the basically infinite number of paths by only dominant paths.
The losses of cables cause an attenuation increasing with length and frequency. The frequency-dependent attenuation is modeled by the parameters , , and
. Finally, the channel model is simplified as
, (1)where , , and demonstrate weighting term, attenuation term, and delay term, respectively[8].
3. Noise Model
The noises can be sorted by five categories in PLC system: colored background noise, narrow-band noise, periodic impulsive noise synchronous or asynchronous to the main frequency (50~60Hz), and asynchronous aperiodic impulsive noise.
The colored background, narrow-band, and periodic asynchronous noise may be summarized as background noise due to their properties which are typically stationary over periods of seconds and minutes, even for hours. However, periodic synchronous impulsive noise and asynchronous impulsive noise caused by power supplies and by switching transients in the network, respectively, are varying rapidly for microseconds to milliseconds. Therefore, it is necessary to set up impulsive noise model[5].
As an impulsive noise model, we employ Middleton Class A noise model[8]. For this model, the observed process is assumed to have two independent components:
(2) where is a stationary background Gaussian
noise component, and is the impulsive component of the interference.
The arrival time of these independent impulsive events at the observer is assumed to be governed by a Poisson process. In addition, the waveforms independently overlap in time. Under these assumptions, probability density function (PDF) of the Class A noise as is given by
∞ (3)with
, (4) where denotes the number of impulsive noise occurrence and is called the impulsive index, which is the product of the average rate of impulsive noise and the mean duration of typical impulse.
In Eq. (3), the variance
is defined as
. (5) The parameter and denote the power of background noise and impulsive noise, respectively.
The parameter is the background-to-impulsive ratio (i.e. ).
Ⅲ. Linear Equalizer
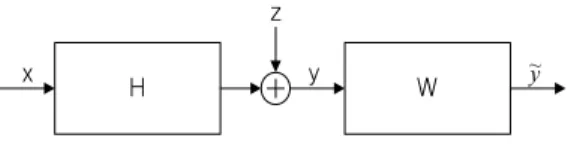
Fig. 2 shows block diagram of linear equalizer.
Linear equalizer systems are divided into two kinds: ZF and MMSE schemes.
x H
z
y W y~
그림 2. 선형 등화기 블록 다이어그램
Fig. 2. Block diagram of linear equalizer
In order to reject the interference, we consider the ZF linear detector, which satisfies the condition shown
below.
(6) where HH denote the Hermitian transpose, H is the channel matrix.
The ZF algorithm is ideal when the channel is noiseless. However, when the channel is noisy, the ZF algorithm will amplify the noise greatly where the channel has small magnitude in the attempt to invert the channel completely.
In order to minimize the power of the noise component, we employ the MMSE algorithm, which is given by
(7) where denote the noise variance.
The MMSE algorithm can be used to reject the interference with varying the decoding matrix in accordance with signal-to-noise ratio (SNR). Besides, it prevents the noise component from being amplified.
Ⅳ. Simulation results
For simulation, the parameters we consider in this paper are summarized in Table 1. Simulation is conducted for the case that the number of power line branches () is 5. The length of main line is fixed as 60 m and the length of branches is determined randomly in the range of 2m to 10m every packet. It is also random that the state of each device at the end of branch is on or off. The performance is evaluated in terms of bit error rate (BER).
Parameters Values Bandwidth 75 MHz Sampling frequency 150 MHz Tone interval (1/TFFT) 48.828125 kHz
(= 75 MHz/1536) IFFT interval 3072 samples Cyclic prefix interval (TCP) 336 samples
Symbol interval 3408 samples FFT period (TFFT) 20.48 μs Symbol Length (TFFT + TCP) 22.72 μs 표 1. 실험 파라미터
Table 1. Simulation Parameters
그림 3. ZF 등화기의 BER 성능
Fig. 3. BER performance of ZF equalizer
Fig. 3 shows the performance of ZF equalizer for different modulation schemes in PLC system. At SNR of 15dB, BPSK-ZF, QPSK-ZF, and 16QAM-ZF demonstrate bit error rate of about 0.8%, 1.5%, and 5%, at the point of 25dB, 0.07%, 0.15%, and 0.5%, respectively. The gaps of SNR between BPSK-ZF and QPSK-ZF, BPSK-ZF and 16QAM-ZF schemes are 3dB and 9dB at the BER of 10-2 each.
그림 4. MMSE 등화기의 BER 성능
Fig. 4. BER performance of MMSE equalizer
Fig. 4 depicts BER performance of MMSE equalizer for different modulation schemes. At SNR of 15dB, the BPSK-MMSE, the QPSK- MMSE, and the 16QAM- MMSE schemes have bit error rate of about 0.4%, 0.9%, and 2%, at the point of 25dB, 0.035%, 0.09%, and 0.28%, respectively. The gaps of SNR between
BPSK-ZF and QPSK-ZF, BPSK-ZF and 16QAM-ZF schemes are similar to the case of ZF equalizer.
그림 5. ZF와 MMSE의 BER 성능 비교
Fig. 5. Comparison of BER performance between ZF and MMSE schemes.
In Fig. 5, BER performances between ZF and MMSE schemes are compared for varying modulation schemes. The BPSK-ZF scheme shows SNR of 14dB, while the BPSK-MMSE scheme shows 12dB at BER point of 10-2. In the case of QPSK modulation, the ZF and MMSE schemes demonstrate SNR of 15dB and 17dB. Both cases illustrate 2dB difference in SNR. It also appears similar difference in the case for 16QAM modulation. Therefore, it is confirmed that MMSE scheme has better BER performance than ZF scheme.
Ⅴ. Conclusions
In this paper, we proposed and analyzed the equalizer schemes, ZF and MMSE, in PLC system for AMR. The PLC was considered as the most promising technique for AMR system because it mainly connected with power line and had many advantages such as low cost, easy access, national-wide network, and so on.
However, PLC suffered from channel effectc (ISI) and impulsive noise. To overcome these issues, in this paper, the equalizer schemes were employed. From the simulation results, it is confirmed that the equalizer
※ 본 연구는 지식경제부 및 정보통신산업진흥원의 대학 IT연구센터 지원사업의 연구결과로 수행되었음 (NIPA-2010-(C1090-1011-0005))
저자 소개 김 요 철(준회원)
∙광운대학교 전파공학과 공학사
∙광운대학교 전파공학과 석사과정
<주관심분야 : 전력선 통신, 스마트 그 리드, 이동무선통신, OFDM, 채널코 딩>
김 진 영(정회원)
∙서울대학교 전자공학과 공학박사
∙서울대학교 반도체공동연구소 특별연 구원
∙미국 Princeton University, Research Associate
∙SK텔레콤 중앙연구원 책임연구원
∙미국 Massachusetts Institute of Technology (M.I.T 공대), Visiting Scientist
∙IEEE Senior Member
∙現)광운대학교 전파공학과 교수
<주관심분야 : 전력선 통신, 스마트 그리드, 가시광 통신, UWB, LED-ID, DMB, RFID/USN 기술, 이동무선통신, 통 방융합기술, 인지 무선 통신>
배 정 남(준회원)
∙광운대학교 전파공학과 공학사
∙광운대학교 전파공학과 석사과정
<주관심분야 : 방송통신, 이동무선통신, 가시광 통신, MIMO, LED-ID>
improved BER performance in PLC system. It was also verified that the MMSE scheme can provide better BER performance than ZF scheme. The results of this paper can be applied to design and implement efficient and robust AMR system with PLC.
REFERENCES
[1] J. Y. Kim, Power Line Communication Systems, GS Intervision Publisher, Seoul, Korea, 2009.
[2] B. S. Park, D. H. Hyun, S. K. Cho,
"Implementation of AMR system using power line communication" Transmission and Distribution Conference and Exhibition 2002:
Asia Pacific. vol. 1 pp. 18 - 21, 2002.
[3] B. Sivaneasan, E.Gunawan, P. L. So, "Modeling and Performance Analysis of Automatic Meter-Reading Systems Using PLC Under Impulsive Noise Interference," IEEE Trans.
Power Delivery, vol. 25, issue 3, pp. 1465-1475,
2010.
[4] M. S. Yousuf and M. El-Shafei, “Power line communications: an overview - part I,” in Proc.
4th Int` Conf. Innovations in Information Technology 2007, pp. 218-222, Nov. 2007.
[5] M. Zimmermann and K. Dostert, “Analysis and modeling of impulsive noise in broad-band powerline communications,” IEEE Trans.
Electromagnetic Compatibility, vol. 44, no. 1, pp.
249-258, Feb. 2002.
[6] M. Gotz, M. Rapp, and K. Dostert, “Power line channel characteristics and their effect on communication system design,” IEEE Commun.
Magazine, vol. 42, pp. 78-86, 2004.
[7] M. Zimmermann and K. Dostert, “A multipath model for the powerline channel,” IEEE Trans.
Commun., vol. 50, no. 4, pp. 553-559, Apr. 2002.
[8] D. Middleton, “Statistical-physical model of electromagnetic interference,” IEEE Trans.
Electromagnetic Compatibility, vol. EMC-19, no. 3, pp. 106-126, Aug. 1977.