° 2012. The Korean Astronomical Society. All Rights Reserved. c
TRENDS OF PAPERS PUBLISHED FROM 2006 TO 2010 IN JOURNALS NATURE AND SCIENCE
Sang Chul Kim
1, Seung-Lee Kim
1, Jaemann Kyeong
1, Jae Woo Lee
1, Wanggi Lim
1, and Sung Hyun Jeon
1,21
Korea Astronomy and Space Science Institute, Daejeon 305-348, Republic of Korea
2
Department of Astronomy and Space Science, Chungnam National University, Daejeon 305-764, Republic of Korea
E-mail: [email protected]
(Received March 26, 2012; Accepted May 22, 2012)
ABSTRACT
We present an analysis of the papers published in the journals Nature and Science in the years from 2006 to 2010. During this period, 7788 papers in total were published in the two journals.
This includes 544 astronomy papers that correspond to 7.0% of the papers in ‘all’ research fields and 18.9% of those in the field of ‘physical sciences’. The sub-fields of research of the astronomy papers are distributed, in a descending order of the number of papers, in Solar System, stellar astronomy, galaxies and the universe, the Milky Way Galaxy, and exoplanets. The observational facilities used for the studies are mainly ground-based telescopes (31.1%), spacecrafts (27.0%), and space telescopes (22.8%), while 16.0% of papers did not use any noticeable facilities and 1.7%
used other facilities. Korean scientists have published 86 papers (33 in Nature and 53 in Science), which is 1.10% of all the papers (N = 7788) in the two journals. The share of papers by Korean astronomers among the scientific papers by Koreans is 8.14%, slightly higher than the contribution of astronomy papers (7.0%) in both journals.
Key words: history and philosophy of astronomy; sociology of astronomy; astronomical data bases:
miscellaneous
1. INTRODUCTION
While all scientific and astronomical research papers re- port new findings on nature and the Universe, some of them contribute greatly to the development of science and human knowledge. These achievements that have a high impact on science and mankind are often acknowl- edged by press releases to the public and/or prestigious prizes such as the Nobel Prize. Some representative ways to assess papers and determine which are high im- pact papers could be investigating highly cited papers or considering papers published in highly cited jour- nals (Davoust & Schmadel, 1987; Leverington, 1996;
Schulman et al., 1997; Abt, 1998, 2000; Pearce, 2004;
Trimble & Ceja, 2008; Stanek, 2008; Crabtree, 2008;
Trimble, 2009; Frogel, 2010; Kim, 2011).
There have been many studies to measure the pro- ductivity and/or effectiveness of (1) facilities (e.g. tele- scopes) (Trimble, 1995, 1996; Benn & S´anchez, 2001a, 2001b; Ringwald et al., 2003; Meylan, Madrid, &
Macchetto, 2004; Trimble, Zaich, & Bosler, 2005;
Grothkopf et al., 2005; Trimble & Ceja, 2007, 2008;
Trimble, 2009; Apai et al., 2010), (2) organizations (Crabtree & Bryson, 2003), (3) countries (S´anchez &
Benn, 2004; Abt, 2010; Kamphuis & van der Kruit, 2010), (4) scholars (Dietrich, 2008; Stanek, 2009; Kam- phuis & van der Kruit, 2010; Pimbblet, 2011), and so
http://pkas.kas.org 17
on. Ahn et al. (2008) suggested that the number of papers produced by ground-based large (D ∼ 3.6 − 10 m) optical telescopes are roughly proportional to the diameters of the primary mirrors (see also Levering- ton (1997)). Recently, Kim (2011) presented results of an investigation on the paper productivities of ground- based large (D > 8 m) optical telescopes from an anal- ysis of papers published from 2000 to 2009.
Considering that the astronomical papers with the highest number of citations and those published in the journals Nature and Science are the outputs with the greatest impact on science and on mankind (Benn &
S´anchez, 2001b), we have investigated the papers pub- lished in the journals Nature and Science from 2006 to 2010 in this study. Specifically, we have tried to an- swer the following questions which people often ask: (1) how many papers are published in the journals Nature and Science, (2) what is the percentage of astronomy papers among these papers, (3) what are the distribu- tions and portions of sub-research fields of astronomy, (4) what facilities were used for those astronomy papers and what were the percentages of their uses, and (5) how many Korean scientists and Korean astronomers contributed to those papers. Because in some countries including Korea there is insufficient capability in the so- ciety to assess the scientific competence of personnel or the qualities of research output, it is common to con- sider publications in highly cited journals/magazines like Nature and Science as the proxy of scientific ex- pertise. It will be, therefore, meaningful to investigate the statistics and distribution of papers in the two rep- resentative journals. This paper is organized as follows:
Section 2 describes the data utilized in this work. Sec- tion 3 presents the analysis results of the number of papers, research fields in astronomy, astronomical fa- cilities used, and papers by Koreans. Finally, Section 4 provides summary and discussion of the results.
2. DATA
The academic papers investigated in this study are those contained in the two weekly journals Nature
1and Science
2for five years from 2006 to 2010. Among the contents of the two journals, we only counted ‘articles’
and ‘letters’ in Nature and ‘research articles’ and ‘re- ports’ in Science in order to take into account original
1http://www.nature.com.
2http://www.sciencemag.org.
studies (cf. Isaac Newton Group webpage
3).
In this paper, we have used the term ‘astronomy’ to include both astronomy and astrophysics.
3. RESULTS
3.1. Number of Papers
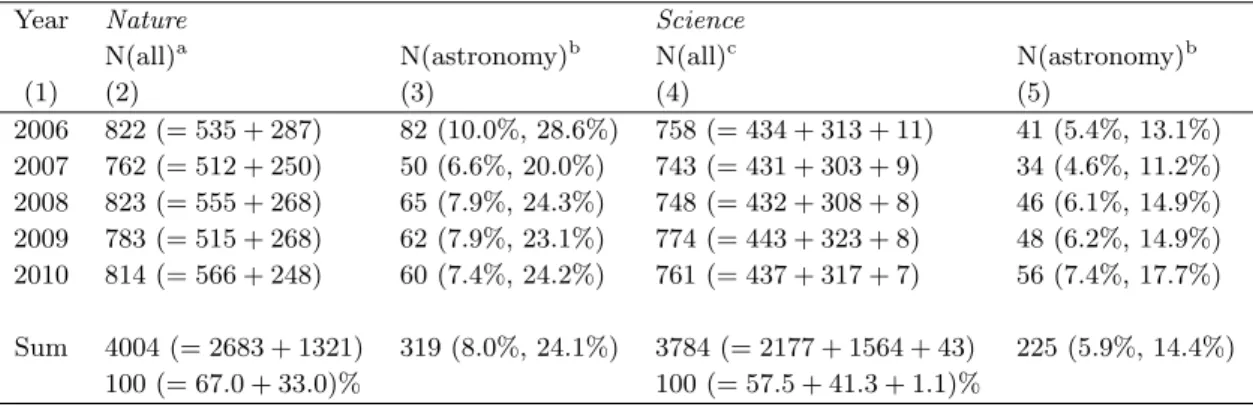
Table 1 shows the basic statistics of the papers in the journals Nature and Science from 2006 to 2010. Dur- ing this period, 4004 papers were published in Na- ture, while 3784 papers were published in Science, with yearly mean numbers of 800 and 757, and weekly (i.e., per issue) mean numbers of 15.6 and 14.8, respectively.
For the journal Nature, we have used the webpage of the Japanese table of contents, which shows a detailed field classification for each article. Using these classifi- cations, we distributed each research field into two ar- eas of life sciences and physical sciences, of which items are shown in the footnotes of Table 1. The second col- umn of Table 1 shows the yearly number of papers in each of these two main categories for the journal Na- ture.
The subject index of the journal Science’s webpage gives three main classifications; life sciences, physical sciences, and other subjects. Astronomy is included in the physical sciences; ‘other subjects’ include educa- tion, economics, sociology, policy/research ethics, etc.
The numbers of papers in each of these categories for each year are shown in the fourth column of Table 1.
For the period of 2006 to 2010, there were 319 and 225 astronomy papers published in the journals Na- ture and Science, with yearly mean values of 64 and 45, respectively. The astronomy papers in Nature ac- counted for 8.0% and 24.1% of ‘all’ and ‘physical sci- ences’ papers, while those of Science accounted for 5.9%
and 14.4%, respectively. These 544 (= 319 + 225) pa- pers in astronomy for the journals Nature and Sci- ence comprise a total of 7.0% of the papers for ‘all’
research fields (N = 7788 = 4004 + 3784) and 18.9%
of the papers for the fields of ‘physical sciences’ (N
= 2885 = 1321 + 1564).
If we simply compare the fraction of astronomy pa- pers among all science papers with the fraction of funds given to astronomy field among all research fields, the portion of astronomy papers among all science papers is greater than that of the fund given to astronomy among all the research related budgets. For example, in the
3http://www.ing.iac.es/PR/natsci.html.
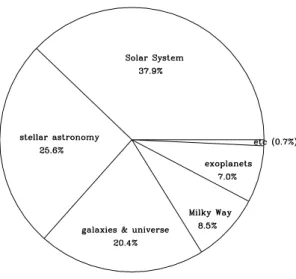
Fig. 1.— The distribution of subjects for papers pub- lished in the journals Nature and Science. ‘stellar astron- omy’ includes stars, supernovae, novae, star formation, and the Sun; ‘galaxies & universe’ includes external galaxies, active galactic nuclei, gamma-ray bursts, galaxy clusters, large scale structure, and cosmology; ‘Milky Way’ includes our Galaxy, star clusters, and interstellar matter; ‘etc.’ in- cludes cosmic rays and instrumentation. This shows only the general trend and the exact order could change, depend- ing on the classification criteria of each item.
case of the United States (we take the U.S. case as an example because it is not easy to get funding informa- tion for other countries), funds approved and disbursed by the National Science Foundation for the field of as- tronomy in 2011 were only 4.3% (236.6 million USD) of the research and related activities (R&RA) fund of 5.56 billion USD
4. All the more interesting is to note that astronomy papers make up almost one fifth of the physical science papers, which include all the natural sciences and engineering fields. This implies that as- tronomy has a greater impact on science and mankind and generates great interest from the general public.
3.2. Sub-fields in Astronomy
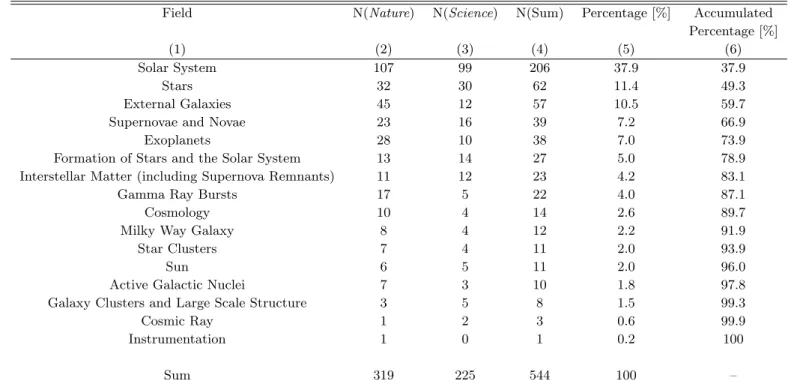
Table 2 shows the distribution of papers in the sub- fields of astronomy for the journals Nature and Science.
4http://www.nsf.gov.
The classification criterion has been set up by the au- thors and modified by comparing the results from the two journals. Figure 1 shows the general distribution of the sub-fields. The data in this Figure shows that the order, sorted by number of papers, is Solar System, stellar astronomy, galaxies and the universe, the Milky Way Galaxy, and exoplanets.
‘Solar System’ is the most studied sub-field in the two journals, with a percentage of 37.9%, followed by
‘Stars’ (11.4%), ‘External Galaxies’ (10.5%), ‘Super- novae and Novae’ (7.2%), ‘Exoplanets’ (7.0%), and so on (Table 2). ‘Solar System’ and ‘Stars’ comprise half of astronomy papers (see the sixth column of Table 2), while the five fields (Solar System, Stars, Exter- nal Galaxies, Supernovae and Novae, and Exoplanets) make up three quarters.
Reasons why the field of ‘Solar System’ takes the largest portion of astronomy papers could be the fol- lowing. The first reason could be the launches of sev- eral spacecrafts/satellites, which bring us much closer and more detailed views/information on Solar System objects. This is shown in the following subsection, in Table 3 and in Figure 2. As can be seen in Figure 2 (a), the papers that used spacecrafts comprised 27.0%
(147/544) of all the astronomy papers; and spacecrafts were used in 32.2% (147/457) of astronomy papers (ex- cluding papers of ‘no facility used’). Another reason might be the great interest of both scientists and the public in the neighborhood of our home planet, which extends from the Earth and Moon to Mercury, Venus, and Mars, and on to the far side of the Solar System, as well as to asteroids and comets.
3.3. Facilities for Astronomy Papers
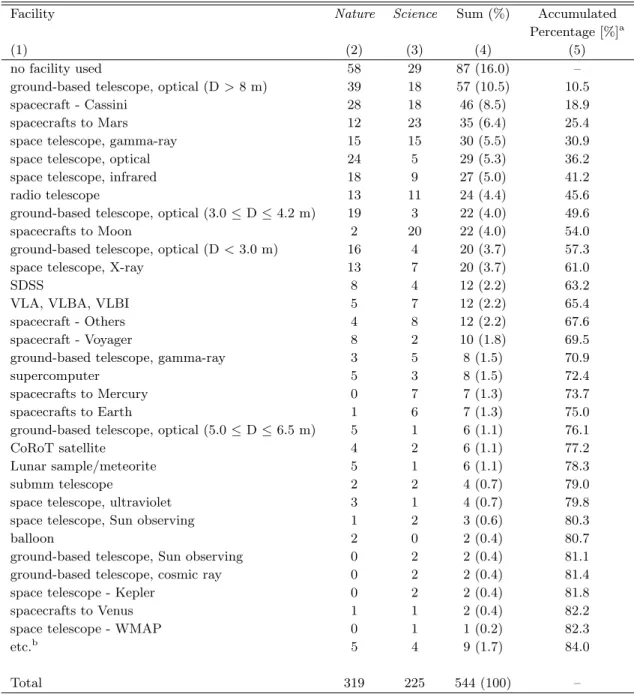
Table 3 and Figure 2 show the statistics of the obser- vational facilities used in the astronomy papers under consideration. When multiple facilities are used in a certain paper, we either (1) focused on the main facil- ity which is presumed to have provided the most critical data for the research (e.g., taking the Very Large Tele- scope instead of the Keck Telescope in Gal-Yam et al.
(2009)’s paper), or (2) took the larger (more expen-
sive) facility over the smaller (cheaper) ones when they
were used with similar importance (e.g., taking the 8.2
m Subaru telescope instead of the 2.2 m/3.5 m tele-
scopes at the Calar Alto Astronomical Observatory, in
Krause et al. (2008)). Although these selections can
leave some ambiguities in certain cases, we assume that
Table 1: Number of Papers for Research Fields Published in the Nature and Science Journals
Year Nature Science
N(all)
aN(astronomy)
bN(all)
cN(astronomy)
b(1) (2) (3) (4) (5)
2006 822 (= 535 + 287) 82 (10.0%, 28.6%) 758 (= 434 + 313 + 11) 41 (5.4%, 13.1%) 2007 762 (= 512 + 250) 50 (6.6%, 20.0%) 743 (= 431 + 303 + 9) 34 (4.6%, 11.2%) 2008 823 (= 555 + 268) 65 (7.9%, 24.3%) 748 (= 432 + 308 + 8) 46 (6.1%, 14.9%) 2009 783 (= 515 + 268) 62 (7.9%, 23.1%) 774 (= 443 + 323 + 8) 48 (6.2%, 14.9%) 2010 814 (= 566 + 248) 60 (7.4%, 24.2%) 761 (= 437 + 317 + 7) 56 (7.4%, 17.7%)
Sum 4004 (= 2683 + 1321) 319 (8.0%, 24.1%) 3784 (= 2177 + 1564 + 43) 225 (5.9%, 14.4%) 100 (= 67.0 + 33.0)% 100 (= 57.5 + 41.3 + 1.1)%
a
Number of papers for all research fields (= life sciences + physical sciences), where astronomy is included in the latter.
Life sciences mean archaeology, structural biology, agronomy, nano-technology, brain, immunology, microbiology, virus, ontogeny, pathology, taxonomy, physiology, biophysics, ecology, biochemistry, cytology, sense, plant, neurology, psychology, cancer, pharmacology, linguistics, epidemiology, genetics, cognizance, medicine, tumor, evolution, and cooperative action and physical sciences mean engineering, nano-technology [different from that in the life science], mathematics, universe, meteorology, physics, physical chemistry, optics, quantum, materials, earth, statistics, microscopy, ocean, visualization, chemistry, chemical engineering, and environment.
b
Number of papers in astronomy. Values in parentheses are percentage among ‘all’ papers (for the former) and percentage among ‘physical sciences’ papers (for the latter).
c
Number of papers for all research fields (= life sciences + physical sciences + Etc.), where ‘Etc.’ includes, e.g., education, economics, sociology, and policy/research ethics (astronomy is included in the ‘physical sciences’).
they do not significantly affect the distribution shown in Figure 2.
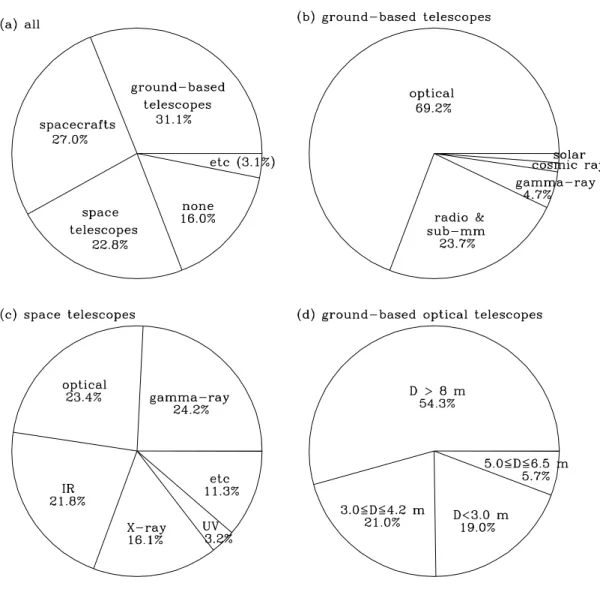
While 16.0% of papers did not use any noticeable fa- cilities for their studies (e.g., theory, simulation), large (D > 8 m) optical telescopes were dominantly used for the studies of 10.5% papers (combining Nature and Science). They are currently the largest facilities in optical wavebands. Table 3 shows that the next most heavily-used facilities were spacecrafts to Saturn and Mars (14.9%) and space telescopes in the gamma-ray, optical, and infrared wavebands (15.8%). Figure 2 (a) shows that the percentages of papers that used ground-based telescopes, spacecrafts, and space tele- scopes were 31.1%, 27.0%, and 22.8%, respectively, for all astronomy papers. Optical and radio & sub-mm telescopes make up 69.2% and 23.7%, respectively, of all the ground-based telescopes (Figure 2 (b)). Figure 2 (c) shows that space telescopes of gamma-ray, optical, infrared, X-ray, and ultraviolet wavebands take 24.2%, 23.4%, 21.8%, 16.1%, and 3.2%, respectively.
Among the 105 papers that used ground-based op- tical telescopes, as shown in Figure 2 (d), the largest
telescopes of D > 8 m comprise 54.3% (N = 57), while those of 3.0 ≤ D ≤ 4.2 m take 21.0% (N = 22), those of D < 3.0 m take 19.0% (N = 20) and those of 5.0
≤ D ≤ 6.5 m take 5.7% (N = 6). The possible rea- son why ground-based optical telescopes of diameters between 5.0 m and 6.5 m take a lesser percentage of papers (1.1% among all the facilities in Table 3) than those of diameters between 3.0 m and 4.2 m (4.0%) or even those of diameters smaller than 3.0 m (3.7%) (Figure 2 (d)) could be the lower ( ∼ 1/3) number of
<telescopes for ground-based optical telescopes of diam-
eters between 5.0 m and 6.5 m. As can be seen in
Table 3, among the ground-based optical telescopes, it
is remarkable that the Sloan Digital Sky Survey (SDSS)
project, operated with only one 2.5 m telescope, stands
out with 2.2% of papers. This might result from a large
survey program covering a quarter of the sky and the
creation of 3-dimensional maps containing more than
930,000 galaxies and more than 120,000 quasars via
both photometry and spectroscopy (Abazajian et al.,
2009). Although the large fraction of ground-based op-
tical telescopes of D > 8 m (Figure 2 (d)) could be
somewhat biased, if at all, by the second criterion ex-
Table 2: Sub-field Distribution of Astronomical Papers in the Nature and Science Journals from 2006 to 2010
aField N(Nature) N(Science) N(Sum) Percentage [%] Accumulated
Percentage [%]
(1) (2) (3) (4) (5) (6)
Solar System 107 99 206 37.9 37.9
Stars 32 30 62 11.4 49.3
External Galaxies 45 12 57 10.5 59.7
Supernovae and Novae 23 16 39 7.2 66.9
Exoplanets 28 10 38 7.0 73.9
Formation of Stars and the Solar System 13 14 27 5.0 78.9
Interstellar Matter (including Supernova Remnants) 11 12 23 4.2 83.1
Gamma Ray Bursts 17 5 22 4.0 87.1
Cosmology 10 4 14 2.6 89.7
Milky Way Galaxy 8 4 12 2.2 91.9
Star Clusters 7 4 11 2.0 93.9
Sun 6 5 11 2.0 96.0
Active Galactic Nuclei 7 3 10 1.8 97.8
Galaxy Clusters and Large Scale Structure 3 5 8 1.5 99.3
Cosmic Ray 1 2 3 0.6 99.9
Instrumentation 1 0 1 0.2 100
Sum 319 225 544 100 –
a
On the order of percentage.
plained in the first paragraph of this subsection, it is still valuable to note that state-of-the-art facilities and big science (e.g. space telescopes, ground-based opti- cal telescopes of D > 8 m) and dedicated facilities (e.g.
SDSS, Cassini, Voyager, CoRoT) might be one of the critical factors to create high impact papers.
3.4. Papers by Koreans
For the papers published in Nature and Science from 2006 to 2010, we have probed the papers with Korean scientists in the author lists and show the results in Table 4. We extracted papers with authors of Korean names and Korean affiliations.
Table 4 shows that 86 papers (33 for Nature and 53 for Science) have Koreans as the authors, and among them seven papers (two for Nature and five for Science) are astronomy papers written by Korean astronomers.
In total, Korean authors contributed 1.10% of the total 7788 papers published in the two journals. Astronomy papers by Korean authors (N = 7) make up 8.14% of the 86 papers by Korean scientists. While astronomy papers comprise 7.0% of the papers of ‘all’ research
fields in the two journals Nature and Science, as can be seen in Section 3.1, this contribution of Korean as- tronomers to the Korean sciences (at least in the statis- tics of the two journals for the given period) shows a slightly higher percentage than the world normal. If we take only the first author and corresponding author papers, the rate even increases to 11.1% (5/45).
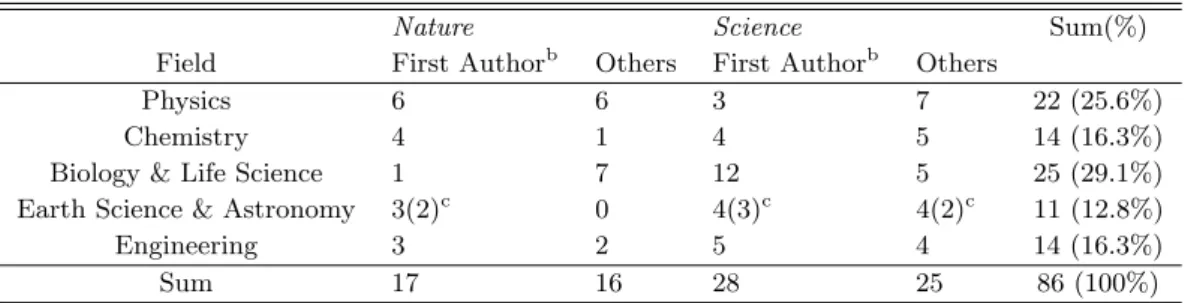
Table 5 shows the number distribution of papers written by Korean scientists in the fields of physics, chemistry (including biochemistry), biology & life sci- ence, earth sciences & astronomy, and engineering (in- cluding materials science). Although biology & life sci- ence is the field of most abundance and earth sciences
& astronomy is the field with least number of papers, the fraction of papers in biology & life science in Korea (29.1%) is much lower than the fraction of this field in the world (Table 1; 4860/7788 = 62.4%). It is also worthwhile to note that astronomy papers make up two thirds (7/11) of the papers in the field of earth sciences
& astronomy.
Table 6 provides a detailed bibliography of the
seven Nature and Science papers written by Korean
Table 3: Facilities Used in the Papers of Nature and Science Journals from 2006 to 2010
Facility Nature Science Sum (%) Accumulated
Percentage [%]
a(1) (2) (3) (4) (5)
no facility used 58 29 87 (16.0) –
ground-based telescope, optical (D > 8 m) 39 18 57 (10.5) 10.5
spacecraft - Cassini 28 18 46 (8.5) 18.9
spacecrafts to Mars 12 23 35 (6.4) 25.4
space telescope, gamma-ray 15 15 30 (5.5) 30.9
space telescope, optical 24 5 29 (5.3) 36.2
space telescope, infrared 18 9 27 (5.0) 41.2
radio telescope 13 11 24 (4.4) 45.6
ground-based telescope, optical (3.0 ≤ D ≤ 4.2 m) 19 3 22 (4.0) 49.6
spacecrafts to Moon 2 20 22 (4.0) 54.0
ground-based telescope, optical (D < 3.0 m) 16 4 20 (3.7) 57.3
space telescope, X-ray 13 7 20 (3.7) 61.0
SDSS 8 4 12 (2.2) 63.2
VLA, VLBA, VLBI 5 7 12 (2.2) 65.4
spacecraft - Others 4 8 12 (2.2) 67.6
spacecraft - Voyager 8 2 10 (1.8) 69.5
ground-based telescope, gamma-ray 3 5 8 (1.5) 70.9
supercomputer 5 3 8 (1.5) 72.4
spacecrafts to Mercury 0 7 7 (1.3) 73.7
spacecrafts to Earth 1 6 7 (1.3) 75.0
ground-based telescope, optical (5.0 ≤ D ≤ 6.5 m) 5 1 6 (1.1) 76.1
CoRoT satellite 4 2 6 (1.1) 77.2
Lunar sample/meteorite 5 1 6 (1.1) 78.3
submm telescope 2 2 4 (0.7) 79.0
space telescope, ultraviolet 3 1 4 (0.7) 79.8
space telescope, Sun observing 1 2 3 (0.6) 80.3
balloon 2 0 2 (0.4) 80.7
ground-based telescope, Sun observing 0 2 2 (0.4) 81.1
ground-based telescope, cosmic ray 0 2 2 (0.4) 81.4
space telescope - Kepler 0 2 2 (0.4) 81.8
spacecrafts to Venus 1 1 2 (0.4) 82.2
space telescope - WMAP 0 1 1 (0.2) 82.3
etc.
b5 4 9 (1.7) 84.0
Total 319 225 544 (100) –
a
Excludes the first row of ‘no facility used’ (16.0%). Accumulation starts from the second item (optical telescope, D > 8 m) and the final sum becomes 84.0%.
b
Includes virtual observatory, Center for High Angular Resolution Astronomy (CHARA interferometer), Navy Prototype
Optical Interferometer (NPOI), dark matter search detector array, Laser Interferometer Gravitational-wave Observatory
(LIGO), composition analyzer, velocimeter, and magnetometer.
Fig. 2.— Pie charts for the facilities used in astronomy papers published in the journals Nature or Science from
2006 to 2010. (a) Facilities for all 544 astronomy papers. Spacecrafts include Lunar sample/meteorite; space telescopes
include balloon and CoRoT satellites; ‘etc.’ includes supercomputer and the last item in Table 3. (b) Sub-distribution of
ground-based telescopes for all wavelength ranges. ‘Optical’ includes the SDSS telescope, and ‘radio & sub-mm’ includes
VLA, VBLA, and VLBI telescopes. (c) Sub-distribution of space telescopes, where ‘etc.’ contains solar telescopes, Kepler,
WMAP, balloons, and the CoRoT satellite. (d) Sub-distribution of ground-based optical telescopes.
astronomers from 2006 and 2010, of which five papers are with first/corresponding authors and the remain- ing two are with co-authors. Among the seven papers, two (Yoon, Yi, & Lee, 2006; Ryu et al., 2008) used no observational facilities; two papers that used GALEX
5as the main facility (Schawinski et al., 2006, 2008) ac- tually used multiple facilities; one paper (Lee, Park, &
Hwang, 2010) used the SDSS data; and the remain- ing two papers (Lee et al., 2009; Gaudi et al., 2008) used small optical telescopes of 1 m class. This status of facilities used by Korean astronomers reflects well the current situation of facilities for the Korean astro- nomical community, and shows (1) participation in one space project (GALEX), (2) use of small ground-based optical telescopes (CTIO 1.0 m and Mt. Lemmon 1.0 m telescopes), (3) use of public archive data (SDSS), and (4) studies without any noticeable facilities. Since the tools that we use to look at the Universe are es- sential in astronomical studies, as can be seen in the Table 3, construction of or participation in more facili- ties/projects will bring a greater number of Nature and Science papers in the future.
While the sub-fields of the seven Nature and Science papers published by Korean astronomers are diverse, it is interesting that three (43%) out of seven papers are on ‘star clusters’. It is true, in general, that scien- tists with more and better facilities produce more and better papers. Nevertheless, considering the fact that these three papers did not use any of the current largest (or most expensive) facilities, this statistic shows that excellence in scholarship is another indispensable ele- ment in its own way.
4. SUMMARY AND DISCUSSION
We have examined the distribution and statistics of ‘ar- ticles’ and ‘letters’ in the journal Nature and ‘research articles’ and ‘reports’ in the journal Science published from 2006 to 2010. The 4004 Nature papers are com- posed of 2683 life science papers and 1321 physical sci- ence papers, among which the latter group contains 319 (8.0% among 4004) astronomy papers. The 3784 Sci- ence papers are made up of 2177 life science papers, 1564 physical science papers, and 43 papers in other fields, where 225 (5.9% among 3784) astronomy papers are included in the physical science papers. In total, astronomy papers comprise 7.0% of the papers for ‘all’
research fields and 18.9% of the papers for the fields of
5Galaxy Evolution Explorer satellite.
‘physical sciences’ in the two journals.
The sub-fields of study for these astronomy pa- pers are as follows: ‘Solar System’ (37.9%) and ‘Stars’
(11.4%) comprise half of the astronomy papers, while the five fields of Solar System, Stars, External Galax- ies, Supernovae and Novae, and Exoplanets make up three quarters.
While 16% of the astronomy papers did not use any noticeable facilities for their research, spacecrafts, space telescopes, and ground-based telescopes were used for 27.0%, 22.8%, and 31.1%, respectively. Such spacecrafts, which explore in detail objects in the So- lar System, might have been an important factor in in- creasing the large number of the research papers in this field. Space telescopes are mainly those in the gamma- ray (24.2%), optical (23.4%), infrared (21.8%), and X- ray (16.1%) wavebands; ground-based telescopes are largely optical (69.2%) and radio (23.7%) telescopes.
The largest (D > 8 m) ground-based optical telescopes produced the greatest number of Nature and Science papers (57/105, 54.3%) among all ground-based tele- scopes. While this value could be affected somewhat, if not much, by one of the facility-selection criteria in Section 3.3 (taking the larger facility as the primary facility for the paper when one large and one small fa- cilities are used in equal amounts), it seems that the order of importance among the ground-based optical telescopes would not change.
From the 4004 Nature and 3784 Science papers, we have extracted 86 papers by Korean authors with Ko- rean affiliations. Among these 86 papers, seven as- tronomy papers (two in Nature and five in Science) are included, making up 8.14% of the 86 Korean pa- pers. While ‘astronomy’ papers comprise 7.0% of the papers for ‘all’ the research fields of the journals Nature and Science, Korean astronomers appear to contribute slightly more (8.14%) to all Korean papers in these two journals.
We anticipate that these results might be used, at least, for establishing criteria to assess leading research groups (especially for astronomy fields), and estimating future production of Nature and Science papers.
ACKNOWLEDGEMENTS
We would like to thank the anonymous referees
for the very helpful comments and clarifications that
helped to improve the manuscript. We would also like
Table 4: Papers Written by Korean Scientists
afrom 2006 to 2010
Journal All Fields
bAstronomy
N (= First Author
c+ Others) N (= First Author
c+ Others)
Nature 33 (= 17 + 16) 2 (= 2 + 0)
0.82%
d(= 0.42%
d+ 0.40%
d) 6.06%
eScience 53 (= 28 + 25) 5 (= 3 + 2)
1.40%
f(= 0.74%
f+ 0.66%
f) 9.43%
gSum 86 (= 45 + 41) 7 (= 5 + 2)
1.10%
h(= 0.58%
h+ 0.53%
h) 8.14%
ia
Korean names and Korean affiliations.
b
Including astronomy.
c
Including corresponding author.
d
Percentage among the 4004 Nature papers from 2006 to 2010.
e
Percentage among the 33 Nature papers by Korean scientists from 2006 to 2010.
f
Percentage among the 3784 Science papers from 2006 to 2010.
g
Percentage among the 53 Science papers by Korean scientists from 2006 to 2010.
h
Percentage among the 7788 Nature and Science papers from 2006 to 2010.
i
Percentage among the 86 papers by Korean scientists from 2006 to 2010.
Table 5: Number of Papers Written by Koreans
ain Each Field
Nature Science Sum(%)
Field First Author
bOthers First Author
bOthers
Physics 6 6 3 7 22 (25.6%)
Chemistry 4 1 4 5 14 (16.3%)
Biology & Life Science 1 7 12 5 25 (29.1%)
Earth Science & Astronomy 3(2)
c0 4(3)
c4(2)
c11 (12.8%)
Engineering 3 2 5 4 14 (16.3%)
Sum 17 16 28 25 86 (100%)
a
Korean names and Korean affiliations.
b
Including corresponding author.
c
The number in parentheses is that for astronomy.
Table 6: Bibliography of Papers Written by Korean Astronomers from 2006 to 2010
a1
bAuthors Schawinski, Kevin; Khochfar, Sadegh; Kaviraj, Sugata; Yi, Sukyoung K.; 15 coauthors ;
Lee, Young-Wook; and 4 coauthors Journal 2006, Nature, 442, 888
Title Suppression of star formation in early-type galaxies by feedback from supermassive black holes Facilities GALEX, SDSS
Subject External Galaxies
2
cAuthors Lee, Jae-Woo; Kang, Young-Woon; Lee, Jina; Lee, Young-Wook Journal 2009, Nature, 462, 480
Title Enrichment by supernovae in globular clusters with multiple populations Facilities CTIO 1.0 m
Subject Star Clusters
3
cAuthors Yoon, Suk-Jin; Yi, Sukyoung Ken; Lee, Young-Wook Journal 2006, Science, 311, 1129
Title Explaining the Color Distributions of Globular Cluster Systems in Elliptical Galaxies Facilities Models
Subject Star Clusters
4
cAuthors Ryu, Dongsu; Kang, Hyesung; Cho, Jungyeon; Das, Santabrata Journal 2008, Science, 320, 909
Title Turbulence and Magnetic Fields in the Large-Scale Structure of the Universe Facilities Simulations
Subject Large-Scale structure
5
cAuthors Lee, Myung Gyoon; Park, Hong Soo; Hwang, Ho Seong Journal 2010, Science, 328, 334
Title Detection of a Large-Scale Structure of Intracluster Globular Clusters in the Virgo Cluster Facilities SDSS
Subject Star Clusters
6
dAuthors Gaudi, B. S.; 19 coauthors ; Han, C.; Kaspi, S.; Lee, C.-U.; 3 coauthors ; Park, B.-G.;
and 47 coauthors Journal 2008, Science, 319, 927
Title Discovery of a Jupiter/Saturn Analog with Gravitational Microlensing Facilities LOAO and many telescopes
Subject Exoplanets
7
dAuthors Schawinski, Kevin; 22 coauthors; Yi, Sukyoung K.
Journal 2008, Science, 321, 223
Title Supernova Shock Breakout from a Red Supergiant Facilities GALEX, CFHT, VLT, Gemini, HST
Subject Supernovae
a
Names of non-Korean authors in the middle of author list are substituted with number of coauthors.
b
Paper with Korean corresponding author (Yi, Sukyoung K.).
c
First author papers.
d