D I A B E T E S & M E T A B O L I S M J O U R N A L
This is an Open Access article distributed under the terms of the Creative Commons At- tribution Non-Commercial License (http://creativecommons.org/licenses/by-nc/3.0/) which permits unrestricted non-commercial use, distribution, and reproduction in any medium, provided the original work is properly cited.
Glycemic Effectiveness of Metformin-Based
Dual-Combination Therapies with Sulphonylurea,
Pioglitazone, or DPP4-Inhibitor in Drug-Naïve Korean Type 2 Diabetic Patients
Young Ki Lee1,2, Sun Ok Song2,3, Kwang Joon Kim1, Yongin Cho1, Younjeong Choi1, Yujung Yun1, Byung-Wan Lee1, Eun-Seok Kang1, Bong Soo Cha1, Hyun Chul Lee1
1Division of Endocrinology and Metabolism, Department of Internal Medicine, Yonsei University College of Medicine, Seoul,
2Department of Medicine, The Graduate School of Yonsei University, Seoul,
3Division of Endocrinology, Department of Internal Medicine, National Health Insurance Corporation Ilsan Hospital, Goyang, Korea
Background: This study compared the glycemic effectiveness of three metformin-based dual therapies according to baseline hemoglobin A1c (HbA1c) to evaluate the appropriateness of the guideline enforced by the National Health Insurance Corpora- tion of Korea for initial medication of type 2 diabetes (T2D).
Methods: This prospective observational study was conducted across 24 weeks for drug-naïve Korean T2D patients with HbA1c greater than 7.5%. Subjects were first divided into three groups based on the agent combined with metformin (group 1, gliclazide- modified release or glimepiride; group 2, pioglitazone; group 3, sitagliptin). Subjects were also classified into three categories ac- cording to baseline HbA1c (category I, 7.5%≤HbA1c<9.0%; category II, 9.0%≤HbA1c<11.0%; category III, 11.0%≤HbA1c).
Results: Among 116 subjects, 99 subjects completed the study, with 88 subjects maintaining the initial medication. While each of the metformin-based dual therapies showed a significant decrease in HbA1c (group 1, 8.9% to 6.4%; group 2, 9.0% to 6.6%;
group 3, 9.3% to 6.3%; P<0.001 for each), there was no significant difference in the magnitude of HbA1c change among the groups. While the three HbA1c categories showed significantly different baseline HbA1c levels (8.2% vs. 9.9% vs. 11.9%; P<0.001), endpoint HbA1c was not different (6.4% vs. 6.6% vs. 6.0%; P=0.051).
Conclusion: The three dual therapies using a combination of metformin and either sulfonylurea, pioglitazone, or sitagliptin showed similar glycemic effectiveness among drug-naïve Korean T2D patients. In addition, these regimens were similarly effec- tive across a wide range of baseline HbA1c levels.
Keywords: Diabetes mellitus, type 2; Metformin; Pioglitazone; Sitagliptin; Sulphonylurea
Corresponding author: Byung-Wan Lee
Department of Internal Medicine, Yonsei University College of Medicine, 50 Yonsei-ro, Seodaemun-gu, Seoul 120-749, Korea
E-mail: [email protected]
INTRODUCTION
In reducing microvascular and macrovascular diabetic com- plications, there has been little controversy on the need for ear- ly intensive glycemic control in subjects with newly detected type 2 diabetes (T2D) since the late 1990s [1]. This consensus
is essentially based on the results of controlled clinical trials, such as the Kumamoto study and UK Prospective Diabetes Study, which are prospective randomized studies including a large number of Asian and Western subjects, respectively [1-3].
However, optimal or recommended regimens regarding the se- lection of hypoglycemic agents to effectively and safely achieve http://dx.doi.org/10.4093/dmj.2013.37.6.465
pISSN 2233-6079 · eISSN 2233-6087
good glycemic status have differed slightly between several guidelines [4-6]. In 2011, the Korean Diabetes Association recommended Clinical Practice Guidelines for T2D in Korea [5]. This guideline recommended lifestyle interventions with metformin as an initial treatment regimen. In addition, initial treatment with a combination of oral hypoglycemic agents (OHAs) or insulin was also recommended at a hemoglobin A1c (HbA1c) level greater than 8.0% at the time of T2D diag- nosis. In the same year, the National Health Insurance Corpo- ration (NHIC) established guidelines to enforce metformin- preferred monotherapy as a general initial treatment regimen and metformin-based dual therapies with sulphonylurea (SU), pioglitazone, or DPP4-inhibitor as an initial regimen at an HbA1c level greater than 7.5%. Recently, Yoon et al. [7] re- ported a reduction in HbA1c level after conducting a double- blind, randomized controlled study over a 48-week period on the efficacy of glimepiride, metformin, and rosiglitazone as antidiabetic monotherapies in drug-naïve, Korean T2D pa- tients. The study showed no statistical difference in the efficacy of glimepiride, metformin, and rosiglitazone as antidiabetic monotherapy. However, there has been no report on the effi- cacy or safety of metformin-based dual combination therapy for drug-naïve or newly detected Korean T2D patients.
This study was designed to evaluate the effectiveness of gly- cemic control in drug-naïve or newly detected Korean T2D patients receiving metformin-based dual combination therapy with SU, pioglitazone, or DPP4-inhibitor.
METHODS
Study design
This prospective, nonrandomized, open-label study was con- ducted at a single center by closely observing metabolic pa- rameters for up to 24 weeks between November 2011 and March 2013. The study protocol entitled ‘Efficacy of antidia- betic medications recommended by government guidelines for newly diagnosed or currently medicated T2D patients on metformin and sulfonylurea’ was reviewed by the local ethics committee (2011-0670-001). To adhere to the guidelines of NHIC and Institutional Review Board for reimbursement, all subjects with an initial HbA1c level ≥7.5% received metformin and were recommended lifestyle modification; however, the selection of another OHA from SU, pioglitazone, or DPP4-in- hibitor was at the discretion of the subjects’ physicians. In ad- dition, physicians also determined all subsequent treatment
decisions according to usual practice. Participants were exam- ined every 12 to 13 weeks for 24 weeks after the initiation of metformin-based dual combination therapy with OHAs.
We included only drug-naïve T2D patients with an initial HbA1c level ≥7.5% who were first-time visitors to the Sever- ance Diabetes Center. In the final analysis, subjects were ex- cluded if they had a recent (≤6 months) history of major car- diovascular event, including myocardial infarction, unstable angina, moderate to severe congestive heart failure, and/or stroke. In addition, patients with a current hepatic (aspartate aminotransferase [AST], and alanine aminotransferase [ALT]
>2.5-fold the upper normal limit), renal (serum creatinine
>1.5 mg/dL in men, >1.4 mg/dL in women), hematologic, or gastrointestinal disease or those that had undergone systemic corticosteroid treatment in the previous 12 weeks were exclud- ed. Subjects recruited for the study were classified into three groups according to the combination of metformin and OHA:
group I (metformin and either gliclazide-MR or glimepiride), group II (metformin and 15 mg pioglitazone), and group III (metformin and 100 mg sitagliptin).
Complete available medical records from other departments or other institutions were reviewed, and laboratory results meeting the criteria for diabetes (fasting serum glucose ≥126 mg/dL, postprandial serum glucose ≥200 mg/dL, or HbA1c
≥6.5%) were regarded as the onset of diabetes. If data were unavailable, the onset and duration of diabetes were deter- mined by subject recall. Subjects underwent a standardized mixed-meal stimulation test (Glucerna; Abbott Laboratories, Saint-Laurent, QC, Canada) (H4S 1Z; 2 cans, total 474 mL, 474 kcal, 26 g fat, 45.8 g carbohydrate, and 19.8 g protein) for the evaluation of glucose metabolism. The glucose level after a mixed-meal stimulation test was regarded as the baseline post- prandial glucose (PPG) level. Plasma glucose level was mea- sured using the glucose oxidase method, and HbA1c was mea- sured with high-performance liquid chromatography using Variant II Turbo (Bio-Rad Laboratories, Hercules, CA, USA).
Plasma triglyceride, total cholesterol, high density lipoprotein cholesterol, blood urea nitrogen, creatinine, AST, and ALT lev- els were assayed with a routine Hitachi 7600 autoanalyzer (Hit- achi Instruments Service, Tokyo, Japan). Low density lipopro- tein cholesterol level was calculated using Friedewald’s equa- tion. Serum insulin and C-peptide levels were measured in du- plicate using immunoradiometric assays (Beckman Coulter, Fullerton, CA, USA) with samples individually collected during the standardized mixed-meal stimulation test. Pancreatic β-cell
function and insulin sensitivity were determined by homeosta- sis model assessment (HOMA) of pancreatic β-cell function (HOMA-β; [baseline insulin (μIU/mL)×20]/[0.055551×fast- ing glucose (mg/dL)–3.5]) and HOMA of insulin resistance (HOMA-IR; [0.055551×fasting glucose (mg/L)×baseline insu- lin (μIU/mL)]/22.5), respectively.
Tolerability and hypoglycemia assessment
Reasons for discontinuation of the study and treatment-in- duced major hypoglycemia were recorded to assess tolerability and compliance. A major hypoglycemic event was defined as blood glucose ≤60 mg/dL accompanied by neurological symp- toms consistent with hypoglycemia or an episode requiring intervention with intravenous glucose. In addition, other mi- nor adverse events were obtained by patient self-report.
Effectiveness assessment
The primary endpoint was change in HbA1c and fasting and PPG levels from baseline to 24 weeks. The secondary endpoint was the frequency of successfully achieved target HbA1c
(≤7.0%) level according to baseline HbA1c.
Statistics
Results are described as mean±standard deviation or median value (low quartile, high quartile). Analysis of variance test was used for comparison of baseline data among the three treatment groups. Kruskal-Wallis test was used for nonpara- metric statistical analysis. Mann-Whitney test with Bonferroni correction was used as post hoc analysis for nonparametric statistical analysis. Wilcoxon signed rank test was used for comparison of pretreatment and posttreatment values. Multi- ple linear regression test and Fisher exact test were performed for comparison of treatment effectiveness. Group I was used as a reference group in the multiple regression test because dual therapy with sulfonylurea and metformin is the most tra- ditional combination. Statistical analyses were performed us- ing SPSS version 20 (IBM Co., Armonk, NY, USA). Differenc- es among groups with P<0.05 were considered statistically significant.
Initial 116 patients
Group II (pioglitazone+metformin)
(n=37)
27 Study end without medication change Group I
(sulfonylurea+metformin) (n=33)
28 Study end without medication change
Group III (sitagliptin+metformin)
(n=46)
33 Study end without medication change Total 99 patients
17 Loss of follow-up
Medication change (n=3) 1 Very good response 1 Insufficient response 1 Hypoglycemia
Medication change (n=3) 1 Insufficient response 1 Gl trouble
1 Other cause
Medication change (n=5) 1 Very good response 3 Insufficient response 1 Gl trouble
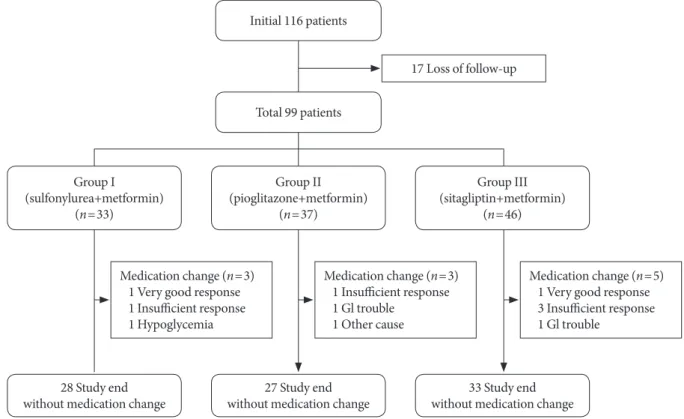
Fig. 1. Flow of the study. A total of 116 patients were enrolled, and 99 subjects were analyzed in the study. Of these patients, 28 in the glimepiride/metformin group, 27 in the pioglitazone/metformin group, and 33 in the sitagliptin/metformin group complet- ed the study without medication change. GI, gastrointestinal.
RESULTS
Baseline characteristics of the study population
Of the 116 subjects who were enrolled in this study, 17 subjects failed to complete follow-up; 99 subjects were ultimately ana- lyzed and were classified into three groups: group I (n=31, metformin and either gliclazide-MR [n=22 (71.0%), 60 (30 to
60) mg] or glimepiride n=9 [29.0%], 4 [2.5 to 4] mg); group II (n=30, metformin and 15 mg pioglitazone), and group III (n=38, metformin and 100 mg sitagliptin) (Fig. 1). The base- line characteristics of the subjects are described in Table 1. The mean age, body mass index (BMI), and median HbA1c level of the study population were 53.2 years, 26.7 kg/m2, and 9.1%, respectively. No significant difference in diabetes duration or Table 1. Baseline characteristics and daily metformin dose
Variable Total (n=99) Group I (n=31) Group II (n=30) Group III (n=38) P value
Demographic characteristics
Age, yr 53.2±12.1 54.8±11.6 55.2±9.7 50.2±13.7 0.160
Male sex 58 (58.6) 16 (51.6) 18 (60.0) 24 (63.2) 0.615
Diabetes duration, mo 1 (0, 12) 1 (0, 12) 5 (1, 19) 1 (0, 6) 0.377
Anthropometric characteristics
Height, cm 164.0±9.5 161.9±9.8 164.7±9.2 165.2±9.5 0.332
Weight, kg 72.1±13.0 69.9±15.4 71.4±11.8 74.5±11.6 0.332
BMI, kg/m2 26.±3.7 26.5±4.1 26.3±3.3 27.3±3.8 0.472
Waist-to-hip ratio 0.93 (0.90, 0.96) 0.93 (0.90, 0.96) 0.92 (0.90, 0.99) 0.94 (0.90, 0.96) 0.945 Blood pressure
Systolic, mm Hg 127.6±15.0 122.5±13.4 131.4±17.7 128.8±12.9 0.054
Diastolic, mm Hg 79.7±11.0 77.0±8.0 81.9±13.6 80.2±10.6 0.209
Metabolic characteristics
FBS, mg/dL 173.0 (137.0, 211.0) 169.0 (141.0, 195.5) 170.5 (144.0, 211.0) 177.5 (135.0, 254.0) 0.605 PPG, mg/dL 251.0 (196.0, 315.0) 227.0 (199.0, 312.0) 240.5 (195.0, 317.0) 259.5 (198.0, 314.0) 0.704
HbA1c, % 9.1 (8.2, 10.6) 8.9 (8.2, 10.2) 8.8 (8.3, 11.2) 9.4 (7.9,11.1) 0.853
Total cholesterol, mg/dL 195.1±47.1 193.5±46.7 184.1±43.9 205.2±48.9 0.182
Triglyceride, mg/dL 133.0 (95.0, 232.0) 116.0 (90.5, 166.0) 132.5 (91.0, 168.0) 168.0 (107.0, 250.0) 0.116 HDL-C, mg/dL 43.0 (38.0, 49.0) 46.0 (41.5, 52.5) 40.0 (37, 49.0) 42 (39.0, 49.0) 0.187
LDL-C, mg/dL 109.1±45.9 113.9±48.8 99.3±36.5 113.0±49.8 0.371
HOMA-β 26.8 (17.5, 41.0) 24.3 (17.6, 48.8) 34.2 (19.7, 44.7) 25.6 (13.7, 38.7) 0.630
HOMA-IR 3.2 (2.5, 5.1) 3.0 (2.1, 3.9) 3.3 (2.8, 6.3) 3.6 (2.5, 5.6) 0.213
Miscellaneous
BUN, mg/dL 14.4±3.5 14.2±3.5 14.4±3.4 14.6±3.7 0.896
Creatinine, mg/dL 0.83±0.19 0.80±0.20 0.83±0.20 0.85±0.18 0.644
AST 22.0 (17.8, 31.0) 23.0 (18.0, 30.5) 22.5 (18.0, 32.0) 21.0 (17.0, 24.0) 0.683
ALT 25.5 (19.8, 37.5) 28.0 (20.5, 51.5) 25.5 (20.0, 39.0) 25.0 (20.0, 34.0) 0.694
Medication dose
Metformin, mg 1,000 (1,000, 1,700) 1,000 (1,000, 1,000) 1,000 (1,000, 1,700) 1,000 (1,000, 1,700) 0.006 Values are presented as mean±standard deviation, number (%), or median (low quartile, high quartile). Analysis of variance test was used for parametric analysis and Kruskal-Wallis test for nonparametric analysis.
BMI, body mass index; FBS, fasting blood glucose; PPG, postprandial glucose; HbA1c, hemoglobin A1c; HDL-C, high density lipoprotein cho- lesterol; LDL-C, low density lipoprotein cholesterol; HOMA-β, homeostasis model assessment of β-cell function; HOMA-IR, homeostasis model assessment of insulin resistance; BUN, blood urea nitrogen; AST, aspartate aminotransferase; ALT, alanine aminotransferase.
baseline demographics, anthropometrics, or metabolic char- acteristics was observed among the three groups. Daily met- formin dose was smaller in group I than the other two groups (overall, P=0.006; group I vs. group II, P=0.001; group I vs.
group III, P=0.012; group II vs. group III, P=0.064).
Tolerability and hypoglycemia assessment
The proportion of participants who completed the study with- out change in dose or class of initial medications was 90.3% in the SU-treated group I (28/31), 90% in the pioglitazone-treat- ed group II (27/30), and 86.8% in the sitagliptin-treated group III (33/38). There was no significant difference in study com- pletion rate among the groups (P=0.925). In group I, one sub- ject discontinued the study due to very good response and subsequent reduction of medications and another due to in- sufficient response. In addition, one subject with symptoms of hypoglycemia was prescribed other drugs. In group II, one subject with an insufficient response, one subject with nausea, and one subject concerned with the risk of bladder cancer were switched to other drugs. In group III, one subject with a very good response, three subjects with an insufficient response, and one subject with nausea were switched to other drugs. No major hypoglycemic events occurred among the groups. In addition, one patient in group II reported transient diarrhea, but no other adverse events were reported.
Effectiveness assessment Primary outcome
In the 88 patients who completed the study without change of initial medications, the median HbA1c level decreased from 8.9% (8.2 to 10.3) to 6.5% (6.4 to 7.0; at 12-week) and to 6.4%
(6.0 to 6.7; at 24-week) in the SU-treated group I (P<0.001 for each); from 9.0% (8.4 to 11.2) to 6.8% (6.5 to 7.3; at 12-week) and to 6.6% (6.1 to 6.9; at 24 weeks) in the pioglitazone-treated group II (P<0.001 for each); and from 9.3% (7.8 to 10.4) to 6.4%
(6.3 to 7.0; at 12-week) and to 6.3% (6.0 to 6.7; at 24-week) (P<
0.001 for each) in the sitagliptin-treated group III (Fig. 2). The median of individually assessed differences in HbA1c level from baseline to the 12- and 24-week end points were -2.2%
(-3.7 to -1.8) and -2.5% (-4.0 to -1.9) in group I; -2.2% (-3.8 to -1.5) and -2.8% (-4.5 to -1.6) in group II; and -2.1% (-4.0 to -1.6) and -2.7% (-4.0 to -1.6) in group III, respectively. In ad- dition, there was no significant difference in the change of HbA1c level of group II and III compared to group I after ad- justing for baseline age, sex, BMI, and HbA1c at either the 12-
week (group II, P=0.101; group III, P=0.673) or 24-week end point (group II, P=0.066; group III, P=0.678) (Table 2, Fig. 2).
However, after additional adjustment of metformin dose, group I showed superiority in HbA1c improvement to group II at the 24-week end point (covariate-adjusted difference in change of HbA1c, 0.35%; P=0.046) (Table 2). Fasting plasma glucose level decreased from 166.5 (139.0 to 195.0) to 103.5 mg/dL (89.0 to 112.0) (P<0.001); 174.0 (145.0 to 223.0) to 111.0 mg/dL (101.5 to 120.0) (P<0.001); and 173.0 (135.0 to 204.0) to 105.0 mg/dL (100.0 to 124.0) (P<0.001) in groups I, II, and III, re- spectively. PPG level decreased from 226.5 (192.5 to 312.0) to 157.0 mg/dL (133.5 to 196.5) (P<0.001); 238.0 (195.5 to 324.0) to 157.0 mg/dL (124.0 to 219.5) (P<0.001); and 251.0 (196.0 to 306.0) to 148.0 mg/dL (115.0 to 172.0) (P<0.001) in groups I, II, and III, respectively. In addition, there was no significant difference in the change of FBG (group II, P=0.061; group III, P=0.070) or PPG (group II, P=0.914; group III, P=0.237) lev- el among the groups after adjusting for baseline age, sex, BMI, and FBG or PPG. After additional adjustment of metformin dose, group I showed superiority in FBG improvement to group II and group III (covariate-adjusted difference in change of FBG: group 2, 15.9 mg/dL, P=0.008; group 3, 11.6 mg/dL, P=0.032), without significant difference in the change of PPG level.
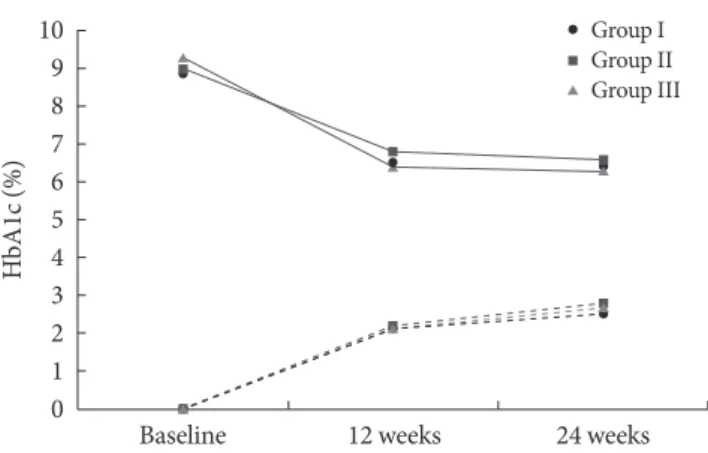
Fig. 2. Change in hemoglobin A1c (HbA1c) from baseline to 24 weeks. Solid lines indicate the median HbA1c level, and broken lines indicate the median of individually assessed dif- ferences in HbA1c level from baseline. Multiple linear regres- sion was used for statistical analysis, and group I was used as a reference group. The change of HbA1c was not statistically dif- ferent among groups at 12 weeks (group II, P=0.101; group III, P=0.673) or 24 weeks (group II, P=0.066; group III, P=0.678) after adjustment for baseline age, sex, body mass index, and baseline HbA1c level.
10 9 8 7 6 5 4 3 2 1
0 Baseline 12 weeks 24 weeks
Group I Group II Group III
HbA1c (%)
The proportion of individuals who achieved HbA1c level
≤7% at 24 weeks was 89.3%, 81.5%, and 84.8% in groups I, II, and III, respectively, with no statistically significant difference in the proportion among the groups (P=0.649) (Fig. 3A). To minimize selection bias, we performed an additional analysis.
Subjects who achieved HbA1c level ≤7% at 24 weeks and those
who reduced their medications because of a very good response during the study period were considered to have successfully controlled diabetes; however, other subjects, with the excep- tion of those who did not continue with follow-up observation, were considered to have failed diabetes control. The proportion of individuals with successfully controlled diabetes was 83.9%, 73.3%, and 76.3% in groups I, II, and III, respectively, with no statistically significant difference among the groups (P=0.593) (Fig. 3B).
Group I (n=28) Group II (n=27) Group III (n=33) 10090
8070 6050 4030 2010 0
%
A
89.3 81.5
P=0.649
Proportions of individuals achieving HbA1c ≤7%
84.8
Group I (n=31) Group II (n=30) Group III (n=38) 10090
8070 6050 4030 2010 0
%
B 83.9
73.3 P=0.593
Proportions of overall successful diabetes control
76.3
Fig. 3. (A) The proportions of individuals who achieved hemo- globin A1c (HbA1c) level ≤7% at 24 weeks, and (B) the pro- portions of individuals with overall successful diabetes control according to medication. (A) Dark gray bar indicates the pro- portion of individuals who achieved an HbA1c level ≤7%
among those who did not change medications by the end of the study. Fisher exact test was used to compare the three groups, and there was no significant difference (P=0.649). (B) Light gray bar indicates the proportion of individuals, among the to- tal number of subjects who initially enrolled in the study, except for those who did not continue with follow-up observation, who achieved an HbA1c level ≤7% at 24 weeks or reduced medication during the study period because of a very good re- sponse. The Fisher exact test was used to compare the three groups, and there was no significant difference (P=0.593).
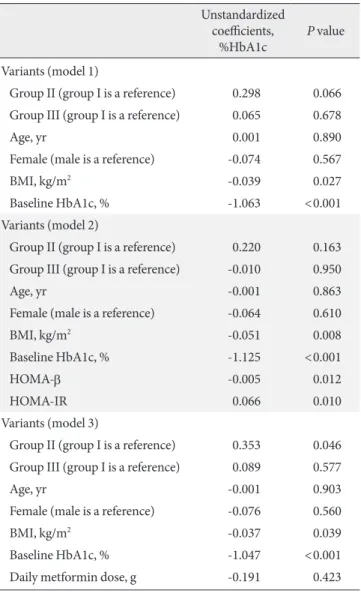
Table 2. Covariate-adjusted differences in change of hemoglo- bin A1c
Unstandardized coefficients,
%HbA1c P value
Variants (model 1)
Group II (group I is a reference) 0.298 0.066 Group III (group I is a reference) 0.065 0.678
Age, yr 0.001 0.890
Female (male is a reference) -0.074 0.567
BMI, kg/m2 -0.039 0.027
Baseline HbA1c, % -1.063 <0.001
Variants (model 2)
Group II (group I is a reference) 0.220 0.163 Group III (group I is a reference) -0.010 0.950
Age, yr -0.001 0.863
Female (male is a reference) -0.064 0.610
BMI, kg/m2 -0.051 0.008
Baseline HbA1c, % -1.125 <0.001
HOMA-β -0.005 0.012
HOMA-IR 0.066 0.010
Variants (model 3)
Group II (group I is a reference) 0.353 0.046 Group III (group I is a reference) 0.089 0.577
Age, yr -0.001 0.903
Female (male is a reference) -0.076 0.560
BMI, kg/m2 -0.037 0.039
Baseline HbA1c, % -1.047 <0.001
Daily metformin dose, g -0.191 0.423
In model 1, which adjusts for baseline age, sex, BMI, and HbA1c, there was no significant difference between groups in change of HbA1c (group II, P=0.066; group III, P=0.678). Additional adjustment of HOMA-β and HOMA-IR did not alter the statistical significance.
However, after additional adjustment of daily metformin dose, group II showed a statistically smaller reduction in HbA1c than group I (covariate-adjusted difference in change of HbA1c, 0.35%; P=0.046).
HbA1c, hemoglobin A1c; BMI, body mass index; HOMA-β, homeo- stasis model assessment of β-cell function; HOMA-IR, homeostasis model assessment of insulin resistance.
Secondary and other outcomes
The subjects were also classified into three categories accord- ing to HbA1c level: category I (n=43; 7.5%≤HbA1c<9.0%), category II (n=23; 9.0%≤HbA1c<11.0), and category III (n=22; 11.0%≤HbA1c) (Table 3). In addition to different HbA1c level (8.1% vs. 9.9% vs. 11.6%; P<0.001), HOMA-β (34.2 vs. 25.6 vs. 19.8; P=0.008), and HOMA-IR (2.8 vs. 3.6 vs.
3.5; P=0.005) were also significantly different among the cate- gories. The daily dose of metformin was higher in category III than in the other two categories (1,000 mg vs. 1,000 mg vs.
1,700 mg; P<0.001). Despite the difference in baseline HbA1c level and HOMA, no statistically significant difference was ob- served among the categories after 24 weeks (6.4% [6.1 to 6.8]
vs. 6.6% [6.2 to 6.7] vs. 6.0% [5.7 to 6.6)], P=0.051) (Fig. 4).
The proportion of individuals who achieved HbA1c ≤7% at 24 weeks was 83.7%, 87.0%, and 86.4% in categories I, II, and III, respectively, with no statistically significant difference among the categories (P=1.000) (Fig. 5A). The proportion of individuals with overall successful diabetes control, as defined above, was 75.0%, 81.5%, 79.2% and similar among categories I, II, and III, respectively (P=0.819) (Fig. 5B).
DISCUSSION
It is well known that significant prevention and reduction of mi- crovascular and macrovascular complications can be achieved with early intensive glycemic control in subjects with newly detected T2D [1,3]. However, to date, scientific studies investi- gating an optimal combination regimen for metformin-based
OHA therapy and its glucose-lowering efficacy have been es- pecially lacking in Korean subjects with T2D. On the basis of previous research, this study focused on the practical implica- tions of a combination regimen for metformin-based OHA therapy in newly diagnosed or drug-naïve Korean T2D pa- tients. Therefore, we attempted to investigate: 1) the tolerabili- ty and efficacy of metformin-based dual combination therapy with OHAs by assessing the reduction of HbA1c level as well as the proportion of subjects reaching a target HbA1c level
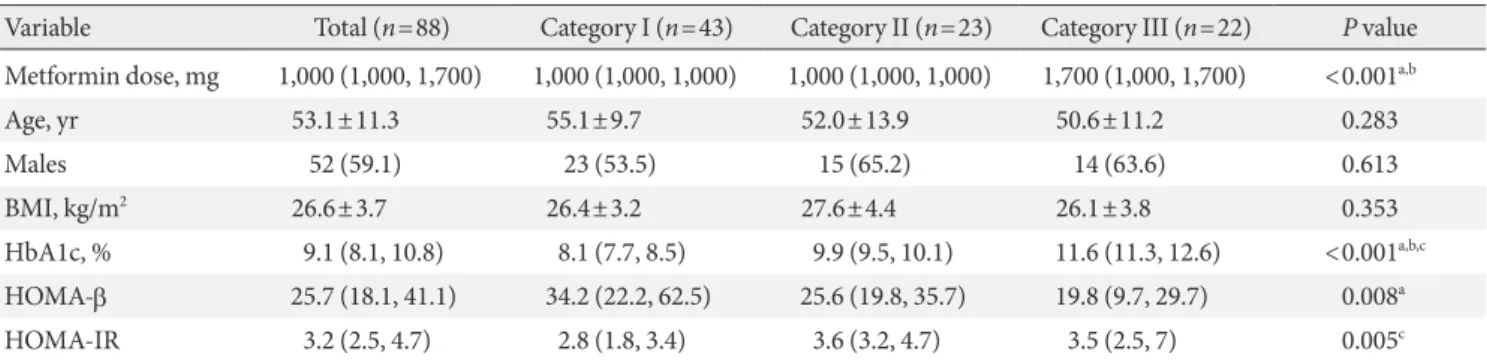
≤7%; and 2) the appropriateness of current guidelines estab- lished by the NHIC of Korea, which mandates the number of Table 3. Baseline characteristics and daily metformin dose of three categories according to baseline hemoglobin A1c level
Variable Total (n=88) Category I (n=43) Category II (n=23) Category III (n=22) P value Metformin dose, mg 1,000 (1,000, 1,700) 1,000 (1,000, 1,000) 1,000 (1,000, 1,000) 1,700 (1,000, 1,700) <0.001a,b
Age, yr 53.1±11.3 55.1±9.7 52.0±13.9 50.6±11.2 0.283
Males 52 (59.1) 23 (53.5) 15 (65.2) 14 (63.6) 0.613
BMI, kg/m2 26.6±3.7 26.4±3.2 27.6±4.4 26.1±3.8 0.353
HbA1c, % 9.1 (8.1, 10.8) 8.1 (7.7, 8.5) 9.9 (9.5, 10.1) 11.6 (11.3, 12.6) <0.001a,b,c HOMA-β 25.7 (18.1, 41.1) 34.2 (22.2, 62.5) 25.6 (19.8, 35.7) 19.8 (9.7, 29.7) 0.008a
HOMA-IR 3.2 (2.5, 4.7) 2.8 (1.8, 3.4) 3.6 (3.2, 4.7) 3.5 (2.5, 7) 0.005c
Values are presented as median (low quartile, high quartile), mean±standard deviation, or number (%). Analysis of variance test was used for parametric analysis and Kruskal-Wallis test for nonparametric analysis.
BMI, body mass index; HbA1c, hemoglobin A1c; HOMA-β, homeostasis model assessment of β-cell function; HOMA-IR, homeostasis model assessment of insulin resistance.
aStatistical significance (P<0.017) in post hoc analysis (Mann-Whitney test with Bonferroni correction) was indicated by category I vs. III, bCat- egory II vs. III, cCategory I vs. II.
Fig. 4. Change in hemoglobin A1c (HbA1c) according to base- line HbA1c level. Dark gray bar indicates the level at baseline and light gray bar at 24 weeks. Bars represent medians (low quartile, high quartile). Despite different initial HbA1c levels (8.2% vs. 9.9% vs. 11.9%; P<0.001), HbA1c level in each cate- gory after 24 weeks of treatment demonstrated no statistical difference by Kruskal-Wallis test (6.4% vs. 6.6% vs. 6.0%; P=
0.051).
Category I (n=43) Category II (n=23) Category III (n=22) 14
12 10 8 6 4 2 0
HbA1c (%)
8.1 6.4
9.9 6.6
11.6
6.0
OHAs prescribed by analyzing the proportion of subjects reaching a target HbA1c level ≤7% according to initial HbA1c.
In this study, 99 Korean T2D subjects who were newly diag- nosed with the disease or who were drug-naïve underwent dual therapy with a combination of metformin and OHA (SU [either gliclazide-MR or glimepiride], 15 mg pioglitazone, or 100 mg sitagliptin) over a 24-week study period. By the end of the study, the percentage of subject with initial HbA1c level
≥7.5% decreased by 2.5% to 2.7%. In previous studies, most OHAs decreased HbA1c level by about 1% when used as a monotherapy, and by about 2% when used as a combination therapy [8,9]. The differences between our results and those of previous studies might be due to the higher baseline HbA1c levels, drug-naïve characteristics, and lower insulin resistance of our subjects. Our study did not exclude subjects with very high HbA1c level, unlike many previous studies which set an upper limit of initial HbA1c [10-12]. Moreover, the baseline HbA1c (9.1%) of our study was higher than those of most pre- vious studies (7.6% to 8.8%) [10-15]. Because initial HbA1c level did not alter the endpoint HbA1c level in our study, this higher baseline HbA1c seems to have mostly affected the de- gree of HbA1c reduction. Contrary to many studies evaluating patients taking OHA prior to the study, which reported higher HbA1c (6.9% to 7.2%) at endpoint than our study [13,14], sev- eral studies evaluating drug-naïve diabetes patients observed final HbA1c levels of about 6.5% after using a combination of
two drugs, which is similar to our results [10-12]. The HOMA- IR of our study (3.2) was lower than those of previous studies (3.6 to 7.0) [12-14,16]. Even though HOMA-IR has limited value when compared across different populations [17], this finding may suggest that our subjects had better insulin sensi- tivity than subjects in previous studies.
In the aspects of tolerability and glycemic effectiveness, the three dual therapies using a combination of metformin and ei- ther sulfonylurea, pioglitazone, or sitagliptin led to similar proportions of subjects adhering to the initial regimen, similar degrees of HbA1c improvement, and similar proportions of subjects reaching the target HbA1c level. However, after ad- justment of daily metformin dose, which was determined ac- cording to physician judgment in usual practice, sulfonylurea reduced HbA1c by a greater magnitude than did pioglitazone.
This finding suggests that pioglitazone and metformin combi- nation could partially overcome the lower intrinsic potency of pioglitazone by using a higher dose of metformin in real prac- tice.
Interestingly, baseline HbA1c level did not affect the endpoint HbA1c level in this study. Moreover, the proportion of indi- viduals who reached a target HbA1c level ≤7.0% was similar across the groups, although their baseline HbA1c levels were significantly different. It is well known that patients with high- er baseline HbA1c level have greater reduction of HbA1c irre- spective of drug class [18,19]. Because each drug results in a
Category I (n=43) Category II (n=23) Category III (n=22) 10090
8070 6050 4030 2010 0
%
A
83.7 87.0
P=1.000
Proportions of individuals achieving HbA1c ≤7%
86.4
Category I (n=48) Category II (n=27) Category III (n=24) 10090
8070 6050 4030 2010 0
%
B
75.0 81.5
P=0.819
Proportions of overall successful diabetes control
79.2
Fig. 5. (A) The proportions of individuals who achieved an hemoglobin A1c (HbA1c) level ≤7% at 24 weeks, and (B) the propor- tions of individuals with overall successful diabetes control according to baseline HbA1c level. Category I, 7.5%≤HbA1c<9.0;
category II, 9.0%≤HbA1c<11.0; category III, 11.0%≤ HbA1c. (A) Dark gray bar indicates the proportion of individuals who achieved an HbA1c level ≤7% among those who did not change medications by the end of the study. Fisher exact test was used to compare the three groups, and there was no significant difference (P=1.000). (B) Light gray bar indicates the proportion of in- dividuals, among the total number subjects who initially enrolled in the study, except for those who did not continue with follow- up observation, who achieved an HbA1c level ≤7% at 24 weeks or reduced medication during the study period because of a very good response. Fisher exact test was used to compare the three groups, and there was no significant difference (P=0.819).
greater reduction of HbA1c according to higher baseline HbA1c, when two drugs are used simultaneously, the increased reduc- tion of HbA1c according to higher baseline HbA1c might show a greater magnitude due to the additive effect. This ten- dency was also shown in previous studies, even though statis- tical analysis was not performed [10,19]. Another possible ex- planation is preserved insulin sensitivity of the study patients.
HOMA-IR of subjects with the highest initial HbA1c level was 3.5 in this study, which was relatively lower than reported in other studies (3.6 to 7.0) which have assessed the efficacy of dual regimens [12-15]. In our study, a one unit increase of HOMA-IR resulted in a 0.066%, increase of HbA1c at end- point. The other explanation is the higher metformin dose for patients with higher initial HbA1c level. These results indicate that, even at a very high baseline HbA1c level, therapy with a combination of two drugs may still be effective in drug-naïve subjects whose insulin sensitivity remains preserved. This finding supports the current guidelines for OHA selection, which do not recommend initial therapy using a combination of three OHAs [4-6].
This study has several limitations. The patients were not randomized, and the criteria for changing medications were not uniform because all treatment decisions were determined by diabetologists specifically for each patient. However, the baseline characteristics of the three groups did not show statis- tically significant differences. Furthermore, supplemental anal- ysis of all subjects, except for those who did not continue with follow-up observation, showed similar statistical results to the analysis of subjects who did not change their medications throughout the study. In addition, the number of participants was small, and the rate of follow-up loss was 14.7% at the end of the study. Therefore, the reliability of our trial was lower than originally expected at the time the study was first de- signed.
In conclusion, metformin-based dual combination thera- pies with OHAs including sulfonylurea, pioglitazone, or sita- gliptin showed similar glycemic effectiveness in drug-naïve Korean subjects with newly diagnosed T2D. Combination therapy using these OHA drugs was similarly effective in pa- tients with a wide range of initial HbA1c level. Based on these results, we suggest the appropriateness of the current guide- lines established by the NHIC of Korea, which do not allow initial three drug combinations and recommend metformin- based dual combination therapy with OHAs including sulfo- nylurea, pioglitazone, or DPP4-inhibitor in subjects with ini-
tial HbA1c level ≥7.5%. This study is the first to compare the glycemic effectiveness of dual combination agents commonly used as primary medications in Korean T2D patients. An ad- ditional randomized study with a larger number of subjects is warranted to obtain more detailed information including glu- cose variability.
CONFLICTS OF INTEREST
No potential conflict of interest relevant to this article was re- ported.
REFERENCES
1. UK Prospective Diabetes Study (UKPDS) Group. Effect of in- tensive blood-glucose control with metformin on complications in overweight patients with type 2 diabetes (UKPDS 34). Lan- cet 1998;352:854-65.
2. Holman RR, Paul SK, Bethel MA, Neil HA, Matthews DR.
Long-term follow-up after tight control of blood pressure in type 2 diabetes. N Engl J Med 2008;359:1565-76.
3. Ohkubo Y, Kishikawa H, Araki E, Miyata T, Isami S, Motoyo- shi S, Kojima Y, Furuyoshi N, Shichiri M. Intensive insulin therapy prevents the progression of diabetic microvascular complications in Japanese patients with non-insulin-depen- dent diabetes mellitus: a randomized prospective 6-year study.
Diabetes Res Clin Pract 1995;28:103-17.
4. Rodbard HW, Jellinger PS, Davidson JA, Einhorn D, Garber AJ, Grunberger G, Handelsman Y, Horton ES, Lebovitz H, Levy P, Moghissi ES, Schwartz SS. Statement by an American Association of Clinical Endocrinologists/American College of Endocrinology consensus panel on type 2 diabetes mellitus: an algorithm for glycemic control. Endocr Pract 2009;15:540-59.
5. Ko SH, Kim SR, Kim DJ, Oh SJ, Lee HJ, Shim KH, Woo MH, Kim JY, Kim NH, Kim JT, Kim CH, Kim HJ, Jeong IK, Hong EK, Cho JH, Mok JO, Yoon KH; Committee of Clinical Prac- tice Guidelines, Korean Diabetes Association. 2011 clinical practice guidelines for type 2 diabetes in Korea. Diabetes Metab J 2011;35:431-6.
6. Inzucchi SE, Bergenstal RM, Buse JB, Diamant M, Ferrannini E, Nauck M, Peters AL, Tsapas A, Wender R, Matthews DR;
American Diabetes Association (ADA); European Association for the Study of Diabetes (EASD). Management of hyperglyce- mia in type 2 diabetes: a patient-centered approach: position statement of the American Diabetes Association (ADA) and
the European Association for the Study of Diabetes (EASD).
Diabetes Care 2012;35:1364-79.
7. Yoon KH, Shin JA, Kwon HS, Lee SH, Min KW, Ahn YB, Yoo SJ, Ahn KJ, Park SW, Lee KW, Sung YA, Park TS, Kim MS, Kim YK, Nam MS, Kim HS, Park Ie B, Park JS, Woo JT, Son HY.
Comparison of the efficacy of glimepiride, metformin, and rosiglitazone monotherapy in Korean drug-naive type 2 dia- betic patients: the practical evidence of antidiabetic mono- therapy study. Diabetes Metab J 2011;35:26-33.
8. Bennett WL, Maruthur NM, Singh S, Segal JB, Wilson LM, Chatterjee R, Marinopoulos SS, Puhan MA, Ranasinghe P, Block L, Nicholson WK, Hutfless S, Bass EB, Bolen S. Com- parative effectiveness and safety of medications for type 2 dia- betes: an update including new drugs and 2-drug combinations.
Ann Intern Med 2011;154:602-13.
9. Bennett WL, Balfe LM, Faysal JM. AHRQ’s comparative effec- tiveness research on oral medications for type 2 diabetes: a summary of the key findings. J Manag Care Pharm 2012;18(1 Suppl A):1-22.
10. Garber AJ, Donovan DS Jr, Dandona P, Bruce S, Park JS. Effi- cacy of glyburide/metformin tablets compared with initial monotherapy in type 2 diabetes. J Clin Endocrinol Metab 2003;
88:3598-604.
11. Rosenstock J, Rood J, Cobitz A, Biswas N, Chou H, Garber A.
Initial treatment with rosiglitazone/metformin fixed-dose combination therapy compared with monotherapy with either rosiglitazone or metformin in patients with uncontrolled type 2 diabetes. Diabetes Obes Metab 2006;8:650-60.
12. Goldstein BJ, Feinglos MN, Lunceford JK, Johnson J, Wil- liams-Herman DE; Sitagliptin 036 Study Group. Effect of ini-
tial combination therapy with sitagliptin, a dipeptidyl pepti- dase-4 inhibitor, and metformin on glycemic control in pa- tients with type 2 diabetes. Diabetes Care 2007;30:1979-87.
13. Tosi F, Muggeo M, Brun E, Spiazzi G, Perobelli L, Zanolin E, Gori M, Coppini A, Moghetti P. Combination treatment with metformin and glibenclamide versus single-drug therapies in type 2 diabetes mellitus: a randomized, double-blind, compar- ative study. Metabolism 2003;52:862-7.
14. Kaku K. Efficacy and safety of therapy with metformin plus pi- oglitazone in the treatment of patients with type 2 diabetes: a double-blind, placebo-controlled, clinical trial. Curr Med Res Opin 2009;25:1111-9.
15. Rhee EJ, Lee WY, Min KW, Shivane VK, Sosale AR, Jang HC, Chung CH, Nam-Goong IS, Kim JA, Kim SW; Gemigliptin Study 006 Group. Efficacy and safety of the dipeptidyl pepti- dase-4 inhibitor gemigliptin compared with sitagliptin added to ongoing metformin therapy in patients with type 2 diabetes inadequately controlled with metformin alone. Diabetes Obes Metab 2013;15:523-30.
16. Rhee SY, Woo JT. The prediabetic period: review of clinical as- pects. Diabetes Metab J 2011;35:107-16.
17. Wallace TM, Levy JC, Matthews DR. Use and abuse of HOMA modeling. Diabetes Care 2004;27:1487-95.
18. Bloomgarden ZT, Dodis R, Viscoli CM, Holmboe ES, Inzucchi SE. Lower baseline glycemia reduces apparent oral agent glucose- lowering efficacy: a meta-regression analysis. Diabetes Care 2006;29:2137-9.
19. Deacon CF. Dipeptidyl peptidase-4 inhibitors in the treatment of type 2 diabetes: a comparative review. Diabetes Obes Metab 2011;13:7-18.