D I A B E T E S & M E T A B O L I S M J O U R N A L
This is an Open Access article distributed under the terms of the Creative Commons At- tribution Non-Commercial License (http://creativecommons.org/licenses/by-nc/3.0/) which permits unrestricted non-commercial use, distribution, and reproduction in any medium, provided the original work is properly cited.
Arterial Stiffness by Aerobic Exercise Is Related with Aerobic Capacity, Physical Activity Energy Expenditure and Total Fat but not with Insulin Sensitivity in Obese Female Patients with Type 2 Diabetes
Ji Yeon Jung1,*, Kyung Wan Min2,*, Hee Jung Ahn1, Hwi Ryun Kwon1, Jae Hyuk Lee2, Kang Seo Park2, Kyung Ah Han2
1Diabetes Center, Eulji General Hospital, Seoul,
2Department of Internal Medicine, Eulji University School of Medicine, Daejeon, Korea
Background: Arterial stiffness is an important factor in atherosclerosis. Thus we examined whether aerobic exercise could re- duce arterial stiffness in obese women with type 2 diabetes without diabetic complication.
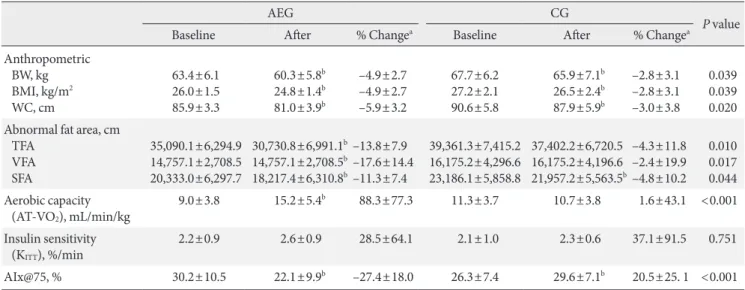
Methods: A total of 35 women with type 2 diabetes (body mass index, 26.6±2.8 kg/m2; age, 56.4±1.9 years; duration of diabetes, 4.7±4.8 years) were assigned to aerobic exercise group (AEG) or control group (CG). AEG completed a 12-week exercise pro- gram (3.6 to 5.2 metabolic equivalents, 3 day/week, 60 min/day), with their exercise activities monitored by accelerometers. We measured abdominal total fat area (TFA), visceral fat area (VFA), and subcutaneous fat area (SFA) by computed tomography, in- sulin sensitivity by insulin tolerance test (KITT), and augmentation index (AIx) by SphygmoCor at baseline and at the end of the 12-week program.
Results: The AIx was improved in the AEG compared with the CG (P<0.001). The percent change of AIx had significant corre- lation with the improvement of physical activity energy expenditure (PAEE), aerobic capacity, TFA, and SFA (r=–0.416, P=0.013; r=0.560, P<0.001; r=0.489, P=0.003; r=0.531, P=0.001, respectively), but not with insulin sensitivity, energy intake, or VFA.
Conclusion: Improvement in aortic stiffness by aerobic exercise is related with the improvement of aerobic capacity, PAEE, and total fat but not with insulin sensitivity or energy intake in obese women with type 2 diabetes.
Keywords: Abdominal fat; Augmentation index; Diabetes mellitus, type 2; Moderate aerobic exercise; Vascular stiffness
Corresponding author: Kyung Ah Han
Department of Internal Medicine, Eulji University School of Medicine, 77 Gyeryong-ro 771beon-gil, Jung-gu, Daejeon 301-746, Korea E-mail: [email protected]
*Ji Yeon Jung and Kyung Wan Min contributed equally to this study as
INTRODUCTION
Diabetes is major global public health concern that affects 347 million people have diabetes worldwide [1], which is correlat- ed with increasing cardiovascular disease that is responsible for 52% deaths in type 2 diabetes [2]. In addition, people with type diabetes are also at a 2 to 4 times higher risk of developing cardiovascular diseases compared with the normal population
[3]. The highest prevalence of cardiovascular disease occurred among people with diabetes when hyperglycemia is accompa- nied by other risk factors such as hypertension, dyslipidemia, hyperinsulinemia, and obesity [4]. Especially, obesity is an in- dependent risk factor for cardiovascular diseases [5]. However, reducing weight in obese patients with type 2 diabetes has been shown to be effective in minimizing cardiovascular disease-re- lated deaths [5]. Therefore, losing weight in obese patients with http://dx.doi.org/10.4093/dmj.2014.38.6.439
pISSN 2233-6079 · eISSN 2233-6087
type 2 diabetes will be effective in preventing cardiovascular diseases. In patients with type 2 diabetes, increased arterial stiffness is regarded as an early stage of arteriosclerosis and it is also regarded as a risk factor and prognostic marker for cardio- vascular diseases [6]. Recently, a method of measuring aug- mentation index (AIx) and central aortic pressure noninva- sively by analyzing the pulse waves of peripheral artery was in- troduced [7], and a large randomized study reported that AIx and central aortic pressure are associated with the develop- ment of cardiovascular diseases [8].
It is well known that adequate exercise, regardless of any changes in weight, independently improves cardiac function and arterial compliance, either preventing or stopping the pro- gression of coronary artery diseases [9]. Kingwell et al. [10]
compared the pulse wave velocity (PWV) of athletes and normal people and found that regular and constant exercise decreases PWV, and DeSouza et al. [11] showed that healthy adults who participated in moderate aerobic exercises for 2 to 3 months had improved arterial intima-media thickness and arterial compli- ance. The subjects of previous studies regarding arterial compli- ance only included normal population or patients with hyper- tension. However arterial stiffness may increase not only by hy- pertension but also by other risk factors of cardiovascular dis- eases such as old age, obesity, diabetes, and dyslipidemia. Fur- thermore, research regarding the correlation between reduced abdominal fat from exercises and improved arterial compliance in diabetic patients is still lacking.
Therefore, the aims of this study were to (1) examine wheth- er aerobic exercise can alleviate arterial stiffness in patients with type 2 diabetes; (2) identify the correlation between the changes in arterial stiffness and physical activity level, aerobic capacity, abdominal fat, and insulin resistance.
METHODS
Study subjects
A total of 35 type 2 diabetes patients in the Diabetes Center at Eulji Hospital were enrolled from March to July in 2011. Sub- jects that were 45 to 65 years old and overweight with a body mass index (BMI) over 23 kg/m2 or obese female patients with hemoglobin A1c (HbA1c) levels less than 10% were included in this study. At baseline, 24, 10, and 1 of the 35 patients were under exercise and diet, oral hypoglycemic agent, and insulin treatments, respectively. The exclusion criteria were: type 1 dia- betes patients, congestive heart failure, uncontrollable arrhyth-
mia, severe valvular disease, patients with malignant tumor, patients under renal replacement therapy, patients that were difficult to perform tracking observations, patients refusing to be investigated, smokers, and patients who changed the medi- cine that they were taking. The Institutional Review Board of the Clinical Research Institute at Eulji Hospital approved the study protocol and informed consent was obtained from each subject.
Study design
During the 2 weeks of screening period, we requested that par- ticipants maintain their daily routine physical activity and di- etary intake before beginning of the study. Two weeks later, the subjects were randomized into aerobic exercise group (AEG) or control group (CG). AEG group was performed walking ex- ercise 3 day/week for 60 min/day at an exercise intensity of higher than 4 according to an accelerometer, corresponding to 3 to 5 metabolic equivalents (METs) [8] for 12 weeks, which corresponds to an energy expenditure of approximately 500 kcal/day. During 12 weeks, the subjects were monitored every 2 weeks for accurate measurements of their compliance, energy intake (EI), and physical activity energy expenditure (PAEE).
Measured categories and methods Anthropometry and biochemical tests
The subjects’ height, weight, and waist circumference were measured at baseline and after the 12-week period. The height and weight were measured when subjects were only wearing light clothing, and BMI was calculated by dividing weight (kg) by the square of height (m2). Waist circumference was mea- sured between the lower ribs and iliac crest after exhale with a tape measure, and blood pressure was measured after 10 min- utes of rest while sitting with a mercury sphygmomanometer (Yamasu, Tokyo, Japan).
As for biochemical tests, venous blood was collected 10 hours of fasting, which was centrifuged at 3,000 rpm for 15 minutes to separate the serum that was stored at –70˚C before being analyzed. Fasting glucose was measured by glucose oxi- dation method and HbA1c level was measured using high- performance liquid chromatography based on ion-exchange resin. Cholesterol, triglyceride, high density lipoprotein cho- lesterol, and low density lipoprotein cholesterol (LDL-C) were measured by enzyme-linked immunosorbent assay using an automatic chemistry analyzer (Hitachi 7170; Hitachi, Tokyo, Japan).
Insulin resistance was calculated using insulin tolerance test (KITT) [12]. After 10 hours of fasting, an insulin tolerance test was performed. A 20-gauge catheter was inserted into a vein in one hand of the subject for blood collection and another cathe- ter into the vein on the other side for insulin injection and glu- cose infusion at the end of the test. The appropriate insulin con- centration (0.1 U per 1 kg) was calculated and prediluted insu- lin (Humulin R; Eli Lilly, Indianapolis, IN, USA) was injected into the antebrachial vein at resting state, while blood was col- lected from the vein in the opposite hand at baseline, 3, 6, 9, 12, and 15 minutes afterwards. One hundred milliliter of 20% glu- cose solution was infused 15 minutes after blood collection to prevent hypoglycemia, while the blood was immediately centri- fuged to measure blood glucose levels. The glucose concentra- tions that were measured at different time points during insulin resistance test were entered into a computer software, where they were converted to each respective natural logarithm and the slope of regression line was measured using the values at 3 to 15 minutes. From this the half-life (t1/2) which is the time taken for baseline glucose level to drop by half was calculated and the rate constant for plasma glucose disappearance (KITT), the insulin resistance index, was obtained using the formula:
KITT=0.693/(t1/2)×100 (%/min).
AIx was acquired by measuring arterial stiffness and pulse wave reflection using SphygmoCor system (SphygmoCoR; At- Cor Medical Pty Ltd., Sydney, Austrailia). The pulse pressure (PP) waveform of peripheral artery was measured with appla- nation tonometer. All measurements were taken after at least 5 minutes of rest while sitting with either right radial artery for right-handed subjects or left transradial coronary artery for left-handed subjects. When 40 continuous waveforms were re- corded, a validated transform function was used to obtain the PP waveform of aorta, and PWV was used as an evaluation in- dex for aorta stiffness. At least two measurements per subject were performed. These measurements were checked whether the quality index provided by the software was over 80% and whether the variations between aorta PP waveforms were min- imal by three medical doctors, after which only the valid mea- surements were included.
Definitions of major hemodynamic indices [13]: (1) Aug- mentation pressure (AP): maximum blood pressure (mm Hg) at the inflection point of systolic blood pressure; (2) AIx: AIx is this aortic AP expressed as a percentage of aortic PP: AIx=AP/
PP×100 (%); (3) high AIx values denote severe aortic stiffness;
(4) AIx adjusted to a hear rate of 75% (AIx@75): since AIx is
affected by heart rate (HR), it is adjusted to a ‘standard HR’ of 75 bpm, the SphygomoCor Px software automatically decreas- es AIx by 4.8% per every 10 bpm rise in HR. This only applies to HR from 40 to 110 bpm.
Exercise intervention
The CG did not participate in any exercise programs, while AEG performed 60 minutes of walking exercise at an exercise intensity between 3.6 and 5.2 METs (Lifecorder activity levels 4 to 6) [14] three times per week to consume 500 kcal every day for 12 weeks. Both groups received one dietary education program at the beginning of the intervention.
Measurements of physical activity level and energy intake To estimate the physical activity level of each subject, an accel- erometer (Lifecorder; Suzuken Co., Nagoya, Japan) was used.
The age, gender, height, weight, and measurement start date and time of each subject at baseline were entered. All subjects were requested to attach an accelerometer to their belt at all times except during sleep or shower during the intervention period and changes in weight were recorded every 2 weeks.
Total energy expenditure (TEE), PAEE, and energy expendi- ture of each activity intensity levels were analyzed.
The subjects were instructed to fill out a 3-day meal record (twice during weekdays and once during weekend) and visited the hospital every 4 weeks to review their intake records and in- vestigate their overall dietary intake. All subjects participated in a prior education program about how to fill out the meal record, where they were instructed to record all the food that they have eaten in one day and their ingredients for each meal, as well as any dietary supplements or snacks. To increase the accuracy of the records, professional dietitians used life-size food models (Korea Mirage Replica Inc., Incheon, Korea), measuring cups, measuring spoons, and estimated food size by eye measure- ments of food photos (The Korean Dietetic Association, 1999) to review the meal records with the subjects when the dietary questionnaires were collected. Meal record data were analyzed with a computer-aided nutritional analysis program (CAN-Pro version 2.0; Korean Nutrition Society, Seoul, Korea) to be con- verted to dietary intake.
Graded exercise test
The graded exercise test was performed using a stationary bi- cycle (ER 900, D-72475 Bits; JAGER, Wuerzburg, Germany), increasing the power by 20 W in every 2 minutes until the sub-
jects could not continue exercising. Subjects’ heart beats per minute, oxygen uptake, work done, and breathing rate were au- tomatically recorded as numbers and graphs every 15 seconds, while blood pressure was recorded every 2 minutes by an auto- matic sphygmomanometer before, during, and after exercise.
We measured anaerobic threshold using a Jaeger Oxycon Delta system.
Computed tomography
Computed tomography (GE, Milwaukee, WI, USA) of abdomi- nal fat was measured based on methods used in previous stud- ies, radiographic images were taken from the 4th to 5th lumber body to belly button with 10 mm above and below the range. Fat density was measured in Hounsfield unit in the range from –150 to –50 and was reconstructed. In other words, the total abdomi- nal fat area within the abdominal cavity was calculated using a computer and the visceral fat area (VFA) was obtained by mea- suring the inner area with the abdomen and the dorsal perito- neum as the boundary. The subcutaneous fat area (SFA) was calculated by subtracting the total abdominal fat by VFA [15].
Statistical analysis
The mean and standard deviation for different variables in this study were performed using SPSS version 15.0 (SPSS Inc., Chi- cago, IL, USA). The statistical differences in physical character- istics, biochemical test results, abdominal fat, and insulin resis- tance of both CG and AEG before and after the 12-week period were determined using paired t-test, and the differences be- tween the groups were determined using independent t-test and analysis of covariance, and finally bivariate correlation test was used. Statistical significance was set at P<0.05.
RESULTS
Baseline clinical characteristics
A total of 35 (CG=18, AEG=17) subjects were enrolled for this study. The average age was 56.5±3.4, average diabetes duration was 4.7±4.8 years, and average BMI was 26.6±1.9 kg/m2. Al- though there were no significant differences in age (P=0.072), di- abetes duration (P=0.488), and BMI (P=0.071) between the two groups (Table 1), the waist circumference was higher in CG com- pared with AEG (P=0.006). Furthermore, the average HbA1c (P=0.986), KITT (P=0.628) which is the insulin resistance index, and AIx@75 (P=0.115) were similar in both groups (Table 1).
There were no changes in drug intake of subjects in attempt to
prevent hypoglycemia during the 12-week period. At baseline, 13 and 9 subjects, 3 and 7 subjects, and 1 and 0 subjects in AEG and CG were receiving exercise and diet, oral hypoglycemic agent, and insulin therapies, respectively, but there were no sig- nificant differences in receiving different types of therapy be- tween the groups.
Changes in energy expenditure and energy intake
There were no significant difference in the TEE (P=0.741), PAEE (P=0.539), and EI (P=0.419) at baseline between groups.
After 12 weeks, the TEE (P=0.042) and PAEE (P=0.001) of AEG increased from baseline, but no differences were observed in CG (P=0.651, P=0.572, respectively). After 12 weeks, the Table 1. Clinical characteristics at the baseline
Characteristic AEG (n=17) CG (n=18) P value
Age, yr 55.4±3.5 57.6±3.5 0.072
Diabetes duration, yr 4.1±5.3 5.3±4.2 0.488
BW, kg 63.4±6.1 67.7±6.2 0.047
BMI, kg/m2 26.0±1.5 27.2±2.1 0.071
WC, cm 85.9±3.3 90.6±5.8 0.006
Lab finding FPG, mg/dL HbA1c, % KITT, %/min SBP, mm Hg DBP, mm Hg TC, mg/dL TG, mg/dL HDL-C, mg/dL LDL-C, mg/dL
134.3±27.2 7.3±0.9 2.2 ±0.9 123.7±9.6 80.0±6.3 184.1±42.2 167.5±116.6
41.8±11.6 114.1±33.3
130.0±32.6 7.3±1.2 2.1±1.0 121.7±18.6
79.4±9.9 147.6±25.1 141.7±105.8
38.1±12.4 84.9±26.8
0.686 0.986 0.628 0.689 0.850 0.004 0.497 0.362 0.007 Abdominal fat, cm2
TFA VFA SFA
39,361.3±7,415.2 16,175.2±4,296.6 23,186.1±5,858.8
35,090.1±6,294.9 14,757.1±2,708.5 20,333.0±6,297.7
0.076 0.254 0.174 Aerobic capacity,
AT-VO2 11.3±3.7 9.0±3.8 0.078
AIx@75, % 26.3±7.4 30.2±10.5 0.115
Values are presented as mean±standard deviation. P values are ob- tained by independent t-test.
AEG, aerobic exercise group; CG, control group; BW, body weight;
BMI, body mass index; WC, waist circumference; FPG, fasting plas- ma glucose; HbA1c, hemoglobin A1c; KITT, insulin sensitivity by in- sulin tolerance test; SBP, systolic blood pressure; DBP, diastolic blood pressure; TC, total cholesterol; TG, triglyceride; HDL-C, high density lipoprotein cholesterol; LDL-C, low density lipoprotein cholesterol;
TFA, total fat area; VFA, visceral fat area; SFA, subcutaneous fat area;
AT-VO2, anaerobic threshold-oxygen consumption; AIx@75, aug- mentation index 75%.
changes in TEE (P=0.027) and PAEE (P=0.001) were signifi- cantly higher in AEG compared with CG (Tables 2 and 3).
In CG, EI decreased significantly from 1,956.9±176.8 to 1,730.1±284.9 kcal/day (P<0.001), and AEG also showed a sig-
nificant decrease in EI, from 1,909.0±169.0 to 1,634.5±253.0 kcal/day (P<0.001), but the changes in EI were not significantly different between the two groups (Tables 2 and 3).
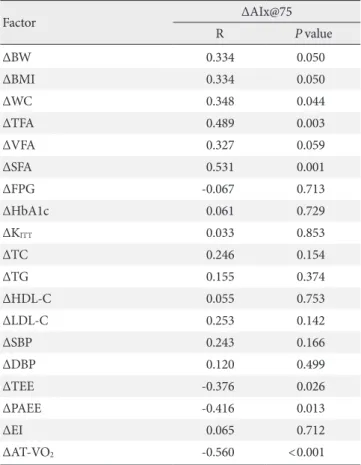
While change in AIx@75 was associated with changes in TEE (r=–0.376, P=0.026) and PAEE (r=–0.416, P=0.013), it was not correlated with the change in EI (Table 4).
Changes in anthropometric and biochemical indices After 12 weeks, both AEG and CG showed significant decreas- es in weight (P<0.001 and P=0.01, respectively), BMI (P<0.001 and P=0.02, respectively), and waist circumference (P<0.001 and P=0.04, respectively) from baseline (Table 3, Fig. 1).
After 12 weeks, the decreases in weight, BMI, and waist cir- cumference were significantly were greater in AEG compared with CG (P=0.039, P=0.039, and P=0.020, respectively), and the decreases in triglyceride level was also greater in AEG than in CG (P=0.034). However the change in insulin resistance was not significantly different between two groups (Table 3, Fig. 1).
Although the change in AIx@75 was significantly correlated with change in waist circumference (r=0.348, P=0.044), it was not associated with insulin resistance improvement significantly (Table 4).
Table 2. Total and physical activity energy expenditure and di- etary energy intake in each group at the baseline and during the 12 weeks intervention (kcal/day)
AEG CG P value
TEE Baseline
During intervention % Changeb
1,876.0±343.0 2,195.5±669.9a
16.8±28.8
1,898.4±145.4 1,910.2±155.2
0.7±5.7
0.741 0.088 0.027 PAEE Baseline
During intervention % Changeb
331.6±143.4 458.2±155.6a 47.6±46.3
304.9±109.5 313.4±122.0 4.2±22.2
0.539 0.004
<0.001 EI Baseline
During intervention % Changeb
1,909.0±169.0 1,634.5±263.0a
–14.5±10.8
1,956.9±176.8 1,730.1±284.9a
–12.0±8.7
0.419 0.311 0.453 Values are presented as mean±standard deviation. P values are ob- tained by independent t-test.
AEG, aerobic exercise group; CG, control group; TEE, total energy ex- penditure; PAEE, physical activity energy expenditure; EI, energy in- take.
aP<0.05 compared to baseline within group, bChange (percent change) was calculated as (12 weeks value–baseline value)×100/baseline value.
Table 3. Changes in anthropometric, insulin sensitivity, regional fat, aerobic capacity, and AIx among two groups
AEG CG
P value
Baseline After % Changea Baseline After % Changea
Anthropometric BW, kg BMI, kg/m2 WC, cm
63.4±6.1 26.0±1.5 85.9±3.3
60.3±5.8b 24.8±1.4b 81.0±3.9b
–4.9±2.7 –4.9±2.7 –5.9±3.2
67.7±6.2 27.2±2.1 90.6±5.8
65.9±7.1b 26.5±2.4b 87.9±5.9b
–2.8±3.1 –2.8±3.1 –3.0±3.8
0.039 0.039 0.020 Abnormal fat area, cm
TFA VFA SFA
35,090.1±6,294.9 14,757.1±2,708.5 20,333.0±6,297.7
30,730.8±6,991.1b 14,757.1±2,708.5b 18,217.4±6,310.8b
–13.8±7.9 –17.6±14.4 –11.3±7.4
39,361.3±7,415.2 16,175.2±4,296.6 23,186.1±5,858.8
37,402.2±6,720.5 16,175.2±4,196.6 21,957.2±5,563.5b
–4.3±11.8 –2.4±19.9 –4.8±10.2
0.010 0.017 0.044 Aerobic capacity
(AT-VO2), mL/min/kg 9.0±3.8 15.2±5.4b 88.3±77.3 11.3±3.7 10.7±3.8 1.6±43.1 <0.001 Insulin sensitivity
(KITT), %/min 2.2±0.9 2.6±0.9 28.5±64.1 2.1±1.0 2.3±0.6 37.1±91.5 0.751
AIx@75, % 30.2±10.5 22.1±9.9b –27.4±18.0 26.3±7.4 29.6±7.1b 20.5±25. 1 <0.001
Values are presented as mean±standard deviation. P values are obtained by independent t-test between groups.
AIx, augmentation index; AEG, aerobic exercise group; CG, control group; BW, body weight; BMI, body mass index; WC, waist circumference;
TFA, total fat area; VFA, visceral fat area; SFA, subcutaneous fat area; AT-VO2, anaerobic threshold-oxygen consumption; KITT, insulin sensitiv- ity by insulin tolerance test; AIx@75, augmentation index 75%.
a% Change (percent change) was calculated as (12 weeks value–baseline value)×100/baseline value, bP<0.05 significance from paired t-test within group.
Changes in abdominal fat
After 12 weeks intervention, AEG showed significant decreases in total fat area (TFA; P<0.001), VFA (P<0.001), and SFA (P<0.001) from baseline. On the other hand, CG showed no significant differences in TFA (P=0.103) or VFA (P=0.356), but their SFA decreased significantly (P=0.047) from baseline.
After 12 weeks, the changes in TFA (P=0.010), VFA (P=0.017), and SFA (P=0.044) decreased significantly in AEG compared with CG (Table 3, Fig. 1).
Although the change in AIx@75 was significantly related to the changes in SFA (r=0.531, P=0.001) and TFA (r=0.489, P=0.003), it was not associated with VFA (Table 4).
Changes in aerobic capacity and AIx
After 12 weeks, the aerobic capacity significantly increased in AEG from baseline (P<0.001), while CG did not show any dif- ferences, and the change in aerobic capacity increased signifi- cantly in AEG compared with CG (P<0.001). The differences in aerobic capacity between the two groups was still significant even after adjusting for subjects’ baseline age, weight, waist circumfer- ence, total cholesterol, LDL-C, and aerobic capacity (P=0.002) (Table 3, Fig. 2).
After 12 weeks, the aortic AIx@75 decreased significantly in AEG from baseline (P<0.001), while it was increased in CG from baseline (P<0.001). The difference in changes of aortic AIx@75 Table 4. Factors associated with percent change of AIx@75 in-
cluding all groups
Factor ΔAIx@75
R P value
ΔBW 0.334 0.050
ΔBMI 0.334 0.050
ΔWC 0.348 0.044
ΔTFA 0.489 0.003
ΔVFA 0.327 0.059
ΔSFA 0.531 0.001
ΔFPG -0.067 0.713
ΔHbA1c 0.061 0.729
ΔKITT 0.033 0.853
ΔTC 0.246 0.154
ΔTG 0.155 0.374
ΔHDL-C 0.055 0.753
ΔLDL-C 0.253 0.142
ΔSBP 0.243 0.166
ΔDBP 0.120 0.499
ΔTEE -0.376 0.026
ΔPAEE -0.416 0.013
ΔEI 0.065 0.712
ΔAT-VO2 -0.560 <0.001
AIx@75, augmentation index 75%; BW, body weight; BMI, body mass index; WC, waist circumference; TFA, total fat area; VFA, vis- ceral fat area; SFA, subcutaneous fat area; FPG, fasting plasma glu- cose; HbA1c, hemoglobin A1c; KITT, insulin sensitivity by insulin tol- erance test; TC, total cholesterol; TG, triglyceride; LDL-C, low densi- ty lipoprotein cholesterol; HDL-C, high density lipoprotein choles- terol; SBP, systolic blood pressure; DBP, diastolic blood pressure;
TEE, total energy expenditure; PAEE, physical activity energy expen- diture; EI, energy intake; AT-VO2, anaerobic threshold-oxygen con- sumption.
0 –5 –10 –15 –20 –25 –30
% Change of BMI and abdominal fat –35 BMI TFA VFA SFA
a
a
a
a
AEGCG
Fig. 1. Change in body weight and abdominal fat after 3 months intervention among two groups. BMI, body mass index; TFA, total fat area; VFA, visceral fat area; SFA, subcutaneous fat area;
CG, control group; AEG, aerobic exercise group. aP<0.05 from independent t-test.
% Change of Alx, AC, and PAEE
200 150 100 50 0 –50 –100
a
a
a
AIx@75 AC PAEE
AEGCG
Fig. 2. Change in augmentation index 75% (AIx@75), aerobic capacity and physical activity energy expenditure (PAEE) after 3 months intervention among two groups. AEG, aerobic exer- cise group; CG, control group; AC, aerobic capacity. aP<0.05 from independent t-test.
of AEG and CG after 12 weeks was significant (P<0.001) (Table 3), and this significance was maintained even after adjusting for age, weight, waist circumference, total cholesterol, and LDL-C (P<0.001).
The change in aortic AIx@75 had a significant correlation with the change in cardiorespiratory fitness (r=–0.560, P<0.001) (Table 4, Fig. 3).
DISCUSSION
Increased arterial stiffness gives rise to left ventricular overload and increases the tension of blood vessel wall, consequently leading to increased risks of cardiovascular diseases. Arterial stiffness can be change after exercise. Indeed, Lee et al. [16]
showed that an acute treadmill exercise (60% HRmax) in pa- tients with hypertension can lead to decreased blood pressure and improved vascular compliance. Furthermore, improve- ments of vascular compliance was greater in the 12 weeks com- pared with at the 6 weeks among subjects with hypertension taking antihypertensive drugs, which indicated prolonged aer- obic exercise showed much effectiveness although temporary aerobic exercise does improve vascular compliance [17]. Also, Mustata et al. [18] reported that aerobic exercise 60 min/day for 3 day/week for 12 weeks had an effect of significantly de- creasing arterial stiffness in patients with predialysis chronic
kidney disease. In line with previous studies, this study showed AIx was significantly decreased in AEG compared with CG.
The possible reason for the restoration of vascular compliance after exercise is the augmented blood flow and blood pressure during exercise helps maintain the normal functions of aortic endothelium and efficiently supplies blood to arteriole [19]. In addition, the increased production of nitric oxide in vascular endothelium with exercise might be possible reason for the benefits of exercise-induced decrease in arterial stiffness [20].
In general, arterial stiffness can be affected by age, obesity, hypertension, and diabetes, which are all risk factors for cardio- vascular diseases [21]. Arterial stiffness has also shown to be correlated with insulin resistance because increased insulin re- sistance has been known to induce arterial stiffness through various mechanisms such as accelerated sympathetic nervous system, increased sodium uptake in kidneys, impaired vascular dilation, and accelerated renin-angiotensin-aldosterone system.
These have been known to show significant correlation with AIx and fasting blood glucose [22], and Wilkinson et al. [23] showed that AIx is increased in diabetes. However, no differences in changes of fasting blood glucose, HbA1c, and KITT were ob- served between AEG and CG in this study, and no correlation between these variables and arterial stiffness was observed. A previous study reported that intense exercise is required to in- crease insulin sensitivity [24], while long-term period of exer- cise is required for moderate intense exercise [25,26]. Further- more, Mustata et al. [18] reported that only 12 weeks of aerobic exercise is not sufficient to increase homeostasis model assess- ment of insulin resistance (HOMA-IR), and many other factors are involved in increasing HOMA-IR. However this study did not have enough exercise intensity, amount, and duration to in- crease insulin sensitivity, which might be a reason that changes in insulin sensitivity had no correlation with changes in AIx in this study. Further study that studies the association between enhanced insulin sensitivity and arterial stiffness with varying exercise intensity and duration is warranted.
Arterial stiffness and abdominal fat are known to show sig- nificant correlation. An aquarobics exercise for 60 min/day for 3 day/week for 8 weeks among middle-aged obese women re- duced body fat and increased vascular compliance [27], while Kim et al. [28] showed a significant relationship between arte- rial stiffness measured by PWV and waist circumference but not with weight and BMI. In line, this study also showed a cor- relation between changes in AIx and changes in waist circum- ference but not with weight and BMI. As such, weight and BMI Fig. 3. Correlation between physical activity energy expendi-
ture (PAEE), aerobic capacity (AC), and augmentation index 75% (AIx@75).
300
200
100
0
–100
% Change of AC and PAEE
% Change of AIx@75
-100 -50 0 50 100 150 ACPAEE
has, until now, failed to show any consistent correlation with long-term arterial calcification and arterial stiffness because BMI does not only reflect body fat but also muscle mass [29];
therefore, the association between BMI and arterial stiffness can differ depending on the ratio of fat and muscle. Further- more, we found that AEG had significantly higher reductions in total abdominal fat, visceral fat, and subcutaneous fat com- pared with CG, of which changes in total abdominal fat and subcutaneous fat showed significant correlation with changes in AIx, suggesting that abdominal fat has larger implications on AIx than weight. Although changes in visceral fat did not such a significant correlation, its P value was 0.059, which is very close to being significant, therefore further study with a larger cohort and longer duration may be required to confirm this re- sults.
Most studies regarding exercise reported that exercise alone does not have a large effect on weight reduction [30,31], but here we showed not only the significant reduction in weight of AEG (–3.1 kg) but also a significant reduction in subcutaneous fat of CG, unlike the previous studies. We speculate that the rea- son for such controversy is because both groups had reduced food intake at the end of study compared with baseline. Howev- er there was no difference in calorie intake in both groups. Arte- rial stiffness has been shown to be associated with increased aerobic exercise capacity through regular aerobic exercise [32].
Yoon et al. [33] showed that carotid-femoral artery PWV was negatively associated with VO2max which is an index of cardio- respiratory fitness among old-aged women (r=–0.533). Mustata et al. [18] also showed a significant association between the in- creased VO2max and AIx after 12 weeks of aerobic exercise with 40% to 60% intensity. This study also showed that AEG had in- creased aerobic capacity compared with CG, and the enhanced cardiorespiratory fitness showed a negative correlation with re- duced arterial stiffness (r=–0.560), similarly to previous studies, and this had the highest correlation among other factors. As such, arterial compliance enhancement after exercise is known to be due to the increased aortic compliance, reduced peripher- al blood vessel resistance, restoration of compliance, changes in plasma volume, and changes in endocrine system [34,35]. Aero- bic exercise capacity is a strong predictor of total mortality due to cardiovascular diseases [36], and although this is greatly re- duced in patients with type 2 diabetes [37], regular exercise can restore cardiorespiratory fitness and reduce risk factors for car- diovascular diseases. The American Diabetes Association par- ticularly emphasizes the advantages of regular physical activities
in diabetes prevention and treatment and recommends more than 30 minutes of moderate exercise every day [38]. They are also recommending more than 150 minutes of moderate exer- cise (50% to 70% of HRmax) every week and more than three times per week of aerobic exercise, especially to control blood glucose levels, maintain weight, and reduce risks of cardiovas- cular diseases [39]. In addition, this study showed that changes in AIx does not have a significant relationship with changes in calorie intake but does have a negative correlation with TEE and PAEE.
The limitations of this study were that the cohort size was small and that this was only a preliminary study. Also, this study does not provide any clues regarding how exercise intensity, amount, and duration can affect weight reduction and insulin resistance. Therefore further study with a larger cohort with dif- fering exercise intensity, amount, and duration is needed.
In conclusion, 12 weeks of moderate aerobic exercise can re- duce weight and abdominal fat, alleviate arterial stiffness, and improves aerobic capacity but does not decrease insulin resis- tance. In addition, changes in arterial stiffness was more associat- ed with waist circumference and changes in abdominal fat rather than weight, and with changes in PAEE rather than changes in EI.
These suggested that moderate intensity exercise improved arte- rial stiffness with relation to cardiorespiratory fitness and also with central obesity in type 2 diabetes.
CONFLICTS OF INTEREST
No potential conflict of interest relevant to this article was re- ported.
REFERENCES
1. Danaei G, Finucane MM, Lu Y, Singh GM, Cowan MJ, Pacio- rek CJ, Lin JK, Farzadfar F, Khang YH, Stevens GA, Rao M, Ali MK, Riley LM, Robinson CA, Ezzati M; Global Burden of Met- abolic Risk Factors of Chronic Diseases Collaborating Group (Blood Glucose). National, regional, and global trends in fast- ing plasma glucose and diabetes prevalence since 1980: system- atic analysis of health examination surveys and epidemiologi- cal studies with 370 country-years and 2.7 million participants.
Lancet 2011;378:31-40.
2. Morrish NJ, Wang SL, Stevens LK, Fuller JH, Keen H. Mortality and causes of death in the WHO Multinational Study of Vascu- lar Disease in Diabetes. Diabetologia 2001;44 Suppl 2:S14-21.
3. Stamler J, Vaccaro O, Neaton JD, Wentworth D. Diabetes, other risk factors, and 12-yr cardiovascular mortality for men screened in the Multiple Risk Factor Intervention Trial. Diabetes Care 1993;16:434-44.
4. Alexander CM, Landsman PB, Teutsch SM, Haffner SM; Third National Health and Nutrition Examination Survey (NHANES III); National Cholesterol Education Program (NCEP). NCEP- defined metabolic syndrome, diabetes, and prevalence of coro- nary heart disease among NHANES III participants age 50 years and older. Diabetes 2003;52:1210-4.
5. O’Brien MJ, Alos VA, Davey A, Bueno A, Whitaker RC. Accul- turation and the prevalence of diabetes in US Latino Adults, National Health and Nutrition Examination Survey 2007-2010.
Prev Chronic Dis 2014;11:E176.
6. Cruickshank K, Riste L, Anderson SG, Wright JS, Dunn G, Gosling RG. Aortic pulse-wave velocity and its relationship to mortality in diabetes and glucose intolerance: an integrated in- dex of vascular function? Circulation 2002;106:2085-90.
7. Hope SA, Tay DB, Meredith IT, Cameron JD. Use of arterial transfer functions for the derivation of aortic waveform char- acteristics. J Hypertens 2003;21:1299-305.
8. Williams B, Lacy PS, Thom SM, Cruickshank K, Stanton A, Collier D, Hughes AD, Thurston H, O’Rourke M; CAFE Inves- tigators; Anglo-Scandinavian Cardiac Outcomes Trial Investi- gators; CAFE Steering Committee and Writing Committee.
Differential impact of blood pressure-lowering drugs on central aortic pressure and clinical outcomes: principal results of the Conduit Artery Function Evaluation (CAFE) study. Circulation 2006;113:1213-25.
9. Esposito K, Pontillo A, Di Palo C, Giugliano G, Masella M, Marfella R, Giugliano D. Effect of weight loss and lifestyle chang- es on vascular inflammatory markers in obese women: a ran- domized trial. JAMA 2003;289:1799-804.
10. Kingwell BA, Cameron JD, Gillies KJ, Jennings GL, Dart AM.
Arterial compliance may influence baroreflex function in ath- letes and hypertensives. Am J Physiol 1995;268(1 Pt 2):H411-8.
11. DeSouza CA, Shapiro LF, Clevenger CM, Dinenno FA, Mona- han KD, Tanaka H, Seals DR. Regular aerobic exercise prevents and restores age-related declines in endothelium-dependent vasodilation in healthy men. Circulation 2000;102:1351-7.
12. Bonora E, Moghetti P, Zancanaro C, Cigolini M, Querena M, Cacciatori V, Corgnati A, Muggeo M. Estimates of in vivo in- sulin action in man: comparison of insulin tolerance tests with euglycemic and hyperglycemic glucose clamp studies. J Clin Endocrinol Metab 1989;68:374-8.
13. Izzo JL Jr. Pulse contour analysis and augmentation index: it’s time to move beyond cuff blood pressure measurement. Am J Hypertens 2005;18(1 Pt 2):1S-2S.
14. Kumahara H, Schutz Y, Ayabe M, Yoshioka M, Yoshitake Y, Shindo M, Ishii K, Tanaka H. The use of uniaxial accelerometry for the assessment of physical-activity-related energy expendi- ture: a validation study against whole-body indirect calorime- try. Br J Nutr 2004;91:235-43.
15. Borkan GA, Gerzof SG, Robbins AH, Hults DE, Silbert CK, Silbert JE. Assessment of abdominal fat content by computed tomography. Am J Clin Nutr 1982;36:172-7.
16. Lee JH, Hwang BY, Nam SN. The change of post treadmill ex- ercise on blood pressure and vascular compliance in essential hypertension patients. Korean J Phys Educ 2004;43:511-20.
17. Lee JH. Effects of aerobic exercise on arterial pulse wave veloci- ty and vessel pressure in patients with anti-hypertensives agents [master’s thesis]. Seoul: Hanyang University; 2005.
18. Mustata S, Groeneveld S, Davidson W, Ford G, Kiland K, Manns B. Effects of exercise training on physical impairment, arterial stiffness and health-related quality of life in patients with chronic kidney disease: a pilot study. Int Urol Nephrol 2011;43:1133-41.
19. Stewart KJ, Sung J, Silber HA, Fleg JL, Kelemen MD, Turner KL, Bacher AC, Dobrosielski DA, DeRegis JR, Shapiro EP, Ouyang P. Exaggerated exercise blood pressure is related to im- paired endothelial vasodilator function. Am J Hypertens 2004;
17:314-20.
20. Gielen S, Schuler G, Adams V. Cardiovascular effects of exer- cise training: molecular mechanisms. Circulation 2010;122:
1221-38.
21. Laurent S, Cockcroft J, Van Bortel L, Boutouyrie P, Giannattasio C, Hayoz D, Pannier B, Vlachopoulos C, Wilkinson I, Struijker- Boudier H; European Network for Non-invasive Investigation of Large Arteries. Expert consensus document on arterial stiffness:
methodological issues and clinical applications. Eur Heart J 2006;27:2588-605.
22. Lee JI, Sohn TS, Kwon HS, Lee JM, Chang SA, Cha BY, Son HS. The changes of central aortic pulse wave analysis in meta- bolic syndrome. Korean Diabetes J 2008;32:522-8.
23. Wilkinson IB, MacCallum H, Rooijmans DF, Murray GD, Cockcroft JR, McKnight JA, Webb DJ. Increased augmentation index and systolic stress in type 1 diabetes mellitus. QJM 2000;
93:441-8.
24. Jung JY, Han KA, Ahn HJ, Kwon HR, Lee JH, Park KS, Min KW. Effects of aerobic exercise intensity on abdominal and thigh adipose tissue and skeletal muscle attenuation in over-
weight women with type 2 diabetes mellitus. Diabetes Metab J 2012;36:211-21.
25. Short KR, Vittone JL, Bigelow ML, Proctor DN, Rizza RA, Coenen-Schimke JM, Nair KS. Impact of aerobic exercise train- ing on age-related changes in insulin sensitivity and muscle oxi- dative capacity. Diabetes 2003;52:1888-96.
26. DiPietro L, Dziura J, Yeckel CW, Neufer PD. Exercise and im- proved insulin sensitivity in older women: evidence of the en- during benefits of higher intensity training. J Appl Physiol (1985) 2006;100:142-9.
27. Ka SH. The impact of aquarobics on the body composition and vascular compliance of middle-aged obese women [disserta- tion]. Daejeon: Chungnam National University; 2006.
28. Kim TS, Seo YY, Lee SH, Hong YH, Kim DY, Won HS, Yang MS, Shin HH. Correlation between pulse wave velocity and cardiovascular risk factors in Korean women. Korean J Lipidol Atheroscler 2008;18:239-46.
29. Mackey RH, Sutton-Tyrrell K, Vaitkevicius PV, Sakkinen PA, Lyles MF, Spurgeon HA, Lakatta EG, Kuller LH. Correlates of aortic stiffness in elderly individuals: a subgroup of the Cardio- vascular Health Study. Am J Hypertens 2002;15(1 Pt 1):16-23.
30. Despres JP. Abdominal obesity as important component of in- sulin-resistance syndrome. Nutrition 1993;9:452-9.
31. Dekker MJ, Lee S, Hudson R, Kilpatrick K, Graham TE, Ross R, Robinson LE. An exercise intervention without weight loss de- creases circulating interleukin-6 in lean and obese men with and without type 2 diabetes mellitus. Metabolism 2007;56:332-8.
32. Vaitkevicius PV, Fleg JL, Engel JH, O’Connor FC, Wright JG, Lakatta LE, Yin FC, Lakatta EG. Effects of age and aerobic ca- pacity on arterial stiffness in healthy adults. Circulation 1993;
88(4 Pt 1):1456-62.
33. Yoon ES, Jung SJ, Jae SY. Association between cardiorespirato-
ry fitness and arterial stiffness in older women. Exerc Sci 2009;
18:307-16.
34. Chandler MP, DiCarlo SE. Acute exercise and gender alter car- diac autonomic tonus differently in hypertensive and normo- tensive rats. Am J Physiol 1998;274(2 Pt 2):R510-6.
35. Shen W, Zhang X, Zhao G, Wolin MS, Sessa W, Hintze TH. Ni- tric oxide production and NO synthase gene expression con- tribute to vascular regulation during exercise. Med Sci Sports Exerc 1995;27:1125-34.
36. Cole CR, Foody JM, Blackstone EH, Lauer MS. Heart rate re- covery after submaximal exercise testing as a predictor of mor- tality in a cardiovascularly healthy cohort. Ann Intern Med 2000;132:552-5.
37. Poirier P, Garneau C, Bogaty P, Nadeau A, Marois L, Brochu C, Gingras C, Fortin C, Jobin J, Dumesnil JG. Impact of left ven- tricular diastolic dysfunction on maximal treadmill perfor- mance in normotensive subjects with well-controlled type 2 diabetes mellitus. Am J Cardiol 2000;85:473-7.
38. Klein S, Sheard NF, Pi-Sunyer X, Daly A, Wylie-Rosett J, Kulkarni K, Clark NG; American Diabetes Association; North American Association for the Study of Obesity; American So- ciety for Clinical Nutrition. Weight management through life- style modification for the prevention and management of type 2 diabetes: rationale and strategies: a statement of the American Diabetes Association, the North American Association for the Study of Obesity, and the American Society for Clinical Nutri- tion. Diabetes Care 2004;27:2067-73.
39. Sigal RJ, Kenny GP, Wasserman DH, Castaneda-Sceppa C, White RD. Physical activity/exercise and type 2 diabetes: a con- sensus statement from the American Diabetes Association. Di- abetes Care 2006;29:1433-8.