pISSN 2288-6575 • eISSN 2288-6796 https://doi.org/10.4174/astr.2021.101.3.167 Annals of Surgical Treatment and Research
Meta-analysis of transanal versus laparoscopic total mesorectal excision for rectal cancer: a ‘New Health Technology’ assessment in South Korea
Sun-Ho Kwon1, Yea-Il Joo1, Seon Hahn Kim2,3, Dae Ho Lee2,4, Jeong-Heum Baek2,5, Soon Sup Chung2,6, Ji-Yeon Shin2,7, Chang Soo Eun2,8, Nam Kyu Kim2,9
1Division for New Health Technology Assessment, National Evidence-based Healthcare Collaborating Agency, Seoul, Korea
2TaTME Assessment Committee, National Evidence-based Healthcare Collaborating Agency, Seoul, Korea
3Division of Colorectal Surgery, Department of Surgery, Korea University Anam Hospital, Korea University College of Medicine, Seoul, Korea
4Department of Oncology, Asan Medical Center, University of Ulsan College of Medicine, Seoul, Korea
5Division of Colon and Rectal Surgery, Department of Surgery, Gil Medical Center, Gachon University College of Medicine, Incheon, Korea
6Department of General Surgery, Ewha Womans University College of Medicine, Seoul, Korea
7Department of Preventive Medicine, School of Medicine, Kyungpook National University, Daegu, Korea
8Department of Internal Medicine, Hanyang University Guri Hospital, Guri, Korea
9Department of Surgery, Institute of Gastroenterology, Yonsei University College of Medicine, Seoul, Korea
Received June 10, 2021, Reviewed June 11, 2021, Accepted July 13, 2021 Corresponding Author: Nam Kyu Kim
Department of Surgery, Institute of Gastroenterology, Yonsei University College of Medicine, 50-1 Yonsei-ro, Seodaemun-gu, Seoul 03722, Korea Tel: +82-2-2228-2117, Fax: +82-2-313-8289
E-mail: namkyuk@yuhs.ac
ORCID: https://orcid.org/0000-0003-0639-5632
Copyright ⓒ 2021, the Korean Surgical Society
cc Annals of Surgical Treatment and Research is an Open Access Journal. All articles are distributed under the terms of the Creative Commons Attribution Non- Commercial License (http://creativecommons.org/licenses/by-nc/4.0/) which permits unrestricted non-commercial use, distribution, and reproduction in any medium, provided the original work is properly cited.
Purpose: Under the South Korea’s unique health insurance structure, any new surgical technology must be evaluated first by the government in order to consider whether that particular technology can be applied to patients for further clinical trials as categorized as ‘New Health Technology,’ then potentially covered by the insurance sometime later. The aim of this meta-analysis was to assess the safety and efficacy of transanal total mesorectal excision (TaTME) for rectal cancer, activated by the National Evidence-based Healthcare Collaborating Agency (NECA) TaTME committee.
Methods: We systematically searched Ovid-MEDLINE, Ovid-Embase, Cochrane, and Korean databases (from their inception until August 31, 2019) for studies published that compare TaTME with laparoscopic total mesorectal excision (LaTME). End-points included perioperative and pathological outcomes.
Results: Sixteen cohort studies (7 for case-matched studies) were identified, comprising 1,923 patients (938 TaTMEs and 985 LaTMEs). Regarding perioperative outcomes, the conversion rate was significantly lower in TaTME (risk ratio, 0.19;
95% confidence interval, 0.11–0.34; P < 0.001); whereas other perioperative outcomes were similar to LaTME. There were no statistically significant differences in pathological results between the 2 procedures.
Conclusion: Our meta-analysis showed comparable results in preoperative and pathologic outcomes between TaTME and LaTME, and indicated the benefit of TaTME with low conversion. Extensive evaluations of well-designed, multicenter randomized controlled trials are required to come to unequivocal conclusions, but the results showed that TaTME is a potentially beneficial technique in some specific cases. This meta-analysis suggests that TaTME can be performed for rectal cancer patients as a ‘New Health Technology’ endorsed by NECA in South Korea.
[Ann Surg Treat Res 2021;101(3):167-180]
Key Words: Colorectal neoplasms, Laparoscopic total mesorectal excision, Meta-analysis, Systematic review, Transanal total mesorectal excision
INTRODUCTION
Colorectal cancer is the third most common diagnosis and the third-leading cause of death worldwide [1]. Total mesorectal excision (TME) was first described by Heald and Ryall in 1982 [2], and it has become the standard treatment for rectal cancer by effectively reducing recurrence, improving quality of life, and prolonging survival [3]. Laparoscopic surgery has replaced open surgery, allowing favorable short-term outcomes, particularly for pain reduction, reduced blood loss, and rapid recovery [4]. Laparoscopic surgery has been widely accepted and used for minimally invasive surgical procedures; however, conversions from laparoscopic TME (LaTME) to open procedure have been common in patients with rectal cancer [5]. The main reasons for the unsatisfactory conversion rate were the patient characteristics of male sex (because of the narrow pelvis) and the high body mass index (BMI) [6,7]. Additionally, high incidence of positive resection margin and poor quality of TME specimen, which are factors known as poor oncologic outcomes in deep narrow pelvis, exist [8].
To address the aforementioned limitations, transanal TME (TaTME) was first described by Sylla et al. [9]. In several studies, this “bottom-up” approach for mid-low rectal cancer has been proposed as a safe and effective technique for patients by demonstrating the benefits of more precise excision under appropriate visualization and potentially improving specimen quality and resection margins [10-12]. However, it still remains controversial because its oncological feasibility and safety have not yet been validated by large randomized controlled trials (RCTs). Recent studies reported that the TaTME approach showed unfavorable local recurrence rates and a higher risk of anastomotic leak than a nontransanal approach [13,14]. TaTME also seems to be associated with substantial morbidities such as urethral and other urologic injuries [15]. It is suggested that these complications are related to the surgeon’s lack of surgical training or learning curves [16,17].
The national health insurance system of South Korea is unique public health insurance where all citizens are forced to sign in, and all insurance policyholders are burdened with the duty to pay for the insurance. By the unique structure of South Korea’s health insurance system, if a new medical procedure doesn’t pass the New Health Technology Assessment (nHTA), it cannot be covered by the health insurance, thus not being available to policyholders even as an uncovered procedure.
Therefore, nHTA is an essential step undertaken to evaluate whether a procedure’s clinical safety/efficacy is appropriate to be used on insurance policyholders through a systematic review.
TaTME is a new surgical technique in which the technical method of conventional LaTME has been changed and is subject to nHTA. Thus, a systematic review and meta-analysis
of the current data from the latest and most convincing studies was conducted, comparing the safety and efficacy between TaTME and LaTME for nHTA by the National Evidence-based Healthcare Collaborating Agency (NECA) committee.
METHODS
Registration and search strategy
This study was conducted in accordance with the PRISMA (preferred reporting items for systematic reviews and meta- analyses) guidelines [18]. The protocol was registered in PROSPERO under the number CRD42021230076.
Comprehensive searches were performed through the databases of MEDLINE, Embase, Cochrane Library, and Korean databases (KoreaMed, KMbase, KISTI, KISS, and RISS) from their inception until August 31, 2019. The MEDLINE and Embase databases were searched using the following terms with Boolean operators: (rectal neoplasms OR rectal tumor OR rectal cancer OR colorectal neoplasms OR colorectal tumor OR colorectal cancer) AND (transanal total mesorectal excision OR TaTME OR Ta-TME OR transanal minimally invasive surgery OR TAMIS OR transanal endoscopic surgery OR transanal rectal resection). The Cochrane database was searched using the following keyword: transanal total mesorectal excision. The Korean database was searched using the following terms with Boolean operators: neoplasms AND transanal total mesorectal excision.
Inclusion and exclusion criteria
In accordance with PICOS (patient, intervention, comparator, outcome, and study design) criteria, studies were included if they met the following inclusion criteria: (1) patients diagnosed with rectal cancer; (2) patients underwent either TaTME or LaTME; (3) at least 1 of the following perioperative outcomes or pathological data were available; and (4) studies were cohort studies. The exclusion criteria were as follows: (1) reviews, letters, editorials, commentaries, conference abstract, and clinical reports; (2) studies with sample size below 20 in each group; (3) languages other than English; (4) inappropriate data; (5) duplicate patient series; (6) inadequate technique for intervention or comparator; and (7) nonhuman researches.
Data extraction and quality assessment
The following data were extracted by the 2 reviewers (SHK and YIJ). (1) Demographic data: study design, sex, BMI, age, American Society of Anesthesiologists physical status classification, tumor location, and neoadjuvant treatment;
(2) Perioperative outcomes: operation time, intraoperative blood loss, conversion rate, hospital stay, readmission, reoperation, diverting ileostomy, major complication (Clavien- Dindo classification III−V), anastomotic leakage, intestinal
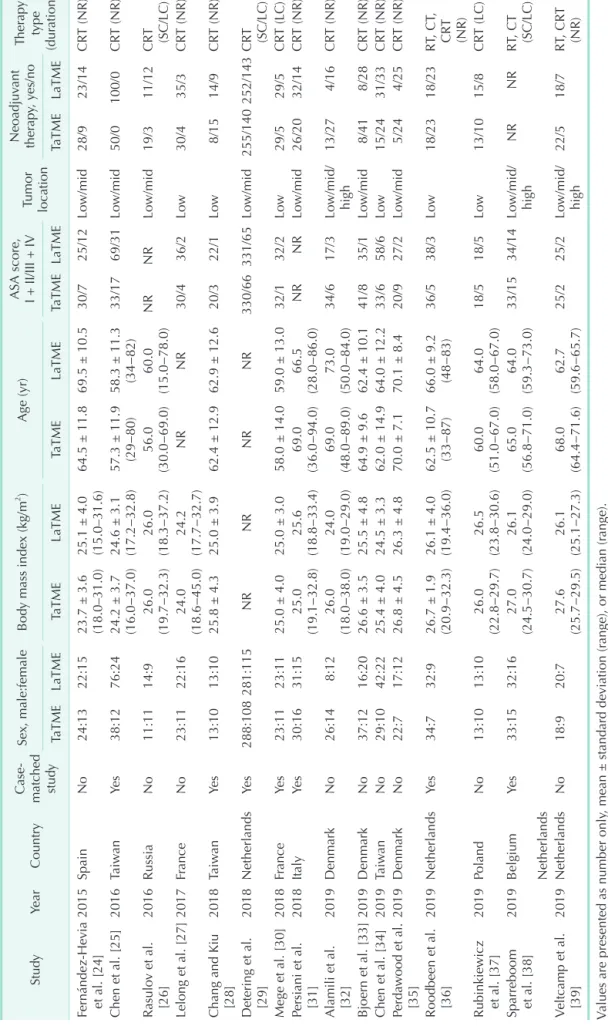
Table 1. Demographics and clinical characteristics of the included studies StudyYearCountryCase- matched study
Sex, male:femaleBody mass index (kg/m2 )Age (yr)ASA score, I + II/III + IV
Tumor location
Neoadjuvant therapy, yes/noTherapy type (duration) TaTMELaTMETaTMELaTMETaTMELaTMETaTMELaTMETaTMELaTME Fernández-Hevia et al. [24]2015SpainNo24:1322:15
23.7 ± 3.6 (18.0–31.0) 25.1 ± 4.0 (15.0–31.6)
64.5 ± 11.869.5 ± 10.530/725/12Low/mid28/923/14CRT (NR) Chen et al. [25]2016TaiwanYes38:1276:24
24.2 ± 3.7 (16.0−37.0) 24.6 ± 3.1 (17.2−32.8)
57.3 ± 11.9 (29−80)58.3 ± 11.3 (34−82)33/1769/31Low/mid50/0100/0CRT (NR) Rasulov et al. [26]2016RussiaNo11:1114:926.0 (19.7−32.3)26.0 (18.3−37.2)56.0 (30.0−69.0)60.0 (15.0−78.0)NRNRLow/mid19/311/12CRT (SC/LC) Lelong et al. [27]2017FranceNo23:1122:1624.0 (18.6−45.0)24.2 (17.7−32.7)NRNR30/436/2Low30/435/3CRT (NR) Chang and Kiu [28]2018TaiwanYes13:1013:1025.8 ± 4.325.0 ± 3.962.4 ± 12.962.9 ± 12.620/322/1Low8/1514/9CRT (NR) Detering et al. [29]2018NetherlandsYes288:108281:115NRNRNRNR330/66331/65Low/mid255/140252/143CRT (SC/LC) Mege et al. [30]2018FranceYes23:1123:1125.0 ± 4.025.0 ± 3.058.0 ± 14.059.0 ± 13.032/132/2Low29/529/5CRT (LC) Persiani et al. [31]2018ItalyYes30:1631:1525.0 (19.1−32.8)25.6 (18.8−33.4)69.0 (36.0−94.0)66.5 (28.0−86.0)NRNRLow/mid26/2032/14CRT (NR) Alamili et al. [32]2019DenmarkNo26:148:1226.0 (18.0−38.0)24.0 (19.0−29.0)69.0 (48.0−89.0)73.0 (50.0−84.0)34/617/3Low/mid/ high
13/274/16CRT (NR) Bjoern et al. [33]2019DenmarkNo37:1216:2026.6 ± 3.525.5 ± 4.864.9 ± 9.662.4 ± 10.141/835/1Low/mid8/418/28CRT (NR) Chen et al. [34]2019TaiwanNo29:1042:2225.4 ± 4.024.5 ± 3.362.0 ± 14.964.0 ± 12.233/658/6Low15/2431/33CRT (NR) Perdawood et al. [35]2019DenmarkNo22:717:1226.8 ± 4.526.3 ± 4.870.0 ± 7.170.1 ± 8.420/927/2Low/mid5/244/25CRT (NR) Roodbeen et al. [36]2019NetherlandsYes34:732:9
26.7 ± 1.9 (20.9−32.3) 26.1 ± 4.0 (19.4−36.0)
62.5 ± 10.7 (33−87)66.0 ± 9.2 (48−83)36/538/3Low18/2318/23RT, CT, CRT (NR) Rubinkiewicz et al. [37]2019PolandNo13:1013:1026.0 (22.8−29.7)26.5 (23.8−30.6)60.0 (51.0−67.0)64.0 (58.0−67.0)18/518/5Low13/1015/8CRT (LC) Sparreboom et al. [38]2019Belgium Netherlands
Yes33:1532:1627.0 (24.5−30.7)26.1 (24.0−29.0)65.0 (56.8−71.0)64.0 (59.3−73.0)33/1534/14Lo
w/mid/ high
NRNRRT
, CT (SC/LC)
Veltcamp et al. [39]
2019NetherlandsNo18:920:727.6 (25.7−29.5)26.1 (25.1−27.3)68.0 (64.4−71.6)62.7 (59.6−65.7)25/225/2Lo
w/mid/ high
22/518/7RT, CRT (NR) Values are presented as number only, mean ± standard deviation (range), or median (range). ASA, American society of anesthesiologists; TaTME, transanal total mesorectal excision; LaTME, laparoscopic total mesorectal excision; CRT, chemoradiotherapy; NR, not reported; SC, short-course; LC, long-course; RT, radiotherapy; CT, chemotherapy.
obstruction, ureter or urethral injury, urinary retention, urinary tract infection, and mortality; (3) Pathological outcomes:
circumferential resection margin (CRM) and distal resection margin (DRM) involvement, length of CRM and DRM, incompleteness of mesorectum, and harvested lymph nodes.
The methodological quality and risk of bias of the included studies were assessed using the Newcastle−Ottawa quality assessment scale [19]. Any disagreements were settled by consensus-based discussion between the 2 reviewers (SHK and YIJ).
Definitions
Inappropriate techniques described in the exclusion criteria are defined as all procedures except interventional (TaTME) or comparative procedures (LaTME). The location of the tumor is categorized as low (0–5 cm from the anal verge), middle (5.1–10 cm from the anal verge), and high (10.1–15 cm from the anal verge). Conversion in LaTME was defined when the procedure was completed with open surgery. Conversion in TaTME was defined as a case in which the procedure was completed by open surgery, or the TME was performed by the transanal approach but the conversion occurred at the transabdominal phase. Mesorectal resection quality was scored using 3 grades—
complete, nearly complete, or incomplete, as defined by Quirke et al. [20].
Statistical analysis
Meta-analyses were performed with Review Manager 5.3 software (Cochrane Collaboration, Oxford, UK). Dichotomous data were pooled as risk ratios (RRs) with 95% confidence intervals (CIs) using the Mantel-Haenszel method, which can avoid biased estimates by incorporating evidence from single zero studies without requiring the standard continuity correction [21]. Mean differences (MDs) and 95% CI were pooled for continuous variables using the inverse variance method.
If the median and range were reported instead of the mean and standard deviation, these values were estimated using the method devised by Hozo et al. [22]. The Q test and I2 statistic were used to evaluate heterogeneity among studies. The Cochrane Handbook for Systematic Reviews of Interventions provides a rule of thumb for interpreting the I2 statistic; that is I2 ≤ 40% may indicate unimportant heterogeneity, 30% ≤ I2 ≤ 60% may represent moderate heterogeneity, 50% ≤ I2 ≤ 90%
may represent substantial heterogeneity, and 70% ≤ I2 ≤ 100%
implies that heterogeneity may be considerable. A Cochrane Q statistical P < 0.100 and/or I2 > 50% was taken to indicate significant heterogeneity, in which case a random-effects model was applied [23]. Otherwise, a fixed-effects model was employed. Funnel plots were used in meta-analysis to visually detect the presence of publication bias.
RESULTS
Study characteristics
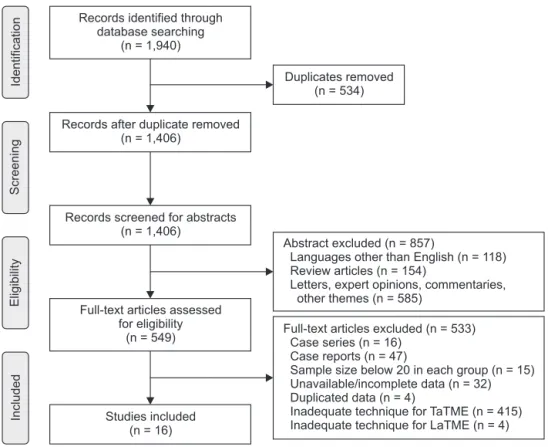
As a result of the literature search, 1,940 studies were identified. Among the search results obtained through the online databases in the first screening, 534 duplicate articles were removed. After that, through the review of the abstracts, 857 articles that did not fit the language and article type were excluded. The remaining articles were fully checked to ensure they met the inclusion criteria, and 533 additional articles were excluded. Finally, 16 cohort studies met all the inclusion criteria and none of the exclusion criteria (Fig. 1) [24-39]. Seven of the cohort studies were case-matched studies comparing TaTME with LaTME for rectal cancer [25,28-31,36,38]. The patient demographics, clinical characteristics, and quality assessment scores are shown in Table 1 and Supplementary Table 1.
Perioperative outcomes
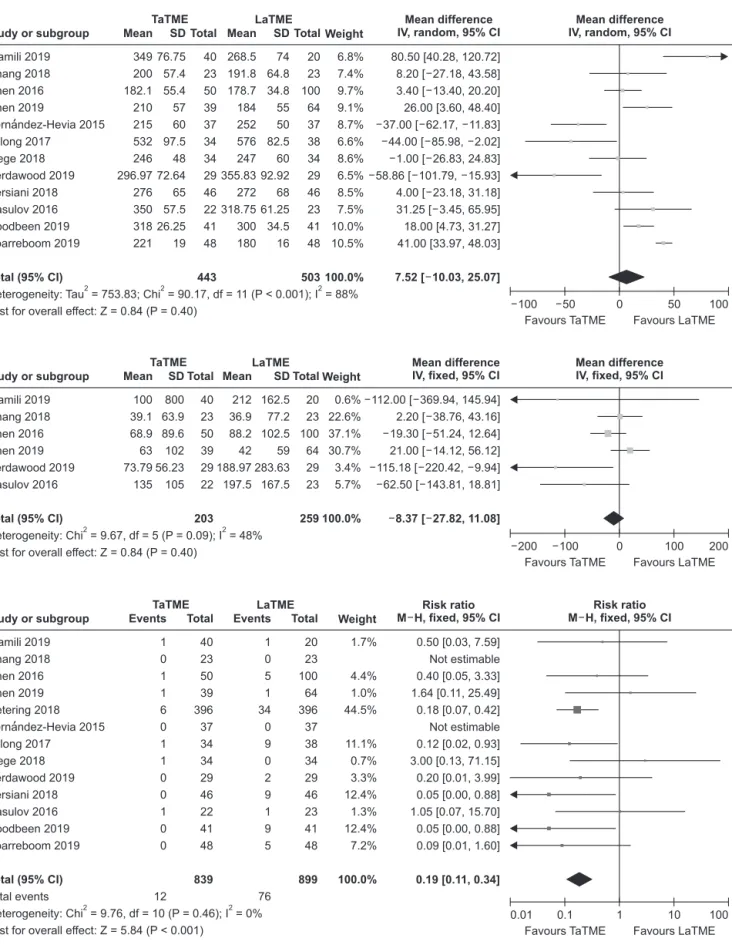
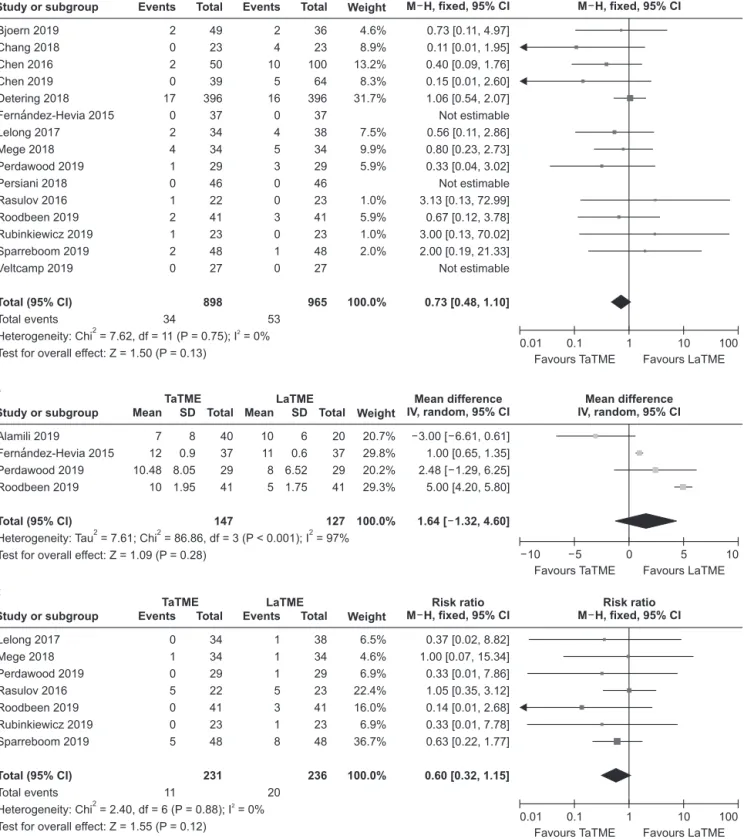
A total of 12 studies [24-28,30-32,34-36,38] reported operation time in 946 patients, and we found no statistically significant difference between TaTME and LaTME groups (MD, 7.52; 95%
CI, –10.03−25.07; P = 0.400) (Fig. 2A). Perdawood et al. [35]
and Fernández-Hevia et al. [24] reported a 2-team approach as standard; Alamili et al. [32], Chen et al. [34], Roodbeen et al. [36], Sparreboom et al. [38], Chang and Kiu [28], and Mege et al. [30]
used a 1-team approach. Persiani et al. [31], Lelong et al. [37], Chen et al. [25], and Rasulov et al. [26] used both a 1- and 2-team approach. There was a notable heterogeneity between included studies (I2 = 88%, P < 0.001).
Intraoperative blood loss repor ted in 6 studies [25,26,28,32,34,35] that investigated 462 patients (Fig. 2B). There was no statistically significant difference between groups (MD, –8.37; 95% CI, –27.82−11.08; P = 0.410), and moderate heterogeneity was existed (I2 = 48%, P = 0.090).
Data on conversion rate were extracted from 13 studies [24- 32,34-36,38] assessing 1,738 patients (Fig. 2C). Upon analysis, the TaTME group displayed significant lower conversion rate compared to the LaTME group (RR, 0.19; 95% CI, 0.11−0.34; P <
0.001). There was no heterogeneity between included studies (I2
= 0%, P = 0.460).
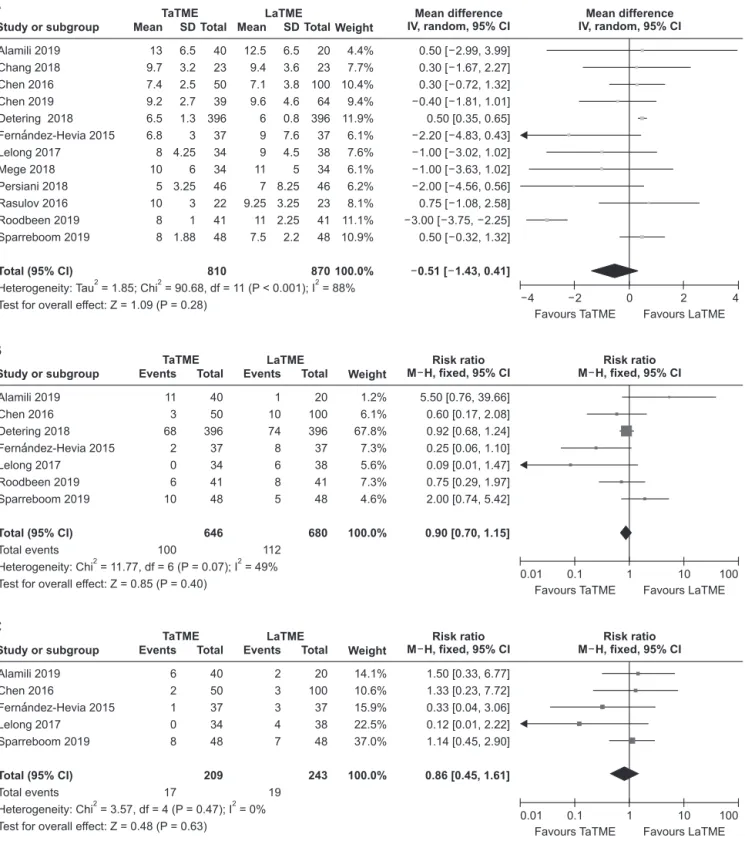
Twelve studies [24-32,34,36,38] assessed hospital stay in 1,680 patients (Fig. 3A). Pooled analysis indicated that the result was not statistically significant between the 2 groups (MD, –0.51; 95% CI, –1.43−0.41; P = 0.280). Substantial heterogeneity existed in hospital stay (I2 = 88%, P < 0.001).
A total of 7 studies [24,25,27,29,32,36,38] reported data on readmission in 1,326 patients (Fig. 3B). There was no statistically significant difference between the 2 groups (RR, 0.90; 95% CI, 0.70−1.15; P = 0.400), and moderate heterogeneity existed (I2 = 49%, P = 0.070).
Five studies [24,25,27,32,38] that evaluated 452 patients were
pooled for analysis of reoperation (Fig. 3C). The difference was not statistically significant between the 2 groups (RR, 0.86; 95%
CI, 0.45−1.61; P = 0.630). There was no heterogeneity between included studies (I2 = 0%, P = 0.470).
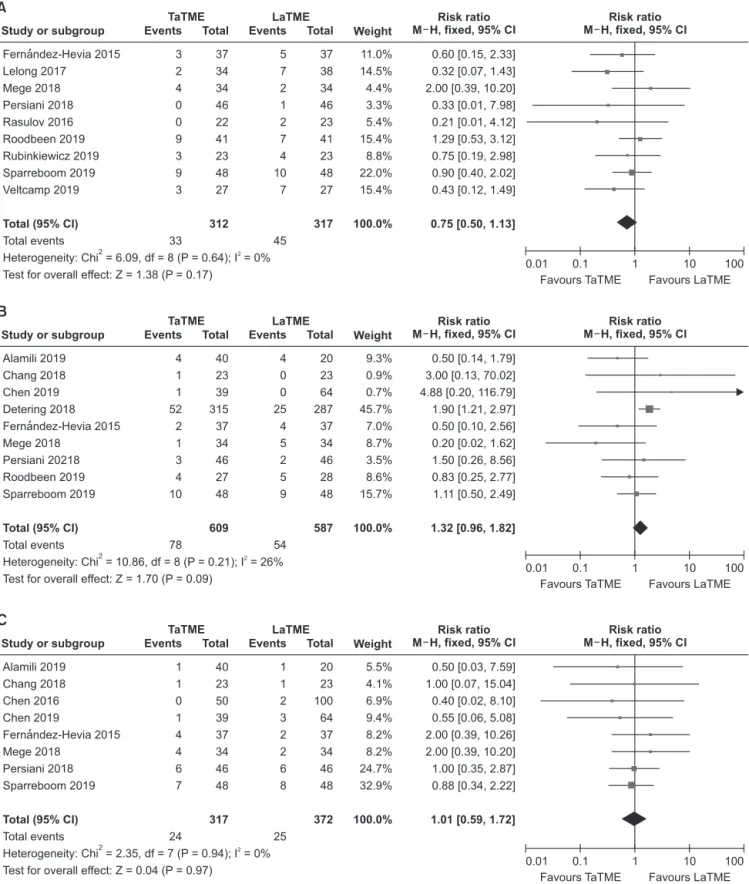
Analysis of the major complication (Clavien-Dindo classification III−V) was performed based on 9 studies [24,26,27,30,31,36-39] evaluating 629 patients (Fig. 4A). There was no statistically detected difference between the groups (RR, 0.75; 95% CI, 0.50−1.13; P = 0.170). Heterogeneity in this regard was not significant (I2 = 0%, P = 0.640).
Data on anastomotic leakage were available in 9 studies [24,28-32,34,36,38], which assessed 1,196 patients (Fig. 4B).
We found that there was no statistically significant difference between the 2 groups (RR, 1.32; 95% CI, 0.96−1.82; P = 0.090), with no heterogeneity (I2 = 26%, P = 0.210).
Intestinal obstruction was investigated in 8 studies [24,25,28,30-32,34,38], and remained unchanged between the 2 groups (RR, 1.01; 95% CI, 0.59−1.72; P = 0.970) (Fig. 4C). There was no heterogeneity between included studies (I2 = 0%, P = 0.940).
Moreover, the occurrence of other complications such as diverting ileostomy (RR, 1.20; 95% CI, 0.87−1.65; P = 0.270; I2
= 85%), mortality within 30 days (RR, 0.40; 95% CI, 0.06−2.73;
P = 0.350; I2 = 0%), ureter or urethral injury (RR, 0.83; 95% CI, 0.10−6.63; P = 0.860; I2 = 0%), urinary retention (RR, 1.23; 95%
CI, 0.04−38.46; P = 0.910; I2 = 74%), and urinary tract infection (RR, 1.08; 95% CI, 0.29−4.11; P = 0.910; I2 = 0%) were similar
between the 2 groups (Supplementary Fig. 1, 2).
Pathological outcomes
Fifteen studies [24-31,33-39] that assessed 1,863 patients reported on CRM involvement (Fig. 5A). The results showed that CRM involvement was similar between the 2 groups (RR, 0.73; 95% CI, 0.48−1.10; P = 0.130), and no heterogeneity was detected between included studies (I2 = 0%; P = 0.750).
The length of CRM was reported in 4 studies [24,32,35,36] that investigated 274 patients (Fig. 5B). The comparison between the 2 groups resulted in a difference that was not statistically significant (MD, 1.64; 95% CI, –1.32−4.60; P = 0.280), but there was a notable heterogeneity (I2 = 97%; P < 0.001).
Seven studies [26,27,30,35-38] assessed 467 patients and reported on DRM involvement (Fig. 5C). DRM involvement is not significantly different between the 2 groups (RR, 0.60; 95%
CI, 0.32−1.15; P = 0.120), with no significant between-study heterogeneity (I2 = 0%, P = 0.880).
A total of 9 studies [24,25,28,30-32,34-36] reported length of DRM in 733 patients (Fig. 5D), which was not significantly different between the 2 groups (MD, 1.88; 95% CI, –2.96−6.73;
P = 0.450). Statistical heterogeneity among the studies was high (I2 = 87%, P < 0.001).
Eleven studies [24,26,27,30-33,35-37,39] assessed 736 patients and provided data on incompleteness of mesorectum (Fig. 5E).
Pooled analysis showed that the incompleteness of mesorectum was equivalent between the 2 groups (RR, 1.00; 95% CI,
IncludedEligibilityScreeningIdentification
Full-text articles excluded (n = 533) Case series (n = 16)
Case reports (n = 47)
Sample size below 20 in each group (n = 15) Unavailable/incomplete data (n = 32) Duplicated data (n = 4)
Inadequate technique for TaTME (n = 415) Inadequate technique for LaTME (n = 4) Records after duplicate removed
(n = 1,406) Records identified through
database searching (n = 1,940)
Records screened for abstracts (n = 1,406)
Studies included (n = 16) Full-text articles assessed
for eligibility (n = 549)
Abstract excluded (n = 857)
Languages other than English (n = 118) Review articles (n = 154)
Letters, expert opinions, commentaries, other themes (n = 585)
Duplicates removed (n = 534)
Fig. 1. PRISMA diagram of the search strategy. TaTME, transanal total mesorectal excision; LaTME, laparoscopic total mesorectal excision.
TaTME LaTME Study or subgroup
Alamili 2019 Chang 2018 Chen 2016 Chen 2019
Fernandez-Hevia 2015 Lelong 2017
Mege 2018 Perdawood 2019 Persiani 2018 Rasulov 2016 Roodbeen 2019 Sparreboom 2019
Heterogeneity: Tau = 753.83; Chi = 90.17, df = 11 (P < 0.001); I = 88%
Test for overall effect: Z = 0.84 (P = 0.40) Total (95% CI)
2 2 2
349 200 182.1 210 215 532 246 296.97 276 350 318 221
76.75 57.4 55.4 57 60 97.5 48 72.64 65 57.5 26.25 19
Weight 6.8%
7.4%
9.7%
9.1%
8.7%
6.6%
8.6%
6.5%
8.5%
7.5%
10.0%
10.5%
100.0%
40 23 50 39 37 34 34 29 46 22 41 48 443 Mean SD Total
80.50 [40.28, 120.72]
8.20 [ 27.18, 43.58]
3.40 [ 13.40, 20.20]
26.00 [3.60, 48.40]
37.00 [ 62.17, 11.83]
44.00 [ 85.98, 2.02]
1.00 [ 26.83, 24.83]
58.86 [ 101.79, 15.93]
4.00 [ 23.18, 31.18]
31.25 [ 3.45, 65.95]
18.00 [4.73, 31.27]
41.00 [33.97, 48.03]
7.52 [ 10.03, 25.07]
Mean difference IV, random, 95% CI
Favours TaTME Favours LaTME Mean difference IV, random, 95% CI
100
100 50 0 50
268.5 191.8 178.7 184 252 576 247 355.83 272 318.75 300 180
74 64.8 34.8 55 50 82.5 60 92.92 68 61.25 34.5 16
20 23 100 64 37 38 34 29 46 23 41 48 503 Mean SD Total
A
TaTME LaTME
Study or subgroup Alamili 2019 Chang 2018 Chen 2016 Chen 2019 Perdawood 2019 Rasulov 2016
Heterogeneity: Chi = 9.67, df = 5 (P = 0.09); I = 48%
Test for overall effect: Z = 0.84 (P = 0.40) Total (95% CI)
2 2
Weight 0.6%
22.6%
37.1%
30.7%
3.4%
5.7%
100.0%
100 39.1 68.9 63 73.79 135
800 63.9 89.6 102 56.23 105
40 23 50 39 29 22 203 Mean SD Total
112.00 [ 369.94, 145.94]
2.20 [ 38.76, 43.16]
19.30 [ 51.24, 12.64]
21.00 [ 14.12, 56.12]
115.18 [ 220.42, 9.94]
62.50 [ 143.81, 18.81]
8.37 [ 27.82, 11.08]
Mean difference IV, fixed, 95% CI
Favours TaTME Favours LaTME Mean difference IV, fixed, 95% CI
200
200 100 0 100
212 36.9 88.2 42 188.97 197.5
162.5 77.2 102.5 59 283.63 167.5
20 23 100 64 29 23 259 Mean SD Total
B
TaTME LaTME
Study or subgroup Alamili 2019 Chang 2018 Chen 2016 Chen 2019 Detering 2018 Fernandez-Hevia 2015 Lelong 2017
Mege 2018 Perdawood 2019 Persiani 2018 Rasulov 2016 Roodbeen 2019 Sparreboom 2019
Total events
Heterogeneity: Chi = 9.76, df = 10 (P = 0.46); I = 0%
Test for overall effect: Z = 5.84 (P < 0.001) Total (95% CI)
2 2
Weight 1.7%
4.4%
1.0%
44.5%
11.1%
0.7%
3.3%
12.4%
1.3%
12.4%
7.2%
100.0%
1 0 1 1 6 0 1 1 0 0 1 0 0
12 40 23 50 39 396 37 34 34 29 46 22 41 48 839 Events Total
0.50 [0.03, 7.59]
Not estimable 0.40 [0.05, 3.33]
1.64 [0.11, 25.49]
0.18 [0.07, 0.42]
Not estimable 0.12 [0.02, 0.93]
3.00 [0.13, 71.15]
0.20 [0.01, 3.99]
0.05 [0.00, 0.88]
1.05 [0.07, 15.70]
0.05 [0.00, 0.88]
0.09 [0.01, 1.60]
0.19 [0.11, 0.34]
Risk ratio M H, fixed, 95% CI
Favours TaTME Favours LaTME Risk ratio
M H, fixed, 95% CI
100
0.01 0.1 1 10
1 0 5 1 34 0 9 0 2 9 1 9 5
76 20 23 100 64 396 37 38 34 29 46 23 41 48 899 Events Total
C
'
'
Fig. 2. Forest plots of risk ratios and mean differences of perioperative outcomes. (A) Operative time, (B) intraoperative blood loss and, (C) conversion rate. A random-effect model was used for meta-analysis of operative time. Fixed-effects models were used for meta-analysis of intraoperative blood loss and conversion rate. Mean differences and risk ratios are shown with 95%
confidence intervals (CIs). TaTME, transanal total mesorectal excision; LaTME, laparoscopic total mesorectal excision; SD, standard deviation; IV, inverse variance; df, degree of freedom.
0.70−1.45; P = 0.980). There was no heterogeneity between included studies (I2 = 10%, P = 0.350).
Among the 9 studies [25-28,30,32,34-36] that evaluated 684
patients, the difference in harvested lymph nodes was not statistically significant (MD, 0.44; 95% CI, –0.89−1.78; P = 0.520) (Fig. 5F). No significant heterogeneity existed between included
TaTME LaTME
Study or subgroup
Alamili 2019 Chang 2018 Chen 2016 Chen 2019 Detering 2018 Fernandez-Hevia 2015 Lelong 2017
Mege 2018 Persiani 2018 Rasulov 2016 Roodbeen 2019 Sparreboom 2019
Heterogeneity: Tau = 1.85; Chi = 90.68, df = 11 (P < 0.001); I = 88%
Test for overall effect: Z = 1.09 (P = 0.28) Total (95% CI)
2 2 2
13 9.7 7.4 9.2 6.5 6.8 8 10 5 10 8 8
6.5 3.2 2.5 2.7 1.3 3 4.25 6 3.25 3 1 1.88
Weight 4.4%
7.7%
10.4%
9.4%
11.9%
6.1%
7.6%
6.1%
6.2%
8.1%
11.1%
10.9%
100.0%
40 23 50 39 396 37 34 34 46 22 41 48 810 Mean SD Total
0.50 [ 2.99, 3.99]
0.30 [ 1.67, 2.27]
0.30 [ 0.72, 1.32]
0.40 [ 1.81, 1.01]
0.50 [0.35, 0.65]
2.20 [ 4.83, 0.43]
1.00 [ 3.02, 1.02]
1.00 [ 3.63, 1.02]
2.00 [ 4.56, 0.56]
0.75 [ 1.08, 2.58]
3.00 [ 3.75, 2.25]
0.50 [ 0.32, 1.32]
0.51 [ 1.43, 0.41]
Mean difference IV, random, 95% CI
Favours TaTME Favours LaTME Mean difference IV, random, 95% CI
4
4 2 0 2
12.5 9.4 7.1 9.6 6 9 9 11 7 9.25 11 7.5
6.5 3.6 3.8 4.6 0.8 7.6 4.5 5 8.25 3.25 2.25 2.2
20 23 100 64 396 37 38 34 46 23 41 48 870 Mean SD Total
A
TaTME LaTME
Study or subgroup
Alamili 2019 Chen 2016 Detering 2018 Fernandez-Hevia 2015 Lelong 2017
Roodbeen 2019 Sparreboom 2019
Total events
Heterogeneity: Chi = 11.77, df = 6 (P = 0.07); I = 49%
Test for overall effect: Z = 0.85 (P = 0.40) Total (95% CI)
2 2
Weight 1.2%
6.1%
67.8%
7.3%
5.6%
7.3%
4.6%
100.0%
11 3 68 2 0 6 10
100 40 50 396 37 34 41 48 646 Events Total
5.50 [0.76, 39.66]
0.60 [0.17, 2.08]
0.92 [0.68, 1.24]
0.25 [0.06, 1.10]
0.09 [0.01, 1.47]
0.75 [0.29, 1.97]
2.00 [0.74, 5.42]
0.90 [0.70, 1.15]
Risk ratio M H, fixed, 95% CI
Favours TaTME Favours LaTME Risk ratio
M H, fixed, 95% CI
100
0.01 0.1 1 10
1 10 74 8 6 8 5
112 20 100 396 37 38 41 48 680 Events Total
B
TaTME LaTME
Study or subgroup
Alamili 2019 Chen 2016
Fernandez-Hevia 2015 Lelong 2017
Sparreboom 2019
Total events
Heterogeneity: Chi = 3.57, df = 4 (P = 0.47); I = 0%
Test for overall effect: Z = 0.48 (P = 0.63) Total (95% CI)
2 2
Weight 14.1%
10.6%
15.9%
22.5%
37.0%
100.0%
6 2 1 0 8
17 40 50 37 34 48 209 Events Total
1.50 [0.33, 6.77]
1.33 [0.23, 7.72]
0.33 [0.04, 3.06]
0.12 [0.01, 2.22]
1.14 [0.45, 2.90]
0.86 [0.45, 1.61]
Risk ratio M H, fixed, 95% CI
Favours TaTME Favours LaTME Risk ratio
M H, fixed, 95% CI
100
0.01 0.1 1 10
2 3 3 4 7
19 20 100 37 38 48 243 Events Total
C
'
'
'
Fig. 3. Forest plots of risk ratios and mean differences of perioperative outcomes. (A) Hospital stay, (B) readmission, and (C) reoperation. A random-effect model was used for meta-analysis of hospital stay. Fixed-effects models were used for meta- analysis of readmission and reoperation. Mean differences and risk ratios are shown with 95% confidence intervals (CIs).
TaTME, transanal total mesorectal excision; LaTME, laparoscopic total mesorectal excision; SD, standard deviation; IV, inverse variance; df, degree of freedom.
TaTME LaTME Study or subgroup
Fernandez-Hevia 2015 Lelong 2017
Mege 2018 Persiani 2018 Rasulov 2016 Roodbeen 2019 Rubinkiewicz 2019 Sparreboom 2019 Veltcamp 2019
Total events
Heterogeneity: Chi = 6.09, df = 8 (P = 0.64); I = 0%
Test for overall effect: Z = 1.38 (P = 0.17) Total (95% CI)
2 2
Weight 11.0%
14.5%
4.4%
3.3%
5.4%
15.4%
8.8%
22.0%
15.4%
100.0%
3 2 4 0 0 9 3 9 3
33 37 34 34 46 22 41 23 48 27 312 Events Total
0.60 [0.15, 2.33]
0.32 [0.07, 1.43]
2.00 [0.39, 10.20]
0.33 [0.01, 7.98]
0.21 [0.01, 4.12]
1.29 [0.53, 3.12]
0.75 [0.19, 2.98]
0.90 [0.40, 2.02]
0.43 [0.12, 1.49]
0.75 [0.50, 1.13]
Risk ratio M H, fixed, 95% CI
Favours TaTME Favours LaTME Risk ratio
M H, fixed, 95% CI
100
0.01 0.1 1 10
5 7 2 1 2 7 4 10 7
45 37 38 34 46 23 41 23 48 27 317 Events Total
A
TaTME LaTME
Study or subgroup
Alamili 2019 Chang 2018 Chen 2019 Detering 2018 Fernandez-Hevia 2015 Mege 2018
Persiani 20218 Roodbeen 2019 Sparreboom 2019
Total events
Heterogeneity: Chi = 10.86, df = 8 (P = 0.21); I = 26%
Test for overall effect: Z = 1.70 (P = 0.09) Total (95% CI)
2 2
Weight 9.3%
0.9%
0.7%
45.7%
7.0%
8.7%
3.5%
8.6%
15.7%
100.0%
4 1 1 52 2 1 3 4 10
78 40 23 39 315 37 34 46 27 48 609 Events Total
0.50 [0.14, 1.79]
3.00 [0.13, 70.02]
4.88 [0.20, 116.79]
1.90 [1.21, 2.97]
0.50 [0.10, 2.56]
0.20 [0.02, 1.62]
1.50 [0.26, 8.56]
0.83 [0.25, 2.77]
1.11 [0.50, 2.49]
1.32 [0.96, 1.82]
Risk ratio M H, fixed, 95% CI
Favours TaTME Favours LaTME Risk ratio
M H, fixed, 95% CI
100
0.01 0.1 1 10
4 0 0 25 4 5 2 5 9
54 20 23 64 287 37 34 46 28 48 587 Events Total
B
TaTME LaTME
Study or subgroup Alamili 2019 Chang 2018 Chen 2016 Chen 2019
Fernandez-Hevia 2015 Mege 2018
Persiani 2018 Sparreboom 2019
Total events
Heterogeneity: Chi = 2.35, df = 7 (P = 0.94); I = 0%
Test for overall effect: Z = 0.04 (P = 0.97) Total (95% CI)
2 2
Weight 5.5%
4.1%
6.9%
9.4%
8.2%
8.2%
24.7%
32.9%
100.0%
1 1 0 1 4 4 6 7
24 40 23 50 39 37 34 46 48 317 Events Total
0.50 [0.03, 7.59]
1.00 [0.07, 15.04]
0.40 [0.02, 8.10]
0.55 [0.06, 5.08]
2.00 [0.39, 10.26]
2.00 [0.39, 10.20]
1.00 [0.35, 2.87]
0.88 [0.34, 2.22]
1.01 [0.59, 1.72]
Risk ratio M H, fixed, 95% CI
Favours TaTME Favours LaTME Risk ratio
M H, fixed, 95% CI
100
0.01 0.1 1 10
1 1 2 3 2 2 6 8
25 20 23 100 64 37 34 46 48 372 Events Total
C
'
'
'
Fig. 4. Forest plots of risk ratios of perioperative outcomes. (A) Major complications (Clavien-Dindo classification III−V), (B) anastomotic leakage, and (C) intestinal obstruction. Fixed-effects models were used for meta-analysis. Risk ratios are shown with 95% confidence intervals (CIs). TaTME, transanal total mesorectal excision; LaTME, laparoscopic total mesorectal excision; df, degree of freedom.
TaTME LaTME Study or subgroup
Bjoern 2019 Chang 2018 Chen 2016 Chen 2019 Detering 2018 Fernandez-Hevia 2015 Lelong 2017
Mege 2018 Perdawood 2019 Persiani 2018 Rasulov 2016 Roodbeen 2019 Rubinkiewicz 2019 Sparreboom 2019 Veltcamp 2019
Total events
Heterogeneity: Chi = 7.62, df = 11 (P = 0.75); I = 0%
Test for overall effect: Z = 1.50 (P = 0.13) Total (95% CI)
2 2
Weight 4.6%
8.9%
13.2%
8.3%
31.7%
7.5%
9.9%
5.9%
1.0%
5.9%
1.0%
2.0%
100.0%
2 0 2 0 17 0 2 4 1 0 1 2 1 2 0
34 49 23 50 39 396 37 34 34 29 46 22 41 23 48 27 898 Events Total
0.73 [0.11, 4.97]
0.11 [0.01, 1.95]
0.40 [0.09, 1.76]
0.15 [0.01, 2.60]
1.06 [0.54, 2.07]
Not estimable 0.56 [0.11, 2.86]
0.80 [0.23, 2.73]
0.33 [0.04, 3.02]
Not estimable 3.13 [0.13, 72.99]
0.67 [0.12, 3.78]
3.00 [0.13, 70.02]
2.00 [0.19, 21.33]
Not estimable 0.73 [0.48, 1.10]
Risk ratio M H, fixed, 95% CI
Favours TaTME Favours LaTME Risk ratio
M H, fixed, 95% CI
100
0.01 0.1 1 10
2 4 10 5 16 0 4 5 3 0 0 3 0 1 0
53 36 23 100 64 396 37 38 34 29 46 23 41 23 48 27 965 Events Total
A
TaTME LaTME
Study or subgroup
Alamili 2019
Fernandez-Hevia 2015 Perdawood 2019 Roodbeen 2019
Heterogeneity: Tau = 7.61; Chi = 86.86, df = 3 (P < 0.001); I = 97%
Test for overall effect: Z = 1.09 (P = 0.28) Total (95% CI)
2 2 2
Weight 20.7%
29.8%
20.2%
29.3%
100.0%
7 12 10.48 10
8 0.9 8.05 1.95
40 37 29 41 147 Mean SD Total
3.00 [ 6.61, 0.61]
1.00 [0.65, 1.35]
2.48 [ 1.29, 6.25]
5.00 [4.20, 5.80]
1.64 [ 1.32, 4.60]
Mean difference IV, random, 95% CI
Favours TaTME Favours LaTME Mean difference IV, random, 95% CI
10
10 5 0 5
10 11 8 5
6 0.6 6.52 1.75
20 37 29 41 127 Mean SD Total
B
TaTME LaTME
Study or subgroup Lelong 2017 Mege 2018 Perdawood 2019 Rasulov 2016 Roodbeen 2019 Rubinkiewicz 2019 Sparreboom 2019
Total events
Heterogeneity: Chi = 2.40, df = 6 (P = 0.88); I = 0%
Test for overall effect: Z = 1.55 (P = 0.12) Total (95% CI)
2 2
Weight 6.5%
4.6%
6.9%
22.4%
16.0%
6.9%
36.7%
100.0%
0 1 0 5 0 0 5
11 34 34 29 22 41 23 48 231 Events Total
0.37 [0.02, 8.82]
1.00 [0.07, 15.34]
0.33 [0.01, 7.86]
1.05 [0.35, 3.12]
0.14 [0.01, 2.68]
0.33 [0.01, 7.78]
0.63 [0.22, 1.77]
0.60 [0.32, 1.15]
Risk ratio M H, fixed, 95% CI
Favours TaTME Favours LaTME Risk ratio
M H, fixed, 95% CI
100
0.01 0.1 1 10
1 1 1 5 3 1 8
20 38 34 29 23 41 23 48 236 Events Total
C
'
'
Fig. 5. Forest plots of risk ratios and mean differences of pathological outcomes. (A) Circumferential resection margin involvement, (B) length of circumferential resection margin, (C) distal resection margin involvement, (D) length of distal resection margin, (E) incompleteness of mesorectum, and (F) harvested lymph nodes. Random-effects models were used for meta-analysis of length of circumferential resection margin and distal resection margin. Fixed-effects models were used for meta-analysis of circumferential resection margin and distal resection margin involvement. Mean differences and risk ratios are shown with 95% confidence intervals (CIs). TaTME, transanal total mesorectal excision; LaTME, laparoscopic total mesorectal excision; SD, standard deviation; IV, inverse variance; df, degree of freedom.
studies (I2 = 0%; P = 0.550).
Publication bias
Symmetrical funnel plots of the conversion rate, major
complication (Clavien-Dindo classification III−V), CRM involvement, and incompleteness of mesorectum suggested no publication bias exists in the meta-analysis (Supplementary Fig.
3), and all of the studies were within the 95% CIs.
TaTME LaTME
Study or subgroup
Alamili 2019 Chang 2018 Chen 2016 Chen 2019
Fernandez-Hevia 2015 Mege 2018
Perdawood 2019 Persiani 2018 Roodbeen 2019
Heterogeneity: Tau = 46.42; Chi = 62.50, df = 8 (P < 0.001); I = 87%
Test for overall effect: Z = 0.76 (P = 0.45) Total (95% CI)
2 2 2
Weight 10.0%
10.9%
12.2%
11.3%
10.2%
11.5%
9.8%
11.7%
12.4%
100.0%
15 13.5 24 16 28 13 33.45 25 20
14.5 10.5 12 14 18 9 14.5 13.75 7.5
40 23 50 39 37 34 29 46 41 339 Mean SD Total
16.25 [ 23.77, 8.73]
2.00 [ 8.07, 4.07]
9.00 [5.24, 12.76]
3.00 [ 8.43, 2.43]
11.00 [3.85, 18.15]
1.00 [ 6.04, 4.04]
8.04 [0.24, 15.84]
10.00 [5.29, 14.71]
0.00 [ 3.33, 3.33]
1.88 [ 2.96, 6.73]
Mean difference IV, random, 95% CI
Favours TaTME Favours LaTME Mean difference IV, random, 95% CI
20
20 10 0 10
31.25 15.5 15 19 17 14 25.41 15 20
13.75 10.5 9 13 13 12 15.78 8.75 7.88
20 23 100 64 37 34 29 46 41 394 Mean SD Total
D
TaTME LaTME
Study or subgroup Alamili 2019 Bjoern 2019
Fernandez-Hevia 2015 Lelong 2017
Mege 2018 Perdawood 2019 Persiani 2018 Rasulov 2016 Roodbeen 2019 Rubinkiewicz 2019 Veltcamp 2019
Total events
Heterogeneity: Chi = 7.81, df = 7 (P = 0.35); I = 10%
Test for overall effect: Z = 0.03 (P = 0.98) Total (95% CI)
2 2
Weight 3.2%
22.3%
1.2%
5.7%
9.7%
43.5%
4.8%
9.5%
100.0%
11 6 1 0 7 14 2 4 0 0 0
45 40 49 37 34 34 29 46 22 41 23 27 382 Events Total
5.50 [0.76, 39.66]
0.55 [0.21, 1.45]
3.00 [0.13, 71.34]
0.22 [0.01, 4.48]
1.75 [0.56, 5.43]
0.78 [0.49, 1.25]
1.00 [0.15, 6.80]
1.05 [0.30, 3.67]
Not estimable Not estimable Not estimable 1.00 [0.70, 1.45]
Risk ratio M H, fixed, 95% CI
Favours TaTME Favours LaTME Risk ratio
M H, fixed, 95% CI
100
0.01 0.1 1 10
1 8 0 2 4 18 2 4 0 0 0
39 20 36 37 38 34 29 46 23 41 23 27 354 Events Total
E
TaTME LaTME
Study or subgroup
Alamili 2019 Chang 2018 Chen 2016 Chen 2019 Lelong 2017 Mege 2018 Perdawood 2019 Rasulov 2016 Roodbeen 2019
Heterogeneity: Chi = 6.88, df = 8 (P = 0.55); I = 0%
Test for overall effect: Z = 0.65 (P = 0.52) Total (95% CI)
2 2
Weight 3.3%
5.6%
23.1%
14.9%
21.4%
9.6%
6.7%
3.2%
12.3%
100.0%
22 22.8 16.7 20.8 14 14 26.45 22 18
22 10.8 7.8 9 7 10 8.7 13.5 3.25
40 23 50 39 34 34 29 22 41 312 Mean SD Total
2.50 [ 4.89, 9.89]
3.30 [ 2.34, 8.94]
0.70 [ 3.48, 2.08]
2.00 [ 1.45, 5.45]
2.00 [ 0.88, 4.88]
0.00 [ 4.30, 4.30]
0.24 [ 5.39, 4.91]
4.00 [ 11.47, 3.47]
2.00 [ 5.81, 1.81]
0.44 [ 0.89, 1.78]
Mean difference IV, fixed, 95% CI
Favours TaTME Favours LaTME Mean difference IV, fixed, 95% CI
10
10 5 0 5
19.5 19.5 17.4 18.8 12 14 26.69 26 20
6.5 8.6 8.9 8.1 5.25 8 11.16 12 12
20 23 100 64 38 34 29 23 41 372 Mean SD Total
F
'
'
Fig. 5. Continued.