INTRODUCTION
Myeloid-derived suppressor cells (MDSCs) represent a hetero- geneous population of immature myeloid cells (IMCs) consisting of precursors for granulocytes, macrophages, and dendritic cells (DCs) that are accumulated during chronic inflammation and tu- mor progression [1]. IMCs in the bone marrow of healthy individ- uals quickly differentiate into mature granulocytes, macrophages, or DCs. MDSCs are of myeloid origin and are characterized by their immature state and remarkable ability to suppress T-cell re- sponses [2]. Given the key roles that they play in the immunosup- pression network, the levels of MDSCs in cancer patients have been presumed to be of prognostic value [3]. Previous studies
결장직장암 환자에서 골수유래-억제세포, 림프구아형, 호중구-림프구비율의 임상적 의의
Clinical Impact of Myeloid-Derived Suppressor Cells, Lymphocyte Subsets, and Neutrophil-to-Lymphocyte Ratio in Patients with Colorectal Cancer
강민구1,3·김창현2·김수현1·신종희1·김혜란5·신명근1,4
Min-Gu Kang, M.D.1,3, Chang Hyun Kim, M.D.2, Soo Hyun Kim, M.D.1, Jong-Hee Shin, M.D.1, Hye Ran Kim, Ph.D.5, Myung-Geun Shin, M.D.1,4
전남대학교 의과대학 진단검사의학교실1, 화순전남대학교병원 외과2, 광양사랑병원 진단검사의학과3, 전남대학교 의과대학 두뇌한국21
플러스사업4, 동신대학교 한의과대학5
Departments of Laboratory Medicine1 and Surgery2, Chonnam National University Medical School and Chonnam National University Hwasun Hospital, Hwasun; Department of Laboratory Medicine3, GwangYang Sarang General Hospital, GwangYang; Brain Korea 21 Plus Project4, Chonnam National University Medical School, Gwangju; College of Korean Medicine5, Dongshin University, Naju, Korea
Vol. 10, No. 1: 75-83, January 2020
https://doi.org/10.3343/lmo.2020.10.1.75 진단혈액학
Corresponding author: Myung-Geun Shin, M.D., Ph.D.
https://orcid.org/0000-0002-0372-9185
Department of Laboratory Medicine, Chonnam National University Medical School and Chonnam National University Hwasun Hospital, 322 Seoyang-ro, Hwasun-eup, Hwasun-gun, Jeollanam-do 58128, Korea
Tel: +82-61-379-7950, Fax: +82-61-379-7984, E-mail: [email protected] Received: January 1, 2019
Revision received: February 25, 2019 Accepted: March 20, 2019
This article is available from http://www.labmedonline.org 2020, Laboratory Medicine Online
This is an Open Access article distributed under the terms of the Creative Commons Attribution Non-Commercial License (http://creativecommons.org/licenses/by-nc/4.0/) which permits unrestricted non-commercial use, distribution, and reproduction in any medium, provided the original work is properly cited.
Background: Preoperative myeloid-derived suppressor cells (MDSCs), neutrophil-to-lymphocyte ratio (NLR), and lymphocyte subsets have been reported to be associated with the clinical outcomes in colorectal cancer (CRC). However, studies on the clinical impact of each parameter have produced controversial results. Moreover, there is a paucity of comprehensive studies regarding these parameters in Korean CRC patients.
Methods: Sixty-eight CRC patients who underwent surgical resection were recruited for this study. NLR was measured using an automated blood cell counter. Flow cytometric analysis was performed to determine lymphocyte subsets and identify MDSCs during the diagnostic stage. Clin- ical and laboratory data were analyzed according to each blood parameter.
Results: The distribution of lymphocytes, MDSCs, and NLR were not associated with TNM stages. Large tumor sizes (P=0.042) and greater peri- neural invasion (P=0.031) were significantly associated with high CD19+ B-cell populations. Elevated granulocytic MDSCs (P=0.234), total MD- SCs (P=0.234), and NLR (P=0.062) were associated with the poorly differentiated type of CRC, albeit without statistical significance. Additionally, patients in the high CD19+ B-cell group (P=0.012) revealed a moderately inferior relapse-free survival.
Conclusions: Our findings indicate that preoperative evaluation of CD19+ B-cell proportion is recommended to predict the clinical outcomes of patients with stage II-III CRC.
Key Words: Myeloid-derived stem cell, Lymphocyte subset, Neutrophil-to-lymphocyte ratio, Colorectal cancer
2017-03-16 https://crossmark-cdn.crossref.org/widget/v2.0/logos/CROSSMARK_Color_square.svg
have focused on the function and clinical relevance of MDSCs in gastrointestinal malignancies [3, 4]. However, studies regarding the clinicopathological impact of MDSCs on Korean patients with colorectal cancer (CRC) are limited. A systematic meta-analysis re- ported conflicting results on the relationship between MDSCs and prognostic factors of CRC such as mortality, TNM stage, metasta- sis, and lymph node involvement [3]. Pretreatment peripheral im- mune status, including MDSCs and effector T-cells, was also re- ported as a predictive factor of the clinical outcome of patients with CRC [5].
Moreover, lymphopenia is generally associated with an im- paired cell-mediated immunity, while neutrophilia is a recog- nized response to systemic inflammation. Accordingly, the neu- trophil-to-lymphocyte ratio (NLR), which is calculated as the neu- trophil count divided by the lymphocyte count, is suggested as a marker for general immune responses to various stress stimuli [6].
Although an elevated NLR in patients with CRC was found to pre- dict poor clinical outcomes [6-10], findings on the direct impact of NLR on patient survival and the clinicopathological variables of the tumor remain inconclusive.
Therefore, this study investigated, retrospectively, the relation- ship between MDSCs, lymphocyte subsets, and NLR and the clin- ical features and prognoses of CRC patients.
MATERIALS AND METHODS
1. Patients
From 2014 to 2016, 68 patients with CRC were enrolled in this study. Peripheral blood samples were collected from the patients at the diagnosis stage. All patients with CRC received postopera- tive chemotherapy (fluorouracil and oxaliplatin), and three pa- tients underwent additional postoperative radiotherapy. Clinical and laboratory data such as sex, tumor location, TNM staging, age, and preoperative carcinoembryonic antigen (CEA) were ob- tained from electronic medical records. The 68 patients with CRC were categorized into high and low groups for each cell popula- tion by a median split (%) of MDSCs, CD3+ total T-cells, CD4+ T- cells, CD8+ T-cells, CD19+ B-cells, and CD16+56+ natural killer cells (NK-cells). Additionally, these patients were categorized into high and low groups for NLR, which was calculated as the neutro- phil count divided by the lymphocyte count obtained from elec- tronic medical records.
2. MDSC and lymphocyte subset analysis
Flow cytometric analysis was performed on fresh peripheral blood for lymphocyte subsets and MDSCs at the diagnostic stage using a multicolor flow cytometry analyzer (BD FACSCalibur; BD Biosciences, San Jose, CA, USA). Lymphocyte subsets (T-cells, B- cells, and NK-cells) were analyzed using the following antibodies:
IgG1 (Beckman Coulter, Inc., Brea, CA, USA), CD3/4 (Beckman Coulter, Inc.), CD3/8 (Beckman Coulter, Inc.), CD3/19 (Beckman Coulter, Inc.), CD3/16+56 (Beckman Coulter, Inc.), and CD45 PerCP (BD Biosciences, San Jose, CA, USA). Accordingly, the pro- portion of the CD3+ total T-cells, CD4+ T-cells, CD8+ T-cells, CD19+ B-cells, and CD16+56+ NK-cells was analyzed. Monocytic MDSCs (mMDSC) and granulocytic MDSCs (gMDSC) were ana- lyzed using the following antibodies: mouse IgG2a allophycocya- nin (APC) (BD Biosciences, Inc.), fluorescein isothiocyanate (FITC) mouse IgG1K isotype control (BD Biosciences, Inc.), phy- coerythrin (PE)-mouse IgG1K isotype control (BD Biosciences, Inc.), CD11b-(D12) APC (BD Biosciences, Inc.), PE-mouse anti-hu- man CD33 (BD Biosciences, Inc.), PE-cy7 mouse anti-human CD14 (BD Biosciences, Inc.), and FITC mouse anti-human CD15 Clone-W6D3 (BD Biosciences, Inc.). MDSC proportions were ob- tained using the following method: CD11b(+)/CD14(-)/CD33(+)/
CD15(-) cells were regarded as mMDSCs and CD11b(+)/CD14(-)/
CD33(+)/CD15(+) cells as gMDSCs.
3. Statistical Analysis
The χ2 test or Fisher’s exact test was performed to determine the associations between MDSCs/lymphocyte subsets/NLR and other patient parameters, including sex, differentiation, tumor lo- cation, depth of invasion, lymph node involvement, TNM staging, lymphovascular invasion, perineural invasion, and recurrence. A Mann-Whitney U test was used to compare continuous variables such as age, tumor size, and preoperative CEA. Spearman’s corre- lations were used to compare the relationship between lympho- cyte subsets, NLR, and MDSC subsets. The proportion of MDSCs, lymphocyte subsets, and NLR according to TNM stage was ana- lyzed using the Kruskal-Wallis test. The maximal χ2 method was employed to determine the cut-off point between the high NLR group and low NLR group. A Kaplan-Meier estimation was used to plot relapse-free survival (RFS) curves, and log-rank tests were employed to determine the difference between survival curves.
Additionally, the Cox proportional hazards regression analysis
was used to dissect the individual impact of prognostic factors for RFS. All tests were two tailed, and a P-value of less than 0.05 was considered statistically significant. All statistical analyses were performed using SPSS version 18.0 (SPSS Inc., Chicago, IL, USA) and R statistical software, version 2.13.0 (R Foundation for Statisti- cal Computing).
4. Ethical statement
This study was approved by the Institutional Review Board of Chonnam National University Hwasun Hospital (IRB No. 2009- 35) and performed in accordance with the principles of the Decla- ration of Helsinki. All samples were collected after obtaining writ- ten informed consent from the patients.
RESULTS
1. Patient characteristics
The clinical characteristics of the 68 patients with CRC are shown in Table 1. The patient’s age ranged from 41–77 years (mean±SD: 63.2±9.3). The proportion of well, moderately, and poorly differentiated types of CRC was 33.8%, 48.5%, and 17.7%, respectively. The TNM stages of the patients were as follows: 3 (4.4%) had IIA disease, 1 (1.5%) had IIB disease, 4 (5.9%) had IIIA disease, 39 (57.3%) had IIIB disease, and 21 (30.9%) had IIIC dis- ease.
2. Implications of MDSC, lymphocyte subset, and NLR for CRC patients
According to the results of the flow cytometric analysis, the mean values of total MDSC (tMDSC), mMDSC, and gMDSC per- centages were 32.4%, 4.5%, and 27.9%, respectively. Lymphocyte subsets, MDSC, and NLR were not significantly different when compared according to TNM stages. The MDSC subsets did not show a statistically significant difference according to TNM stages and histologic CRC types (Fig. 1). The lymphocyte and MDSC subsets were not significantly correlated, while the NLR showed a weak positive correlation with gMDSC (correlation coefficient 0.248; P=0.043). Tumor size, preoperative CEA levels, lymph node metastases, and the number of recurrence cases were not significantly different according to the MDSC group (Table 2).
Meanwhile, lymphovascular invasions (44.1% vs. 23.5%; P<0.005) and perineural invasions (55.9% vs. 47.1%; P=0.001) were more
Table 1. Clinicopathologic characteristics of 68 patients with colorec- tal cancer
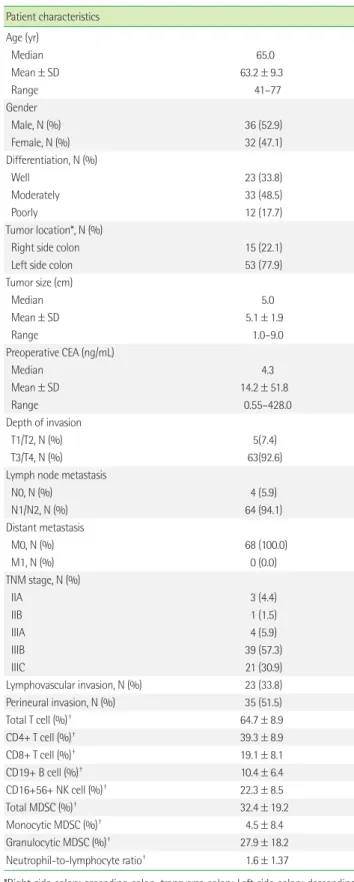
Patient characteristics Age (yr)
Median 65.0
Mean±SD 63.2±9.3
Range 41–77
Gender
Male, N (%) 36 (52.9)
Female, N (%) 32 (47.1)
Differentiation, N (%)
Well 23 (33.8)
Moderately 33 (48.5)
Poorly 12 (17.7)
Tumor location*, N (%)
Right side colon 15 (22.1)
Left side colon 53 (77.9)
Tumor size (cm)
Median 5.0
Mean±SD 5.1±1.9
Range 1.0–9.0
Preoperative CEA (ng/mL)
Median 4.3
Mean±SD 14.2±51.8
Range 0.55–428.0
Depth of invasion
T1/T2, N (%) 5(7.4)
T3/T4, N (%) 63(92.6)
Lymph node metastasis
N0, N (%) 4 (5.9)
N1/N2, N (%) 64 (94.1)
Distant metastasis
M0, N (%) 68 (100.0)
M1, N (%) 0 (0.0)
TNM stage, N (%)
IIA 3 (4.4)
IIB 1 (1.5)
IIIA 4 (5.9)
IIIB 39 (57.3)
IIIC 21 (30.9)
Lymphovascular invasion, N (%) 23 (33.8)
Perineural invasion, N (%) 35 (51.5)
Total T cell (%)† 64.7±8.9
CD4+ T cell (%)† 39.3±8.9
CD8+ T cell (%)† 19.1±8.1
CD19+ B cell (%)† 10.4±6.4
CD16+56+ NK cell (%)† 22.3±8.5
Total MDSC (%)† 32.4±19.2
Monocytic MDSC (%)† 4.5±8.4
Granulocytic MDSC (%)† 27.9±18.2
Neutrophil-to-lymphocyte ratio† 1.6±1.37
*Right side colon: ascending colon, transverse colon; Left side colon: descending colon, sigmoid colon, rectosigmoid junction, and rectum. †Mean±SD.
Abbreviations: MDSC, myeloid-derived suppressor cell; CEA, carcinoembryonic an- tigen.
frequent in the low mMDSC group than in the high mMDSC group. Tumors were larger (mean: 5.7 cm vs. 4.5 cm; P=0.015) in the high CD8+ T-cell group than in the low CD8+ T-cell group (Table 3). The high CD19+ B-cell group showed bigger tumor sizes (mean: 5.6 cm vs. 4.6 cm; P=0.042) and more perineural in- vasions (64.7% vs. 38.2%, P=0.031) than the low CD19+ B-cell group (Table 4). Although not significant, the high NLR group had slightly more cases of poorly differentiated CRC (19.1% vs. 15.0%, P=0.062) than the low NLR group.
3. Univariate and multivariate survival analyses of prognostic factors for RFS
Interestingly, the high CD19+ B-cell group (P=0.012) revealed moderately inferior RFS than the low CD19+ B-cell group (Fig. 2).
In addition, Cox regression analysis for independent variables, such as age, sex, tumor size, TNM staging, preoperative CEA level, MDSC (%), CD3+ total T cell (%), CD4+ T cell (%), CD8+ T cell (%), CD19+ B cell (%), CD16+56+ NK cell (%), and NLR showed that only CD19+ B-cell (%) was an independent signifi- cant predictor for RFS (HR=1.180; 95% CI: 1.040–1.337; P=0.010).
DISCUSSION
The functional interdependence between MDSCs, T-cells, and cancer cells in CRC pathogenesis has been previously reported, and indicates that elevated levels of MDSCs are correlated with advanced TNM stages and lymph node metastases [11]. These re- searchers propose that CRC cells mediate MDSC induction, and these tumor-induced MDSCs can suppress T-cell proliferation and promote CRC cell growth. Zhang et al. [12] also showed that in- creased MDSCs in patients with CRC are correlated with the can- cer stage and metastases. They also suggested that a pharmaco- logic blockade of MDSCs should be considered in clinical trials.
By contrast, Gabitass et al. [13] reported that no significant associ- ation existed between cancer stages and MDSCs. Moreover, Sun et al. [4] showed that patients with a high MDSC frequency did not have high odds for progressing into advanced stages, although their likelihood of metastases was significantly high.
In this study, no significant difference between lymph node metastases, TNM stage, tumor size, number of recurrence cases, and the histologic CRC types according to MDSC proportion was Fig. 1. The association between MDSC subset proportion and TMN stages (A–C) and histologic types of colorectal cancer (D–F), as determined by flow cytometric analysis.
1.0 0.8 0.6 0.4 0.2 0
1.0 0.8 0.6 0.4 0.2 0
1.0 0.8 0.6 0.4 0.2 0
1.0 0.8 0.6 0.4 0.2 0
1.0 0.8 0.6 0.4 0.2 0
Relapse free survivalRelapse free survival Relapse free survivalRelapse free survival Relapse free survival
Time (mo)
Time (mo)
Time (mo)
Time (mo)
Time (mo) P=0.185
P=0.012
P=0.461
P=0.061
P=0.461 0 5 10 15 20 25 30
0 5 10 15 20 25 30
0 5 10 15 20 25 30
0 5 10 15 20 25 30
0 5 10 15 20 25 30 A
D
B
E
C High mMDSC group
High CD19+ B cell group
High gMDSC group
High NLR group
High tMDSC group
Low mMDSC group Low gMDSC group
Low NLR group
Low tMDSC group
Low CD19+ B cell group
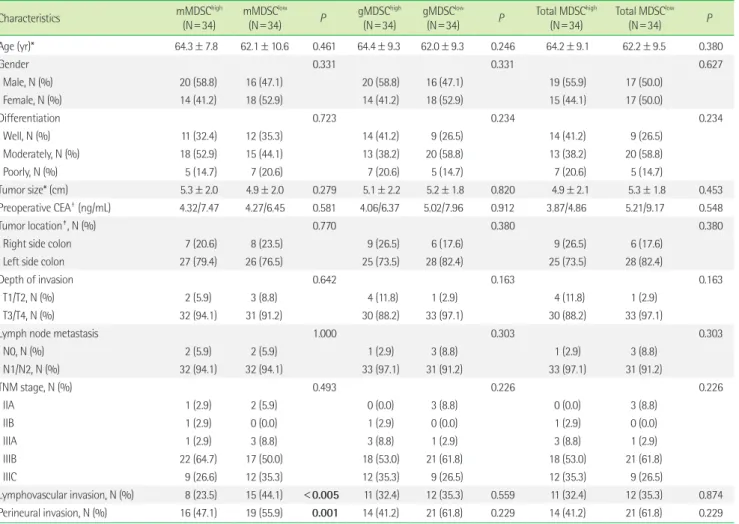
Table 2. Relationship between proportion of MDSC and clinicopathological parameters
Characteristics mMDSChigh
(N=34) mMDSClow
(N=34) P gMDSChigh
(N=34) gMDSClow
(N=34) P Total MDSChigh
(N=34) Total MDSClow
(N=34) P
Age (yr)* 64.3±7.8 62.1±10.6 0.461 64.4±9.3 62.0±9.3 0.246 64.2±9.1 62.2±9.5 0.380
Gender 0.331 0.331 0.627
Male, N (%) 20 (58.8) 16 (47.1) 20 (58.8) 16 (47.1) 19 (55.9) 17 (50.0)
Female, N (%) 14 (41.2) 18 (52.9) 14 (41.2) 18 (52.9) 15 (44.1) 17 (50.0)
Differentiation 0.723 0.234 0.234
Well, N (%) 11 (32.4) 12 (35.3) 14 (41.2) 9 (26.5) 14 (41.2) 9 (26.5)
Moderately, N (%) 18 (52.9) 15 (44.1) 13 (38.2) 20 (58.8) 13 (38.2) 20 (58.8)
Poorly, N (%) 5 (14.7) 7 (20.6) 7 (20.6) 5 (14.7) 7 (20.6) 5 (14.7)
Tumor size* (cm) 5.3±2.0 4.9±2.0 0.279 5.1±2.2 5.2±1.8 0.820 4.9±2.1 5.3±1.8 0.453
Preoperative CEA† (ng/mL) 4.32/7.47 4.27/6.45 0.581 4.06/6.37 5.02/7.96 0.912 3.87/4.86 5.21/9.17 0.548
Tumor location‡, N (%) 0.770 0.380 0.380
Right side colon 7 (20.6) 8 (23.5) 9 (26.5) 6 (17.6) 9 (26.5) 6 (17.6)
Left side colon 27 (79.4) 26 (76.5) 25 (73.5) 28 (82.4) 25 (73.5) 28 (82.4)
Depth of invasion 0.642 0.163 0.163
T1/T2, N (%) 2 (5.9) 3 (8.8) 4 (11.8) 1 (2.9) 4 (11.8) 1 (2.9)
T3/T4, N (%) 32 (94.1) 31 (91.2) 30 (88.2) 33 (97.1) 30 (88.2) 33 (97.1)
Lymph node metastasis 1.000 0.303 0.303
N0, N (%) 2 (5.9) 2 (5.9) 1 (2.9) 3 (8.8) 1 (2.9) 3 (8.8)
N1/N2, N (%) 32 (94.1) 32 (94.1) 33 (97.1) 31 (91.2) 33 (97.1) 31 (91.2)
TNM stage, N (%) 0.493 0.226 0.226
IIA 1 (2.9) 2 (5.9) 0 (0.0) 3 (8.8) 0 (0.0) 3 (8.8)
IIB 1 (2.9) 0 (0.0) 1 (2.9) 0 (0.0) 1 (2.9) 0 (0.0)
IIIA 1 (2.9) 3 (8.8) 3 (8.8) 1 (2.9) 3 (8.8) 1 (2.9)
IIIB 22 (64.7) 17 (50.0) 18 (53.0) 21 (61.8) 18 (53.0) 21 (61.8)
IIIC 9 (26.6) 12 (35.3) 12 (35.3) 9 (26.5) 12 (35.3) 9 (26.5)
Lymphovascular invasion, N (%) 8 (23.5) 15 (44.1) <0.005 11 (32.4) 12 (35.3) 0.559 11 (32.4) 12 (35.3) 0.874 Perineural invasion, N (%) 16 (47.1) 19 (55.9) 0.001 14 (41.2) 21 (61.8) 0.229 14 (41.2) 21 (61.8) 0.229
*Mean±SD. †Median/interquartile range (reference range of CEA: 0–5 ng/mL). ‡Right side colon: ascending colon, transverse colon; Left side colon: descending colon, sig- moid colon, rectosigmoid junction, and rectum. Statistical significance is indicated by boldface type.
Abbreviation: CEA, carcinoembryonic antigen.
observed, except for the lymphovascular or perineural invasion, which was not observed in the high mMDSC group but was ob- served in the low mMDSC group. The previous studies by OuY- ang et al. [11] and Zhang et al. [12], unlike the current study on CRC patients with TNM stage II–III, were performed using a suffi- cient patient pool comprising cases of TNM stage I–IV, including distant metastases.
Previously, Tada et al. [5] also suggested that a combined as- sessment of the immune-suppressive cells (mMDSC) and cyto- toxic effector cells (CD4+ T-cells and CD8+ T-cells) might provide a more appropriate reflection of the patients’ immune status and could yield a significant correlation between immune status and prognoses. Indeed, a short progression-free survival was ob- served in the high mMDSC group and in the low effector T-cell group in their report. However, in this study, we did not observe
any prognostic impact of MDSCs or T-cells with respect to RFS.
These conflicting results might have been caused by the hetero- geneous nature of MDSCs themselves and the complex regulatory functions of different immune and non-immune cells with re- spect to tumors, as described previously [14].
The prognostic value or role of NLR in patients with CRC has also been previously reported. For instance, Haram et al. [9] re- ported that NLR is a useful biomarker in delineating patients with CRC who have a poor prognosis and may benefit from adjuvant therapies. In the study by Li et al. [6], elevated pretreatment NLR predicted poor overall survival and progression-free survival in patients with CRC, and increased NLR was also significantly asso- ciated with poor tumor differentiation. Moreover, Kubo et al. [7]
reported that not only the preoperative but also the postoperative NLR is a predictor of the long-term survival of patients with CRC.
In this study, the high NLR group showed a slightly inferior RFS as compared with the low NLR group (P=0.061), although the dif- ference was not statistically significant (Fig. 2). The overall sur- vival analyses were not performed because all enrolled CRC pa- tients were alive from the time of diagnosis to the time of retro- spective analyses.
As mentioned above, we investigated the impact of MDSCs, lymphocyte subsets, and NLR for their prognostic value in CRC patients and demonstrated that the CD19+ B-cell proportion was the only independent prognostic factor for CRC relapse (HR=1.180; 95% CI: 1.040–1.337; P=0.010). Additionally, an infe- rior RFS was found in the high CD19+ B-cell group as compared to the low CD19+ B-cell group after univariate Kaplan-Meier esti- mation (Fig. 2). The high CD19+ B-cell group also showed bigger tumor sizes and more perineural invasions as compared to the
low CD19+ B-cell group. According to a previous report [15], B- cells inhibit anti-tumor T-cell responses through antigen non-spe- cific mechanisms and migrate to the tumor site and induce the ex- pression of immunosuppressive ligands or cytokines that contrib- ute to the inhibition of the anti-tumor immune response. These explanations could be applied to the findings of the current study as well.
In the present study, the MDSC proportion did not serve as an important factor for predicting the clinical outcomes of patients with primary stage II and III CRC who underwent curative resec- tion. This might be attributed to the high efficacy of surgical re- section and postoperative chemotherapy in those patients. Alter- natively, it might be due to the short duration before follow-up and an insufficient patient pool. Given these limitations, this study may be inadequate in evaluating the role of MDSC propor- Table 3. Relationship between the proportion of T lymphocytes and clinicopathological parameters
Characteristics Total
T cellhigh (N=34)
Total T celllow (N=34)
P CD4+
T cellhigh (N=34)
CD4+
T celllow (N=34)
P CD8+
T cellhigh (N=34)
CD8+
T celllow (N=34)
P
Age (yr)* 62.8±9.8 63.6±8.9 0.773 63.0±8.3 63.4±10.3 0.681 63.4±10.1 63.0±8.6 0.731
Gender 0.331 0.627 0.331
Male, N (%) 16 (47.1) 20 (58.8) 17 (50.0) 19 (55.9) 20 (58.8) 16 (47.1)
Female, N (%) 18(52.9) 14 (41.2) 17 (50.0) 15 (44.1) 14 (41.2) 18 (52.9)
Differentiation 0.686 0.686 0.723
Well, N (%) 10 (29.4) 13 (38.2) 13 (38.2) 10 (29.4) 12 (35.3) 11 (32.4)
Moderately, N (%) 17 (50.0) 16 (47.1) 16 (47.1) 17 (50.0) 15 (44.1) 18 (52.9)
Poorly, N (%) 7 (20.6) 5 (14.7) 5 (14.7) 7 (20.6) 7 (20.6) 5 (14.7)
Tumor size* (cm) 5.5±2.1 4.7±1.9 0.147 5.1±2.1 5.2±2.0 0.897 5.7±1.9 4.5±1.9 0.015
Preoperative CEA† (ng/mL) 4.19/7.43 4.44/6.16 0.912 4.40/6.20 4.24/8.36 0.650 4.38/7.59 4.17/6.32 0.624
Tumor location‡, N (%) 0.770 0.380 0.770
Right side colon 7 (20.6) 8 (23.5) 6 (17.6) 9 (26.5) 7 (20.6) 8 (23.5)
Left side colon 27 (79.4) 26 (76.5) 28 (82.4) 25 (73.5) 27 (79.4) 26 (76.5)
Depth of invasion 0.163 0.642 0.642
T1/T2, N (%) 4 (11.8) 1 (2.9) 3 (8.8) 2 (5.9) 3 (8.8) 2 (5.9)
T3/T4, N (%) 30 (88.2) 33 (97.1) 31 (91.2) 32 (94.1) 31 (91.2) 32 (94.1)
Lymph node metastasis 0.303 1.000 0.303
N0, N (%) 1 (2.9) 3 (8.8) 2 (5.9) 2 (5.9) 1 (2.9) 3 (8.8)
N1/N2, N (%) 33 (97.1) 31 (91.2) 32 (94.1) 32 (94.1) 33 (97.1) 31 (91.2)
TNM stage, N (%) 0.559 0.843 0.366
IIA 1 (2.9) 2 (5.9) 2 (5.9) 1 (2.9) 1 (2.9) 2 (5.9)
IIB 0 (0.0) 1 (2.9) 0 (0.0) 1 (2.9) 0 (0.0) 1 (2.9)
IIIA 3 (8.8) 1 (2.9) 2 (5.9) 2 (5.9) 2 (5.9) 2 (5.9)
IIIB 18 (52.9) 21 (61.8) 20 (58.8) 19 (55.9) 17 (50.0) 22 (64.7)
IIIC 12 (35.4) 9 (26.5) 10 (29.4) 11 (32.4) 14 (41.2) 7 (20.6)
Lymphovascular invasion, N (%) 14 (41.2) 9 (26.5) 0.183 10 (29.4) 13 (38.2) 0.298 15 (44.1) 8 (23.5) 0.054
Perineural invasion, N (%) 18 (52.9) 17 (50.0) 0.220 21 (61.8) 14 (41.2) 0.229 14 (41.2) 21 (61.8) 0.111
*Mean±SD. †Median/interquartile range (reference range of CEA: 0–5 ng/mL). ‡Right side colon: ascending colon, transverse colon; Left side colon: descending colon, sig- moid colon, rectosigmoid junction, and rectum. Statistical significance is indicated by boldface type.
Abbreviation: CEA, carcinoembryonic antigen.
tion in the regulation of patient immune function and in predict- ing the outcomes and clinicolaboratory parameters of postopera- tive patients with CRC. Moreover, our data were collected from a single center in Korea, so the findings may not be generalized to other institutions. Thus, the limited number of patients and the short follow-up period might preclude definitive conclusions on the clinical impact of MDSC, lymphocyte subset, and NLR for CRC patients.
In conclusion, the proportion of MDSCs in the peripheral blood of patients with CRC during the diagnostic stage was not associ- ated with TNM stage or any clinicopathological parameters. In patients with operable stage II and III CRC, MDSCs were not a significant prognostic factor. However, among the lymphocyte subsets, the CD19+ B-cell proportion did show some ability to predict clinical outcomes. Thus, a preoperative evaluation of
CD19+ B-cell proportion is recommended for predicting the clini- cal outcomes of patients with CRC. Further studies to accumulate more evidence are needed to determine the clinical impact of MDSCs, lymphocyte subsets, and NLR in patients with CRC.
요 약
배경: 수술 전에 측정한 골수유래-억제세포, 호중구-림프구비율, 그리고 림프구아형검사 결과는 결장직장암에서 임상적으로 관련 이 있는 것으로 보고되고 있다. 그러나, 이들 각 지표의 임상적 영 향에 대한 연구결과들은 논의의 여지가 있어왔다. 게다가, 한국인 결장직장암 환자들에서 이러한 지표들에 대한 심도 있는 연구들 은 부족한 실정이다.
방법: 수술적 절제치료를 받은 68명의 결장직장암 환자를 대상으 로 하여, 진단 당시의 호중구-림프구비율을 자동화혈구세포 측정 Table 4. Relationship between the proportion of B lymphocytes/NK cells and clinicopathological parameters
Characteristics CD19+ B cellhigh
(N=34) CD19+ B celllow
(N=34) P CD16+56+ NK-cellhigh
(N=34) CD16+56+ NK-celllow
(N=34) P
Age (yr)* 61.7±9.9 64.7±8.5 0.234 64.0±8.3 62.4±10.2 0.606
Gender 1.000 0.145
Male, N (%) 18 (52.9) 18 (52.9) 21 (61.8) 15 (44.1)
Female, N(%) 16 (47.1) 16 (47.1) 13 (38.2) 19 (55.9)
Differentiation 0.438 0.429
Well, N (%) 12 (35.3) 11 (32.4) 9 (26.5) 14 (41.2)
Moderately, N (%) 18 (52.9) 15 (44.1) 18 (52.9) 15 (44.1)
Poorly, N (%) 4 (11.8) 8 (23.5) 7 (20.6) 5 (14.7)
Tumor size* (cm) 5.6±1.9 4.6±2.0 0.042 4.9±2.0 5.4±2.0 0.410
Preoperative CEA† (ng/mL) 4.40/5.94 4.14/8.27 0.540 4.07/4.98 4.84/7.73 0.624
Tumor location‡, N (%) 0.770 0.077§
Right side colon 7 (20.6) 8 (23.5) 11 (32.4) 4 (11.8)
Left side colon 27 (79.4) 26 (76.5) 23 (67.6) 30 (88.2)
Depth of invasion 0.642 0.163
T1/T2, N (%) 2 (5.9) 3 (8.8) 1 (2.9) 4 (11.8)
T3/T4, N (%) 32 (94.1) 31 (91.2) 33 (97.1) 30 (88.2)
Lymph node metastasis 1.000 1.000
N0, N (%) 2 (5.9) 2 (5.9) 2 (5.9) 2 (5.9)
N1/N2, N (%) 32 (94.1) 32 (94.1) 32 (94.1) 32 (94.1)
TNM stage, N (%) 0.843 0.661
IIA 2 (5.9) 1 (2.9) 1 (2.9) 2 (5.9)
IIB 0 (0.0) 1 (2.9) 1 (2.9) 0 (0.0)
IIIA 2 (5.9) 2 (5.9) 1 (2.9) 3 (8.8)
IIIB 19 (55.9) 20 (58.9) 20 (58.9) 19 (55.9)
IIIC 11 (32.3) 10 (29.4) 11 (32.4) 10 (29.4)
Lymphovascular invasion, N (%) 12 (35.3) 11 (32.4) 0.559 13 (38.2) 10 (29.4) 0.735
Perineural invasion, N (%) 22 (64.7) 13 (38.2) 0.031 14 (41.2) 21 (61.8) 0.229
*Mean±SD. †Median/interquartile range (reference range of CEA: 0–5 ng/mL). ‡Right side colon: ascending colon, transverse colon; Left side colon: descending colon, sig- moid colon, rectosigmoid junction, and rectum. §P value by Fisher’s Exact Test. Statistical significance is indicated by boldface type.
Abbreviations: MDSC, myeloid-derived suppressor cell; CEA, carcinoembryonic antigen.
장비를 사용하여 산출하였고, 유세포분석을 통하여 진단 당시의 림프구아형 검사와 골수유래-억제세포 측정을 진행하였다. 대상환 자들의 임상 및 검사실 소견을 각 검사의 지표에 따라 분석하였다.
결과: 림프구아형, 골수유래-억제세포, 호중구-림프구비율의 분포 는 TNM 병기체계와 관련성을 보이지는 않았다. CD19양성 B세포 가 많은 군에서는 유의하게 암의 크기가 더 크고(P=0.042), 신경
주위 침범이 더 많음을(P=0.031) 볼 수 있었다. 그외에 통계적 중 요성을 보이지는 않았으나, 과립구성 골수유래-억제세포가 많은 군(P=0.234), 전체 골수유래-억제세포가 많은 군(P=0.234), 호중
구-림프구비율이 높은 군(P=0.062)에서는 저분화형 결장직장암
증례가 좀더 많았다. 또한, CD19양성 B세포가 많은 환자군 (P=0.012)은 무재발-생존기간이 더 짧음을 알 수 있었다.
Fig. 2. Kaplan-Meier analyses of relapse-free survival (RFS) for colorectal cancer patients, stratified according to myeloid-derived suppressor cell (MDSC) proportion (A-C), CD19+ B-cell proportion (D), and neutrophil-to-lymphocyte ratio (NLR) (E). The clinical RFS outcomes were moderately affected by the CD19+ B-cell proportion (D).
Abbreviations: mMDSC, monocytic MDSC; gMDSC, granulocytic MDSC; tMDSC, total MDSC.
60
40
20
0
80
60
40
20
0
80
60
40
20
0
60
40
20
0
80
60
40
20
0
80
60
40
20
0
Monocytic MDSC (%)Granulocytic MDSC (%)Total MDSC (%) Monocytic MDSC (%)Granulocytic MDSC (%)Total MDSC (%)
P=0.8730
P=0.1227
P=0.2870
P=0.8127
P=0.1507
P=0.4993 II-A
II-A
II-A
Well
Well
Well
Moderately
Moderately
Moderately
Poorly
Poorly
Poorly II-B
II-B
II-B
III-A
III-A
III-A
III-B
III-B
III-B
III-C
III-C
III-C A
B
C
D
E
F
결론: 수술 전 CD19양성 B세포의 분포를 측정하는 것은 TNM 병 기 II-III 결장직장암 환자에서 임상적 예후를 예측하는데 도움을 줄 수 있으리라 판단된다.
Conflicts of Interest
None declared.
Acknowledgements
This study was supported by the National Research Foundation of Korea (NRF-2018R1D1A1B07040984) and grants through the NRF funded by the Ministry of Education, Science and Technology (MEST), and grants from the Environmental Health Center funded by the Ministry of Environment, Republic of Korea.
REFERENCES
1. Umansky V, Blattner C, Gebhardt C, Utikal J. The role of myeloid-de- rived suppressor cells (MDSC) in cancer progression. Vaccines (Basel) 2016;4:E36.
2. Gabrilovich DI and Nagaraj S. Myeloid-derived suppressor cells as reg- ulators of the immune system. Nat Rev Immunol 2009;9:162-74.
3. Hirbod-Mobarakeh A, Mirghorbani M, Hajiju F, Marvi M, Bashiri K, Rezaei N. Myeloid-derived suppressor cells in gastrointestinal cancers:
A systematic review. J Gastroenterol Hepatol 2016;31:1246-56.
4. Sun HL, Zhou X, Xue YF, Wang K, Shen YF, Mao JJ, et al. Increased frequency and clinical significance of myeloid-derived suppressor cells in human colorectal carcinoma. World J Gastroenterol 2012;18:
3303-9.
5. Tada K, Kitano S, Shoji H, Nishimura T, Shimada Y, Nagashima K, et al. Pretreatment immune status correlates with progression-free sur- vival in chemotherapy-treated metastatic colorectal cancer patients.
Cancer Immunol Res 2016;4:592-9.
6. Li MX, Liu XM, Zhang XF, Zhang JF, Wang WL, Zhu Y, et al. Prognos-
tic role of neutrophil-to-lymphocyte ratio in colorectal cancer: a sys- tematic review and meta-analysis. Int J Cancer 2014;134:2403-13.
7. Kubo T, Ono S, Ueno H, Shinto E, Yamamoto J, Hase K. Impact of the perioperative neutrophil-to-lymphocyte ratio on the long-term sur- vival following an elective resection of colorectal carcinoma. Int J Colorectal Dis 2014;29:1091-9.
8. Pine JK, Morris E, Hutchins GG, West NP, Jayne DG, Quirke P, et al.
Systemic neutrophil-to-lymphocyte ratio in colorectal cancer: the rela- tionship to patient survival, tumour biology and local lymphocytic re- sponse to tumour. Br J Cancer 2015;113:204-11.
9. Haram A, Boland MR, Kelly ME, Bolger JC, Waldron RM, Kerin MJ.
The prognostic value of neutrophil-to-lymphocyte ratio in colorectal cancer: A systematic review. J Surg Oncol 2017;115:470-9.
10. Peng F, Hu D, Lin X, Chen G, Liang B, Li C, et al. The monocyte to red blood cell count ratio is a strong predictor of postoperative survival in colorectal cancer patients: The Fujian prospective investigation of can- cer (FIESTA) study. J Cancer 2017;8:967-75.
11. OuYang LY, Wu XJ, Ye SB, Zhang RX, Li ZL, Liao W, et al. Tumor-in- duced myeloid-derived suppressor cells promote tumor progression through oxidative metabolism in human colorectal cancer. J Transl Med 2015;13:47.
12. Zhang B, Wang Z, Wu L, Zhang M, Li W, Ding J, et al. Circulating and tumor-infiltrating myeloid-derived suppressor cells in patients with colorectal carcinoma. PLoS One 2013;8:e57114.
13. Gabitass RF, Annels NE, Stocken DD, Pandha HA, Middleton GW. Ele- vated myeloid-derived suppressor cells in pancreatic, esophageal and gastric cancer are an independent prognostic factor and are associated with significant elevation of the Th2 cytokine interleukin-13. Cancer Immunol Immunother 2011;60:1419-30.
14. Lindau D, Gielen P, Kroesen M, Wesseling P, Adema GJ. The immuno- suppressive tumour network: myeloid-derived suppressor cells, regu- latory T cells and natural killer T cells. Immunology 2013;138:105-15.
15. Zhang Y, Morgan R, Podack ER, Rosenblatt J. B cell regulation of anti- tumor immune response. Immunol Res 2013;57:115-24.