ORIGINAL ARTICLE
장기간 경구 항바이러스제 치료를 시행받은 만성 B형간염 환자에서 HBeAg 상태 및 약물 종류에 따른 HBsAg 정량값의 변화 비교
나종화, 김정한, 최원혁, 권소영, 유병철
건국대학교 의학전문대학원 내과학교실
Changes in the Hepatitis B Surface Antigen Level According to the HBeAg Status and Drug Used in Long-term Nucleos(t)ide Analog-treated Chronic Hepatitis B Patients
Jong Hwa Na, Jeong Han Kim, Won Hyeok Choe, So Young Kwon and Byung Chul Yoo Department of Internal Medicine, Konkuk University School of Medicine, Seoul, Korea
Background/Aims: The HBsAg levels have been used to monitor the chronic hepatitis B (CHB) treatment response to antiviral therapy.
On the other hand, it is unclear if the HBsAg quantification levels at each treatment point differ according to the HBeAg status and drug in CHB patients. This study compared the changes in HBsAg in CHB patients according to the HBeAg status and treatment drugs.
Methods: CHB patients with at least 1 year of follow-up treatment with one drug, either entecavir (ETV) or tenofovir (TDF), were enrolled in this study. The mean HBsAg levels were measured annually for up to 6 years. A linear mixed model was used to compare the HBsAg quantification levels during the follow-up period. An independent samples t-test was used to analyze the differences in the HBsAg quantification levels at each treatment time point.
Results: Ninety-seven patients were enrolled in this study; 59 among them were HBeAg-positive. Two patients in the TDF group achieved HBsAg seroconversion. The HBsAg level decreased during the follow-up in the ETV and TDF groups. The HBsAg level was lower in the TDF group than the ETV group during the follow-up. On the other hand, subgroup analysis showed that this trend was the same only in the HBeAg-negative patients, not in the HBeAg-positive patients. In the HBeAg-negative patients, HBsAg level in the TDF group was significantly lower than that in the ETV group at 36, 48, and 72 months. The change in HBsAg level from the baseline increased at a decreasing rate during the follow-up in both groups. Furthermore, the change in the HBsAg level in the TDF group was significantly larger than that of the ETV group at 36 months in the HBeAg-negative patients.
Conclusions: Although TDF might be more efficient than ETV in reducing the HBsAg level in HBeAg-negative patients in a few years, HBsAg seroconversion occurred very rarely. A further large-scale, long-term study will be needed to confirm the antiviral effects on the HBsAg level. (Korean J Gastroenterol 2021;77:285-293)
Key Words: Hepatitis B surface antigens; Nucleos(t)ide analogue; Hepatitis B, chronic
Received March 12, 2021. Revised June 2, 2021. Accepted June 4, 2021.
CC This is an open access article distributed under the terms of the Creative Commons Attribution Non-Commercial License (http://creativecommons.org/licenses/
by-nc/4.0) which permits unrestricted non-commercial use, distribution, and reproduction in any medium, provided the original work is properly cited.
Copyright © 2021. Korean Society of Gastroenterology.
교신저자: 김정한, 05029, 서울시 광진구 능동로 120, 건국대학교 의학전문대학원 내과학교실
Correspondence to: Jeong Han Kim, Department of Internal Medicine, Konkuk University School of Medicine, 120 Neungdong-ro, Gwangjin-gu, Seoul 05029, Korea. Tel: +82-2-2030-7764, Fax: +82-2-2030-5029, E-mail: 93haan@hanmail.net, ORCID: https://orcid.org/0000-0002-8383-8524
Financial support: None. Conflict of interest: None.
INTRODUCTION
The World Health Organization estimates that 257 million people are affected by chronic HBV infections.1 If chronic hep-
atitis B (CHB) is left untreated, approximately 15-40% of pa- tients are likely to develop progressive liver diseases, such as liver cirrhosis or hepatocellular carcinoma, which are the common causes of HBV-related deaths.2 Therefore, it is vital
to treat and monitor patients with CHB infection.
Currently, several nucleos(t)ide analogs (NAs), such as lam- ivudine, adefovir dipivoxil, entecavir (ETV), telbivudine, and te- nofovir disoproxil fumarate (TDF), have been approved for the treatment of chronic HBV infections.3 All these NAs assist in targeting the inhibition of HBV DNA polymerase, inclusion in viral DNA, and chain termination. Based on the development of novel drugs and the weakness of conventional drugs, the first preferred drugs are constantly changing. ETV and TDF are currently recommended as the first-line treatment options based on the good tolerability, antiviral potency, and a high genetic barrier to resistance.3-5
Several methods can be used to monitor HBV treatments.
The serum HBV DNA quantitative test is the current method used in clinical trials, but while the serum HBV DNA does not reflect intrahepatic HBV cccDNA, a liver biopsy does. On the other hand, a liver biopsy is an invasive test and is un- suitable for monitoring the treatment of CHB patients. Several studies have reported that serum hepatitis B surface antigen (HBsAg) quantification tests, which indirectly reflect the intra- hepatic HBV cccDNA, may be useful.6-10 Despite this, most studies comparing the effectiveness of drugs were based on serum HBV DNA quantitative tests, and only a few studies were based on the HBsAg quantification tests.
Previous studies analyzed the HBsAg quantification levels in CHB patients treated with ETV. On the other hand, it had a short 24-month follow-up period and only provided insight into the predictive ability of seroconversion in the hepatitis B e antigen (HBeAg) positive patients. This study did not show significant differences in quantification levels.9 A study of TDF-treated patients found that the HBsAg levels decreased more in HBeAg-positive patients than in negative patients, but the follow-up period was short.11,12 Given the limitations of the short follow-up of previous studies, it is unclear if the HBsAg quantification levels at each treatment point differed according to the HBeAg status and the treatment drug in CHB patients. This study compared HBsAg quantification changes in CHB patients according to the HBeAg status and treatment drugs.
SUBJECTS AND METHODS
1. Patients
CHB patients who underwent at least 1 year of follow-up
treatment with ETV or TDF at Konkuk University Medical Center were included in this retrospective study. Before the treatment, conventional liver and kidney function tests and serological hepatitis B markers were evaluated. The HBeAg, serum HBV DNA levels, serum HBsAg quantification, anti-hep- atitis C virus antibody, and imaging tests to diagnose liver cirrhosis and hepatocellular carcinoma (HCC) were performed.
1) Inclusion criteria
(1) Presence of serum HBsAg for at least 6 months (2) Presence of HBsAg quantification levels at the initiation
of treatment
(3) HBV DNA level>20,000 IU/mL and ALT>2×upper limit of normal (ULN) in HBeAg-positive cases
HBV DNA level>2,000 IU/mL and ALT>2×ULN in HBeAg-negative cases
(4) Treatment duration of at least 1 year (5) Patients treated with ETV or TDF
2) Exclusion criteria
(1) Patients younger than 18 years of age (2) Patients diagnosed with HCC
(3) HBsAg level has not been measured more than twice (4) Insufficient clinical data
The medical records of the participants were reviewed, and their HBsAg levels were measured annually for up to 6 years.
The final follow-up visit was in April 2021. The data were cen- sored if the patients changed drugs due to side effects, were lost to follow-up, died due to any other cause, or drug resist- ance was confirmed.
All patients provided written informed consent for the CHB treatment and the use of data. The Institutional Review Board of Konkuk University Medical Center approved this study (IRB No. KUH 1010689).
4. HBsAg levels measurement
HBsAg levels were measured at the baseline and annually after treatment, using a chemiluminescent microparticle im- munoassay (Architect HBsAg QT, Abbott Diagnostics, Chicago, IL, USA; measurable range 0.05-250 IU/mL). The HBsAg level was quantified at a 1:500 dilution according to the manu- facturer’s instructions. To bring HBsAg levels to within the measurable range, samples with values above and below this
Fig. 1. Flow diagram of patients enrolled in the study. HBsAg, hepatitis B surface antigen; HBV DNA, hepatitis B DNA; HBeAg, hepatitis B e antigen; TDF, tenofovir disoproxil fumarate; ETV, entecavir.
Table 1. Baseline Characteristics of the 97 Patients Included in the Study Patients characteristics according to the HBeAg status
Total patients (n=97)
HBeAg (+) patients (n=59)
HBeAg (-) patients
(n=38) p-value
Age (years) 46.0 (±11.6) 42.9 (±12.1) 51.0 (±9.1) <0.001
Male 61 (62.9) 39 (66.1) 22 (57.9) 0.414
Duration of all drug (months) 72.9 (±26.0) 70.7 (±25.1) 76.4 (±27.3) 0.301
Duration of ETV (months) 83.3 (±32.1) 76.5 (±32.3) 93.3 (±30.4) 0.150
Duration of TDF (months) 67.8 (±20.9) 68.0 (±20.9) 67.6 (±21.3) 0.939
ETV 32 (33.0) 19 (32.2) 13 (34.2)
TDF 65 (67.0) 40 (67.8) 25 (65.8)
Disease status 0.154
Chronic hepatitis B 62 (63.9) 41 (69.5) 21 (55.3)
Liver cirrhosis 35 (36.1) 18 (30.5) 17 (44.7)
Resistance 2 (2.1) 1 (1.7) 1 (2.6) 1.000
Values are presented as the mean±SD or number (%). Resistance means that it developed after the initiation of NAs treatment in treatment-naïve chronic hepatitis B patients.
ETV, entecavir; TDF, tenofovir; HCC, hepatocellular carcinoma.
range required a lower and higher dilution, respectively.
5. Statistical analysis
The patients’ characteristics are presented as the mean±SD or number (%), as appropriate. A linear mixed model (LMM) was used to compare the HBsAg quantification levels during the follow-up period. Subsequently, an independent samples t-test was used to analyze the differences in the HBsAg quantifi-
cation levels at each treatment point. Furthermore, the change in HBsAg level was compared using LMM analysis. For all statistical tests, a two-sided p-value <0.05 was considered significant. IBM Statistics SPSS 25 was used for statistical analysis.
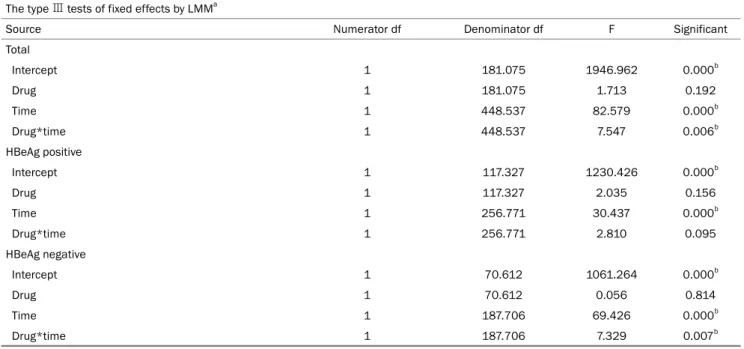
Table 2. Type Ⅲ Tests of Fixed Effects on the HBsAg Level by LMM The type Ⅲ tests of fixed effects by LMMa
Source Numerator df Denominator df F Significant
Total
Intercept 1 181.075 1946.962 0.000b
Drug 1 181.075 1.713 0.192
Time 1 448.537 82.579 0.000b
Drug*time 1 448.537 7.547 0.006b
HBeAg positive
Intercept 1 117.327 1230.426 0.000b
Drug 1 117.327 2.035 0.156
Time 1 256.771 30.437 0.000b
Drug*time 1 256.771 2.810 0.095
HBeAg negative
Intercept 1 70.612 1061.264 0.000b
Drug 1 70.612 0.056 0.814
Time 1 187.706 69.426 0.000b
Drug*time 1 187.706 7.329 0.007b
LMM, linear mixed model; df, degree of freedom.
aDependent variable: HBsAg Log10 IU/mL; bThis value is stastically significant.
RESULTS
Three hundred and nine patients were enrolled in this study. Fig. 1 presents a flowchart of the patients tested for HBV and enrolled in the study. Based on the exclusion cri- teria, 212 patients were excluded, and 97 patients with NAs-treated CHB who fulfilled the inclusion criteria were in- cluded in the study. Fifty-nine patients were HBeAg-positive, and 38 patients were HBeAg-negative. Forty HBeAg-positive and 25 HBeAg-negative patients were treated with TDF; 19 HBeAg-positive and 13 HBeAg-negative patients were treat- ed with ETV.
1. Baseline characteristics of the patients
Table 1 lists the baseline characteristics of the study patients. The majority of the patients were men (61, 62.9%), and the mean patient age was 46.0 years. Specifically, 32 patients were treated with ETV, and 65 patients were treated with TDF. The HBeAg-positive patients were significantly younger than the HBeAg-negative patients (mean age 42.9 vs. 51.0, p<0.001). On the other hand, all the parameters, except for age, were comparable.
2. HBsAg loss and seroconversion
There were two patients with HBsAg seroconversion. One
patient was a 19-year-old man who was HBeAg-positive and treated with TDF. HBsAg seroconversion was identified 12 months after treatment. HBeAg loss was not subsequently tested during the follow-up period. The other patient was a 37-year-old man, who was HBeAg-negative and treated with TDF. HBsAg loss was identified 48 months after treatment;
HBsAg seroconversion was identified 60 months after treatment.
3. HBsAg level
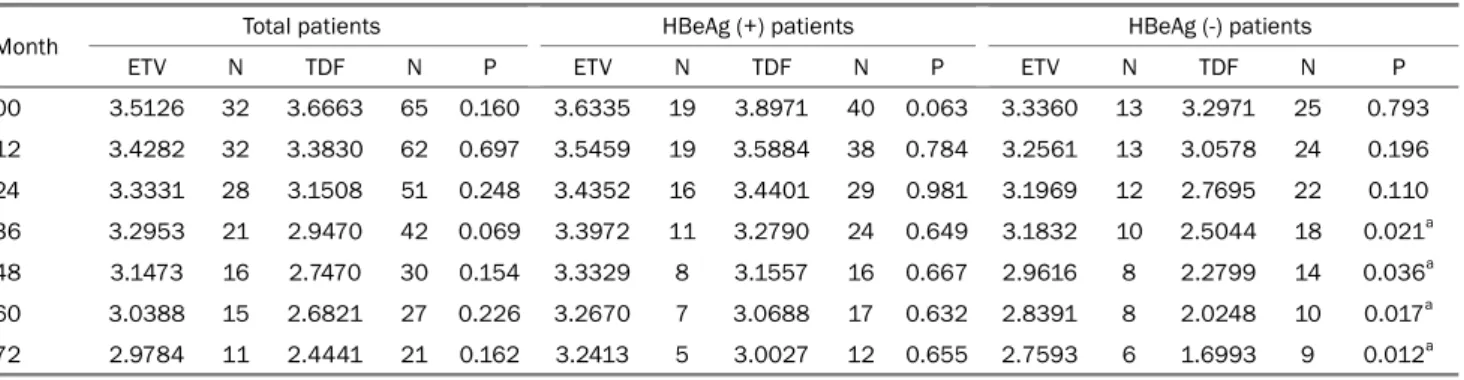
In LMM analysis, the HBsAg level decreased during fol- low-up in the ETV and TDF groups. The TDF treatment groups showed significant differences in the HBsAg levels over time than those in the ETV treatment groups (p=0.006) (Tables 2, 3). On the other hand, the independent samples t-test showed no statistically significant difference when comparing the mean HBsAg levels at each treatment time point (00 month, p=0.160; 12 months, p=0.697; 24 months, p=0.248;
36 months, p=0.069; 48 months, p=0.154; 60 months, p=0.226; 72 months, p=0.162) (Table 4).
The analysis was then conducted separately according to the HBeAg status, which showed significant differences in the HBsAg levels over time in patients with a HBeAg-neg- ative status, but no significant differences in the HBsAg lev- el in the HBeAg-positive patients (HBeAg-negative, p=0.007;
HBeAg-positive, p=0.095) (Tables 2, 3).
Table 3. Estimate of the Fixed Effects on the HBsAg Level by LMM The effects of fixed factors by LMMa
Parameter Estimate Std. Error df t Sig 95% CI
Lower bound Upper bound Total
Intercept 3.839 0.097 181.588 39.523 0.000 3.648 4.031
ETV -0.221 0.169 181.075 -1.309 0.192 -0.554 0.112
TDF 0b 0
Time -0.186 0.018 448.524 -10.164 0.000 -0.222 -0.150
ETV*time 0.086 0.031 448.537 2.747 0.006 0.024 0.148
TDF*time 0b 0
HBeAg positive
Intercept 4.039 0.125 116.735 32.199 0.000 3.791 4.288
ETV -0.315 0.221 117.327 -1.427 0.156 -0.754 0.122
TDF 0b 0
Time -0.165 0.025 256.455 -6.418 0.000 -0.216 -0.114
ETV*time 0.077 0.046 256.771 1.676 0.095 -0.013 0.167
TDF*time 0b 0
HBeAg negative
Intercept 3.505 0.125 71.337 27.984 0.000 3.255 3.755
ETV -0.050 0.213 70.612 -0.236 0.814 -0.476 0.375
TDF 0b 0
Time -0.213 0.023 187.868 -9.067 0.000 -0.259 -0.166
ETV*time 0.104 0.038 187.706 2.707 0.007 0.028 0.180
TDF*time 0b 0
LMM, linear mixed model; CI, confidence interval; Sig, significant; Std, standard; df, degree of freedom; ETV, entecavir; TDF, tenofovir.
aDependent variable: HBsAg Log10 IU/mL; bFactors are set to zero, since they are redundant.
Table 4. Mean HBsAg Log10 IU/mL Level for Each Time According to the HBeAg Status and Drug
Month Total patients HBeAg (+) patients HBeAg (-) patients
ETV N TDF N P ETV N TDF N P ETV N TDF N P
00 3.5126 32 3.6663 65 0.160 3.6335 19 3.8971 40 0.063 3.3360 13 3.2971 25 0.793
12 3.4282 32 3.3830 62 0.697 3.5459 19 3.5884 38 0.784 3.2561 13 3.0578 24 0.196
24 3.3331 28 3.1508 51 0.248 3.4352 16 3.4401 29 0.981 3.1969 12 2.7695 22 0.110
36 3.2953 21 2.9470 42 0.069 3.3972 11 3.2790 24 0.649 3.1832 10 2.5044 18 0.021a
48 3.1473 16 2.7470 30 0.154 3.3329 8 3.1557 16 0.667 2.9616 8 2.2799 14 0.036a
60 3.0388 15 2.6821 27 0.226 3.2670 7 3.0688 17 0.632 2.8391 8 2.0248 10 0.017a
72 2.9784 11 2.4441 21 0.162 3.2413 5 3.0027 12 0.655 2.7593 6 1.6993 9 0.012a
Values are presented as the mean HBsAg Log10 IU/mL.
N, number of patients who participated in the analysis at the time of treatment; ETV, entecavir; TDF, tenofovir.
aThis value is stastically significant.
An independent samples t-test was performed in the HBeAg negative patients to compare the mean HBsAg levels between the two drug treatment groups at each treatment time point.
As a result, statistically significant differences in the mean HBsAg level at 36, 48, 60, and 72 months of the treatment
time points were identified (36 months, p=0.021; 48 months, p=0.036; 60 months, p=0.017; 72 months, p=0.012) (Table 4, Fig. 2).
Further analysis was then performed to compare the changes in the HBsAg levels. The HBsAg level at the initiation
Fig. 2. Dynamic changes in the HBsAg quantification levels during up to 72 months treatment with TDF and ETV in HBeAg negative patients.
HBsAg, hepatitis B surface antigen; ETV, entecavir; TDF, tenofovir.
Table 5. Type Ⅲ Tests of Fixed Effects on the HBsAg Level Change by LMM The type Ⅲ tests of fixed effects by LMMa
Source Numerator df Denominator df F Significant
Total
Intercept 1 131.465 1.160 0.283
Drug 1 131.465 1.940 0.166
Time 1 305.114 113.845 0.000b
Drug*time 1 305.114 2.098 0.148
HBeAg positive
Intercept 1 75.837 0.673 0.415
Drug 1 75.837 0.750 0.389
Time 1 164.771 49.854 0.000b
Drug*time 1 164.771 1.262 0.263
HBeAg negative
Intercept 1 48.060 0.398 0.531
Drug 1 48.060 1.484 0.229
Time 1 30.135 91.435 0.000b
Drug*time 1 30.135 1.473 0.234
LMM, linear mixed model; df, degree of freedom.
aDependent variable: HBsAg Log10 IU/mL; bThis value is stastically significant.
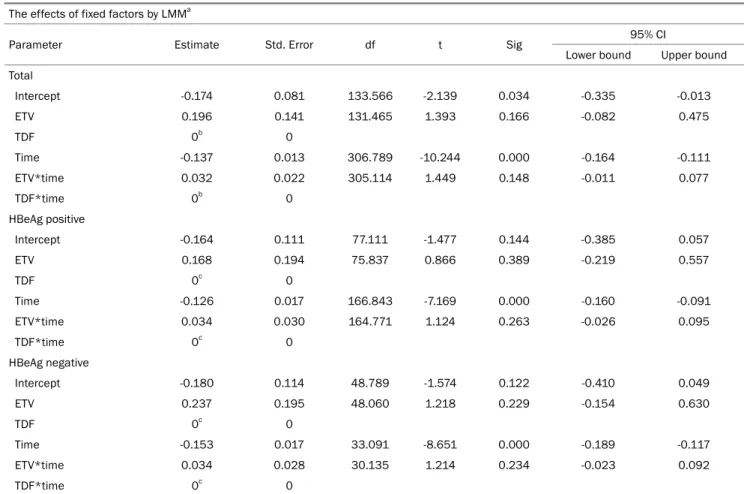
of treatment (00 months) was set to zero, and the differences in the HBsAg levels between the baseline and each treatment time point were compared for each drug through LMM analysis. Although the TDF treatment group showed a de- crease in the HBsAg levels numerically, LMM analysis of these differences from the baseline showed no significant difference between the TDF and ETV treatment groups and no significant difference in the HBeAg status (Total, p=0.148; HBeAg pos-
itive, p=0.263; HBeAg negative, p=0.234) (Tables 5, 6).
DISCUSSION
HBsAg loss and seroconversion in CHB patients are the ultimate goals of anti-HBV therapy.1,3,13 On the other hand, HBsAg loss, and seroconversion are quite rare in CHB pa- tients, and there is also a lack of long-term data on the
Table 6. Estimate of the Fixed Effects on the Change in the HBsAg Level by LMM The effects of fixed factors by LMMa
Parameter Estimate Std. Error df t Sig 95% CI
Lower bound Upper bound Total
Intercept -0.174 0.081 133.566 -2.139 0.034 -0.335 -0.013
ETV 0.196 0.141 131.465 1.393 0.166 -0.082 0.475
TDF 0b 0
Time -0.137 0.013 306.789 -10.244 0.000 -0.164 -0.111
ETV*time 0.032 0.022 305.114 1.449 0.148 -0.011 0.077
TDF*time 0b 0
HBeAg positive
Intercept -0.164 0.111 77.111 -1.477 0.144 -0.385 0.057
ETV 0.168 0.194 75.837 0.866 0.389 -0.219 0.557
TDF 0c 0
Time -0.126 0.017 166.843 -7.169 0.000 -0.160 -0.091
ETV*time 0.034 0.030 164.771 1.124 0.263 -0.026 0.095
TDF*time 0c 0
HBeAg negative
Intercept -0.180 0.114 48.789 -1.574 0.122 -0.410 0.049
ETV 0.237 0.195 48.060 1.218 0.229 -0.154 0.630
TDF 0c 0
Time -0.153 0.017 33.091 -8.651 0.000 -0.189 -0.117
ETV*time 0.034 0.028 30.135 1.214 0.234 -0.023 0.092
TDF*time 0c 0
LMM, linear mixed model; CI, confidence interval; Sig, significant; Std, standard; df, degree of freedom; ETV, entecavir; TDF, tenofovir.
aDependent variable: HBsAg Log10 IU/mL; bFactors are set to zero, since they are redundant.
Table 7. Mean Difference in HBsAg Log10 IU/mL Level from the Baseline (00 Months) for Each Treatment Time Point According to the HBeAg Status and Drug
Months Total patients HBeAg (+) patients HBeAg (-) patients
ETV TDF Significant ETV TDF Significant ETV TDF Significant
12 -0.0844 -0.2854 0.067 -0.0876 -0.3128 0.194 -0.0798 -0.2421 0.082
24 -0.1787 -0.5017 0.012a -0.2066 -0.5255 0.141 -0.1415 -0.4704 0.144
36 -0.1985 -0.6763 0.001a -0.2527 -0.6807 0.051 -0.1389 -0.6705 0.037a
48 -0.3363 -0.8365 0.009a -0.3187 -0.8310 0.170 -0.3539 -0.8429 0.112
60 -0.4630 -0.9837 0.046a -0.4476 -0.8829 0.281 -0.4765 -1.1550 0.050a
72 -0.5418 -1.1265 0.073 -0.3961 -0.9037 0.324 -0.6633 -1.4235 0.066
Data are presented as the mean difference of HBsAg Log10 IU/mL from baseline.
ETV, entecavir; TDF, tenofovir.
aThis value is stastically significant.
changes in the HBsAg levels in patients treated with NAs, including TDF or ETV, which are currently used as first-choice drugs.14
Nevertheless, the utility of the HBsAg quantification test is expanding gradually; it has been used to identify the risk factors for HCC, define the HBV disease phase, monitor pa-
tients treated with interferon and NAs, and predict HBsAg loss in the early stages of treatment.7,15,16
Based on these findings, this study compared the changes in the HBsAg level according to the HBeAg status in CHB pa- tients treated with TDF or ETV over 6 years.
A previous study analyzed the changes in HBsAg levels in
529 CHB patients treated with ETV. Over 49.2 months of ETV treatment, the HBsAg levels decreased at a median annual rate of 0.12 and 0.09 log IU/mL in the HBeAg-positive and -negative patients, respectively.17 Unlike previous studies, this study showed that among the CHB patients treated with ETV, the HBeAg-positive and HBeAg-negative patients showed a 0.06 and 0.11 log IU/mL decrease per year, respectively.
Another study conducted for 144 weeks in patients treated with TDF for more than 4 years on patients with CHB who were HBeAg-negative compared the changes between a TDF stop group and a TDF continue group. The median change in the HBsAg level was a -0.59 log IU/mL in patients who discontinued TDF therapy and remained off-therapy, -0.51 log IU/mL in those who restarted TDF therapy, and -0.21 log IU/mL in patients who continued TDF therapy.18 The present study showed a change of -0.23 log IU/mL per year in HBeAg-negative patients treated with TDF, which is a relatively larger decrease than that in the TDF continuation group in the previous study. The present study period was relatively long (72 months), but the number of patients who partici- pated in the analysis was relatively small. These factors may have caused the difference from the previous research results.
In the case of HBsAg seroconversion in the present study, two patients were identified: one in the HBeAg-positive group and one in the HBeAg-negative group. The annual incidence of HBsAg loss is estimated to be approximately 1% -2% in Asian and Western populations and approximately 0.13% for Asian patients only.14,19,20 In a meta-analysis of 34 studies that included 42,588 CHB patients, HBsAg seroclearance was reported at approximately 1.02% (95% CI 0.79-1.27).21 Similarly, the seroclearance of the HBsAg has been studied widely. On the other hand, studies on the seroconversion of HBsAg are rare, and the data vary widely from study to study.
One study reported that the seroconversion of HBsAg oc- curred in approximately 37.3% of patients with HBsAg loss,22 while another study reported that HBsAg seroconversion oc- curred in approximately 51.7% of the patients with HBsAg loss.23 As such, the loss and seroconversion of HBsAg in pa- tients treated with NAs are very rare and were observed to be rare in the 7-year follow-up period of the present study.
A previous study predicted the timing of HBsAg loss with an annual HBsAg reduction rate in patients treated with NAs.
The median time to HBsAg loss for HBeAg-positive and
HBeAg-negative patients was 36 (9.6-98.3) years and 39 (1.3-80.5) years, respectively, after the start of therapy.24
In the present study, LMM analysis showed that TDF was more effective than ETV in reducing the HBsAg reduction over time. An additional independent samples t-test showed that the difference between these two drug treatment groups was only seen in the HBeAg-negative patient group and significant from the 36 months of treatment (Tables 2-4).
Because each patient had a different baseline HBsAg level, additional analysis was performed to compensate for this. The differences in HBsAg levels between the baseline and at each treatment time point were compared using LMM analysis for each drug. Numerically, the TDF treatment group showed a larger decrease in the HBsAg levels than in the ETV treatment group, but there was no significant difference (Tables 5-7).
This result might be because the baseline HBsAg level of HBeAg-negative patients treated with TDF was relatively lower than the baseline HBsAg level of HBeAg-negative patients treated with ETV, even though there was no significant sig- nificance (Table 4).
This study had some limitations. First, there were a small number of patients who participated in the actual study. Moreover, and the follow-up period increased, fewer patients participated in the analysis at the time of treatment. Thus, the statistical confidence may be rela- tively low. Another limitation is that relatively older patients were involved in the HBeAg-negative patient group regard- ing baseline characteristics. On the other hand, owing to the natural course of the disease, it is believed that the age of HBeAg-negative patients can be relatively high. In addition, the possibility of selection bias is also a limi- tation because some of the total patients treated with CHB were confirmed with the HBsAg level.
This study was a long-term retrospective follow-up analysis evaluating the changes in the HBsAg levels in CHB patients receiving NAs in clinical practice. One of the strengths of this study was that it directly compared the effects of reducing the HBsAg level of ETV and TDF in Korean patients treated with CHB for the long term. On the other hand, during the 72-month follow-up observation, the actual number of HBsAg seroconversions was small.
Therefore, a large-scale and long-term study will be needed to determine if the decrease in HBsAg levels leads to HBsAg loss or seroconversion. Nevertheless, this study is meaningful
because the efficiency of TDF and ETV on the HBsAg level was compared directly over the long term.
In HBeAg-negative patients, the HBsAg levels were lower after 36 months of treatment in patients treated with TDF than in those treated with ETV. Therefore, TDF may be superi- or to ETV regarding the HBsAg level reduction in patients with a HBeAg-negative status.
REFERENCES
1. Terrault NA, Bzowej NH, Chang KM, et al. AASLD guidelines for treatment of chronic hepatitis B. Hepatology 2016;63:261-283.
2. Fattovich G, Bortolotti F, Donato F. Natural history of chronic hep- atitis B: special emphasis on disease progression and prognostic factors. J Hepatol 2008;48:335-352.
3. European Association for the Study of the Liver. EASL 2017 clin- ical practice guidelines on the management of hepatitis B virus infection. J Hepatol 2017;67:370-398.
4. Idilman R, Gunsar F, Koruk M, et al. Long-term entecavir or tenofo- vir disoproxil fumarate therapy in treatment-naïve chronic hep- atitis B patients in the real-world setting. J Viral Hepat 2015;22:
504-510.
5. Pol S, Lampertico P. First-line treatment of chronic hepatitis B with entecavir or tenofovir in 'real-life' settings: from clinical trials to clinical practice. J Viral Hepat 2012;19:377-386.
6. Kim SS, Lee D, Lee MH, Cheong JY, Cho SW. Association of on-treatment serum hepatitis B surface antigen level with sus- tained virological response to nucleos(t)ide analog in patients with hepatitis B e-antigen positive chronic hepatitis B. Hepatol Res 2013;43:219-227.
7. Liaw YF. Clinical utility of hepatitis B surface antigen quantitation in patients with chronic hepatitis B: a review. Hepatology 2011;
53:2121-2129.
8. Lee JM, Ahn SH, Kim HS, et al. Quantitative hepatitis B surface antigen and hepatitis B e antigen titers in prediction of treatment response to entecavir. Hepatology 2011;53:1486-1493.
9. Lee MH, Lee DM, Kim SS, Cheong JY, Cho SW. Correlation of se- rum hepatitis B surface antigen level with response to entecavir in naïve patients with chronic hepatitis B. J Med Virol 2011;83:
1178-1186.
10. Shin JW, Jung SW, Park BR, et al. Prediction of response to en- tecavir therapy in patients with HBeAg-positive chronic hepatitis B based on on-treatment HBsAg, HBeAg and HBV DNA levels. J Viral Hepat 2012;19:724-731.
11. Marcellin P, Heathcote EJ, Buti M, et al. Tenofovir disoproxil fuma-
rate versus adefovir dipivoxil for chronic hepatitis B. N Engl J Med 2008;359:2442-2455.
12. Heathcote EJ, Marcellin P, Buti M, et al. Three-year efficacy and safety of tenofovir disoproxil fumarate treatment for chronic hep- atitis B. Gastroenterology 2011;140:132-143.
13. Lee HW, Lee HJ, Hwang JS, et al. Lamivudine maintenance be- yond one year after HBeAg seroconversion is a major factor for sustained virologic response in HBeAg-positive chronic hepatitis B. Hepatology 2010;51:415-421.
14. Chu CM, Liaw YF. Hepatitis B surface antigen seroclearance dur- ing chronic HBV infection. Antivir Ther 2010;15:133-143.
15. Fung J, Lai CL, Yuen MF. Hepatitis B virus DNA and hepatitis B sur- face antigen levels in chronic hepatitis B. Expert Rev Anti Infect Ther 2010;8:717-726.
16. Chen YC. Hepatitis B surface antigen (HBsAg) levels in the pre- diction of spontaneous HBsAg seroclearance. Hepatology 2013;
57:1675.
17. Peng CY, Lai HC, Su WP, et al. Early hepatitis B surface antigen decline predicts treatment response to entecavir in patients with chronic hepatitis B. Sci Rep 2017;7:42879.
18. Berg T, Simon KG, Mauss S, et al. Long-term response after stop- ping tenofovir disoproxil fumarate in non-cirrhotic HBeAg-neg- ative patients - FINITE study. J Hepatol 2017;67:918-924.
19. Liu J, Yang HI, Lee MH, et al. Incidence and determinants of spon- taneous hepatitis B surface antigen seroclearance: a commun- ity-based follow-up study. Gastroenterology 2010;139:474-482.
20. Chu CM, Liaw YF. HBsAg seroclearance in Asian patients: too high and too bad in Hong Kong. Gastroenterology 2009;136:
1459-1461.
21. Yeo YH, Ho HJ, Yang HI, et al. Factors associated with rates of HBsAg seroclearance in adults with chronic HBV infection: a systematic review and meta-analysis. Gastroenterology 2019;
156:635-646.e9.
22. Zhu L, Zhai X, Wang Q, et al. Incidence and determinants of spon- taneous hepatitis B surface antigen seroclearance and sero- conversion in hepatitis B e antigen-negative chronic infection pa- tients: a population-based prospective cohort. J Viral Hepat 2018;25:1588-1598.
23. Yuen MF, Wong DK, Fung J, et al. HBsAg seroclearance in chronic hepatitis B in Asian patients: replicative level and risk of hepatocellular carcinoma. Gastroenterology 2008;135:
1192-1199.
24. Zoutendijk R, Hansen BE, van Vuuren AJ, Boucher CA, Janssen HL. Serum HBsAg decline during long-term potent nucleos(t)ide analogue therapy for chronic hepatitis B and prediction of HBsAg loss. J Infect Dis 2011;204:415-418.