Early Sodium and Fluid Intake and Severe Intraventricular Hemorrhage in Extremely Low Birth Weight Infants
Hypernatremic dehydration is an important cause of intracranial hemorrhage. A possible association of intraventricular hemorrhage (IVH) with hypernatremia and/or high sodium intake has been suggested in preterm infants. To investigate the associations of early fluid and sodium intake or serum sodium concentrations with severe intraventricular
hemorrhage (IVH) in extremely low birth weight (ELBW) infants, we reviewed the medical records of 169 inborn ELBW infants. Daily fluid and sodium intake, urine output, weight loss and serum sodium concentration during the first 4 days of life were obtained. Patients were divided into the severe IVH (grade 3/4) and the control (no or grade 1/2 IVH) group.
The maximum serum sodium concentration and the incidence of hypernatremia did not differ between the two groups. Related to the fluid balance and sodium intake, the risk for severe IVH was strongly associated with total fluid and sodium intake during the initial four days of life. With respect to the fluids other than transfusion, severe IVH can be
discriminated only by sodium intake but not by fluid intake. Large randomized controlled trials are required to clarify the causal relationship between the early sodium intake and severe IVH in ELBW infants.
Keywords: Sodium; Intraventricular Hemorrhage; Hypernatremia; Fluid Therapy; Infant, Extremely Low Birth Weight; Infant, Premature
Hye Jin Lee,1 Byong Sop Lee,1 Hyun-Jeong Do,1 Seong-Hee Oh,1 Yong-Sung Choi,2 Sung-Hoon Chung,2 Ellen Ai-Rhan Kim,1 and Ki-Soo Kim1
1Department of Pediatrics, University of Ulsan College of Medicine, Asan Medical Center, Seoul;
2Department of Pediatrics, Kyung Hee University School of Medicine, Seoul, Korea
Received: 3 July 2014 Accepted: 24 October 2014 Address for Correspondence:
Byong Sop Lee, MD
Department of Pediatrics, University of Ulsan College of Medicine, Asan Medical Center, 88 Olympic-ro 43-gil, Songpa-gu, Seoul 138-736, Korea
Tel: +82.2-3010-3929, Fax: +82.2-3010-6978 E-mail: mdleebs@amc.seoul.kr
http://dx.doi.org/10.3346/jkms.2015.30.3.283 • J Korean Med Sci 2015; 30: 283-289
INTRODUCTION
Intraventricular hemorrhage (IVH) is the most important cause of mortality and long-term developmental impairment in pre- term infants (1). The frequency of definite neurologic sequelae is directly related to the severity of IVH (2). Compared with grade 1/2 IVH, the major neurosensory impairment is almost dou- bled in severe-grade (grade 3/4) IVH, according to the Papile classification (3). The incidence of severe grade IVH was esti- mated to be approximately 6 to 16% in the large network cohort of preterm infants with birth weight < 1,500 g. Unfortunately, the incidence of severe IVH in extremely preterm infants largely remains unchanged over a decade (4, 5). Every effort has been made to avoid or to minimize the perinatal risk factors for IVH.
Studies have proposed the numerous perinatal risk factors of IVH, including low birth weight and gestational age (GA), gen- der, intrauterine infection, absence of antenatal steroids, mode of delivery, hypoxemia, hypercapnea, pneumothorax, pulmo- nary hemorrhage, respiratory distress syndrome (RDS), meta- bolic acidosis, and bicarbonate infusion (6-8). The pathogene- sis of IVH is multifactorial and largely includes the fragility of germinal matrix vasculature, fluctuation in the cerebral blood flow, and disturbances of platelet and coagulation (9).
The association between hypernatremic dehydration and in-
tracranial hemorrhage has been well-described in pediatric pa- tients, including newborn infants (10, 11). However, it is uncer- tain whether the early change of fluid or serum sodium level can affect the occurrence of severe IVH in preterm infants. Al- though a few studies have suggested a possible association of IVH with hypernatremia and/or high sodium intake in preterm infants, the cause and effect relationship still remains unclear (12-14). The purpose of our study is to investigate the associa- tion of severe IVH with serum sodium concentration or sodium intake during the early days of extremely low birth weight (EL- BW) infants.
MATERIALS AND METHODS
The inclusion criteria of our study were preterm infants with a birth weight < 1,000 g who were born and admitted to the neo- natal intensive care unit (NICU) at Asan Medical Center from January, 2008 to December, 2012. The exclusion criteria were 1) infants with congenital cardiac/renal anomalies, 2) death prior to the first four days of life or 3) patients whose IVH was identi- fied within the first 24 hr of life by cranial ultrasound performed outside of the routine protocol (see below).
The policy for routine cranial ultrasound in our unit in ELBW infants was to perform it between 24 hr and the first four days Pediatrics
of life and thereafter during the first 7 to 10 days of life and by a pediatric neurologist. It was not indicated within 24 hr after birth for initial patient stabilization, although it was sometimes per- formed at the discretion of attending neonatologists. The grad- ing of IVH was determined according to the Papile classifica- tion system (3). For the data analysis, the most severe grade of IVH was chosen within 10 days of life. We categorized the pa- tients into the groups of severe IVH (grade 3/4) and the control (no, grade 1/2 IVH) group.
We recorded the perinatal characteristics including the an- thropometric parameters, antenatal steroid, mode of delivery, Apgar scores, RDS, pneumothorax, incidence of hypercapnea (PaCO2≥ 60 mmHg) and hypocapnea (PaCO2≤ 30 mmHg), early onset of sepsis (positive blood culture < 7 days of life), symptomatic patent ductus arteriosus (PDA) and IVH. Symp- tomatic PDA was defined by echocardiographic identification of hemodynamically significant left to right ductal shunt with a transductal diameter > 1.5 mm and clinical evidence of respi- ratory or cardiovascular deterioration. Neonatal outcomes in- cluded mortality and neonatal morbidities such as PDA liga- tion, BPD (defined by the oxygen or respiratory support at 36 weeks of corrected age) and retinopathy of prematurity requir- ing laser therapy.
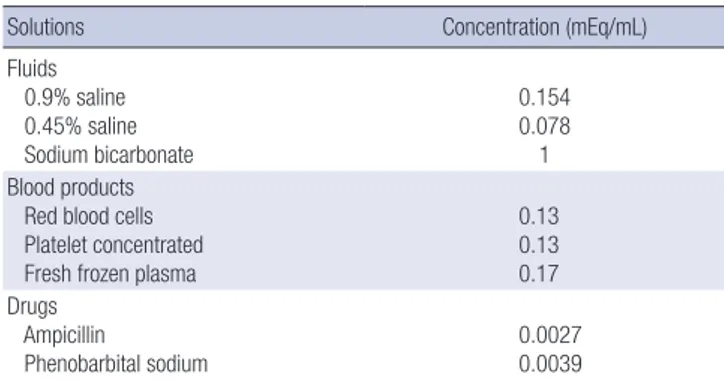
Data regarding the daily fluid intake and urine output were obtained from our electrical medical records system for each of the first four days of life. Except for the serum electrolyte data on the day of birth (d0), blood gas analyses and serum electro- lytes were available in all patients at least once each day during the first four days of life. The maximum and minimum blood PCO2 and serum sodium concentration were also recorded. The daily sodium intake was calculated by adding the sodium amo- unt in parenteral and enteral nutrition, blood products, intrave- nous fluid, every drug containing sodium salts (Table 1). Spe- cific notations regarding intravenous, sodium-bicarbonate in- fusions and blood transfusions were also made.
The protocol of fluid therapy and humidification did not chan ge during the study period: for all infants with birth weight < 1,000 g, humidification was initiated with 95% humidity from birth to the fourth day of life and was thereafter reduced by 5%-10% each
day until humidity of 50% was reached. On the first day of life, the fluid volume was restricted to 70-80 mL/kg/day with 5 or 10% dextrose solution and amino acid solution of 2.0 to 2.5 g/
kg/day and was adjusted to maintain a serum sodium concen- tration within 135-145 mEq/L by monitoring the patient’s daily weight, serum sodium, and urine output. Volume intake was generally increased by 10-20 mL/kg/day, reaching 130-140 mL/
kg day at 10-14 postnatal days. The contents of electrolytes were modified in the form of an individualized parenteral nutrition solution.
Statistics
A comparison between the severe IVH and the control group was carried out using the Student’s t-test or the Mann-Whitney test for determining the continuous variables, and the chi-square test or Fisher’s exact test was used for the categorical variables.
Among the variables which were significant in univariate logis- tic regression (cesarean section, RDS, GA, birth weight, Apgar score at one and five minutes, the initial base deficit > 5.0 mM/
L, any transfusion, and hypercapnea), GA and transfusion were selected by multivariate analysis using the backward elimina- tion method. To determine the associations between severe IVH and the sodium intake and serum sodium concentration, each logistic analysis was performed after adjustment for GA and transfusion. The receiver operating characteristic (ROC) curve analyses were used to determine the cut-off values for the sodium intake and fluid intake. All data analysis was performed using the SPSS version 19.0 (SPSS, INC., Chicago, IL, USA).
Ethics statement
This study was approved by the institutional review board of Asan Medical Center (IRB NO. 2014-0722). Informed consent
Table 1. Sodium concentrations of fluids, blood products, and medications
Solutions Concentration (mEq/mL)
Fluids 0.9% saline 0.45% saline Sodium bicarbonate
0.154 0.078 1 Blood products
Red blood cells Platelet concentrated Fresh frozen plasma
0.13 0.13 0.17 Drugs
Ampicillin
Phenobarbital sodium 0.0027
0.0039
Table 2. Baseline characteristics and outcomes between the severe IVH group and the control group
Characteristics Severe IVH (n = 32) Control (n = 137) P value Gestational age (week) 25.4 ± 1.7 27.9 ± 2.5 < 0.001 Birth weight (g) 713.7 ± 158.7 785.4 ± 150.4 0.02 Cesarean section (%) 13 (40.6) 103 (75.2) < 0.001
Male gender (%) 13 (40.6) 75 (54.7) 0.15
Apgar score at 1 min 2.8 ± 1.7 4.1 ± 1.7 < 0.001 Apgar score at 5 min 5.0 ± 1.6 6.4 ± 1.5 < 0.001 Initial base deficit (mM/L) 9.5 ± 5.0 6.0 ± 5.1 < 0.001
Antenatal steroid (%) 30 (93.8) 115 (83.9) 0.258
RDS (%) 30 (93.8) 95 (69.3) 0.005
Pneumothorax (%) 2 (6.3) 1 (0.7) 0.092
PCO2≥ 60 mmHg (%) 23 (71.9) 62 (45.3) 0.007
PCO2≤ 30 mmHg (%) 15 (46.9) 52 (37.9) 0.353
Early onset sepsis (%) 0 (0) 7 (5.1) 0.349
Symptomatic PDA (%) 26 (81.3) 85 (62.0) 0.039
BPD (%) 12 (57.1) 47 (35.9) 0.063
Mortality (%) 13 (40.6) 7 (5.1) < 0.001
IVH, intraventricular hemorrhage; RDS, respiratory distress syndrome; PDA, patent ductus arteriosus; BPD, bronchopulmonary dysplasia.
was waived by the board.
RESULTS
During the study period, a total of 210 ELBW infants was born in the Asan Medical Center NICU. After exclusion of patients with congenital cardiac/renal anomalies (n = 9), death prior to four days of life (n = 12), and IVH identified within 24 hr after birth (n = 20), 169 infants were included in the data analysis. The mean GA and birth weight were 27.0 ± 2.6 weeks and 771.8 ± 154.1 g. The percentages of any grade IVH and severe IVH were 52.7% (n = 89) and 18.9% (n = 32), respectively. Compared with the control group, the severe IVH group had a lower gestational
age, birth weight, rate of cesarean section and Apgar score at one and five minutes. The base deficit on the initial blood gas analysis and the incidence of RDS, hypercapnea, and sympto- matic PDA were also higher in the severe IVH group than in the control group (Table 2).
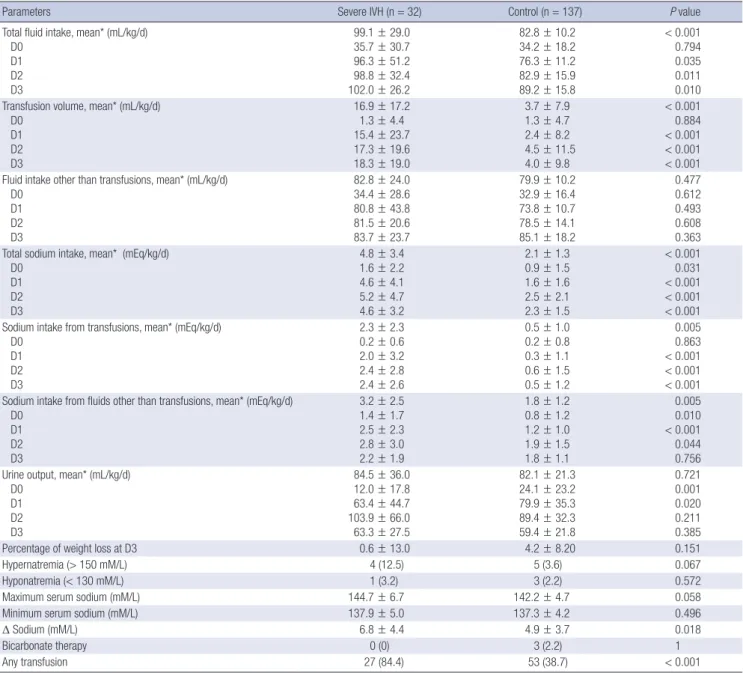
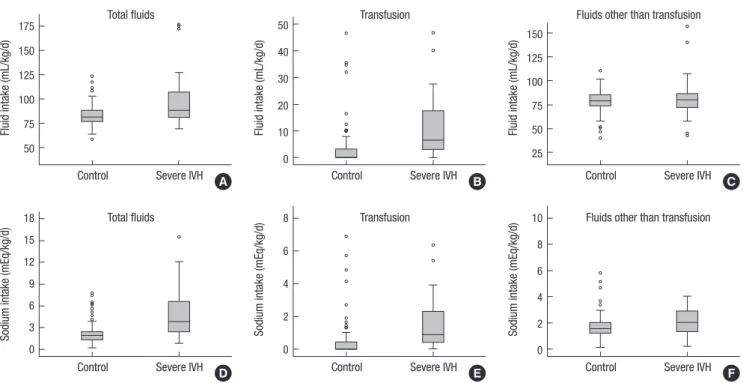
Except for the day of birth (D0), the daily fluid intake was sig- nificantly higher in the severe IVH group than in the control group (Table 3). This was mainly attributable to higher transfu- sion volume in the severe IVH group versus the control group (Fig. 1). The daily sodium intake was also greater in the severe IVH group than the control group (4.8 ± 3.4 vs. 2.1 ± 1.3, P < 0.001).
However, besides greater sodium intake from transfusion in the severe IVH group, sodium intake through other fluids also con-
Table 3. Fluid balance, sodium intake, and the serum sodium concentrations during the early three days between the severe IVH group and the control group
Parameters Severe IVH (n = 32) Control (n = 137) P value
Total fluid intake, mean* (mL/kg/d) D0
D1 D2 D3
99.1 ± 29.0 35.7 ± 30.7 96.3 ± 51.2 98.8 ± 32.4 102.0 ± 26.2
82.8 ± 10.2 34.2 ± 18.2 76.3 ± 11.2 82.9 ± 15.9 89.2 ± 15.8
< 0.001 0.794 0.035 0.011 0.010 Transfusion volume, mean* (mL/kg/d)
D0 D1 D2 D3
16.9 ± 17.2 1.3 ± 4.4 15.4 ± 23.7 17.3 ± 19.6 18.3 ± 19.0
3.7 ± 7.9 1.3 ± 4.7 2.4 ± 8.2 4.5 ± 11.5 4.0 ± 9.8
< 0.001 0.884
< 0.001
< 0.001
< 0.001 Fluid intake other than transfusions, mean* (mL/kg/d)
D0 D1 D2 D3
82.8 ± 24.0 34.4 ± 28.6 80.8 ± 43.8 81.5 ± 20.6 83.7 ± 23.7
79.9 ± 10.2 32.9 ± 16.4 73.8 ± 10.7 78.5 ± 14.1 85.1 ± 18.2
0.477 0.612 0.493 0.608 0.363 Total sodium intake, mean* (mEq/kg/d)
D0 D1 D2 D3
4.8 ± 3.4 1.6 ± 2.2 4.6 ± 4.1 5.2 ± 4.7 4.6 ± 3.2
2.1 ± 1.3 0.9 ± 1.5 1.6 ± 1.6 2.5 ± 2.1 2.3 ± 1.5
< 0.001 0.031
< 0.001
< 0.001
< 0.001 Sodium intake from transfusions, mean* (mEq/kg/d)
D0 D1 D2 D3
2.3 ± 2.3 0.2 ± 0.6 2.0 ± 3.2 2.4 ± 2.8 2.4 ± 2.6
0.5 ± 1.0 0.2 ± 0.8
0.3 ± 1.1 0.6 ± 1.5 0.5 ± 1.2
0.005 0.863
< 0.001
< 0.001
< 0.001 Sodium intake from fluids other than transfusions, mean* (mEq/kg/d)
D0 D1 D2 D3
3.2 ± 2.5 1.4 ± 1.7 2.5 ± 2.3 2.8 ± 3.0 2.2 ± 1.9
1.8 ± 1.2 0.8 ± 1.2 1.2 ± 1.0 1.9 ± 1.5 1.8 ± 1.1
0.005 0.010
< 0.001 0.044 0.756 Urine output, mean* (mL/kg/d)
D0 D1 D2 D3
84.5 ± 36.0 12.0 ± 17.8 63.4 ± 44.7 103.9 ± 66.0 63.3 ± 27.5
82.1 ± 21.3 24.1 ± 23.2 79.9 ± 35.3 89.4 ± 32.3 59.4 ± 21.8
0.721 0.001 0.020 0.211 0.385
Percentage of weight loss at D3 0.6 ± 13.0 4.2 ± 8.20 0.151
Hypernatremia (> 150 mM/L) 4 (12.5) 5 (3.6) 0.067
Hyponatremia (< 130 mM/L) 1 (3.2) 3 (2.2) 0.572
Maximum serum sodium (mM/L) 144.7 ± 6.7 142.2 ± 4.7 0.058
Minimum serum sodium (mM/L) 137.9 ± 5.0 137.3 ± 4.2 0.496
Δ Sodium (mM/L) 6.8 ± 4.4 4.9 ± 3.7 0.018
Bicarbonate therapy 0 (0) 3 (2.2) 1
Any transfusion 27 (84.4) 53 (38.7) < 0.001
*The data of D0 were not included in the calculation of mean data because they only represent partial amount for the day according to each patient’s time of birth.
tributed to the significantly higher sodium intake in the severe IVH group (2.3 ± 2.3 vs. 0.5 ± 1.0, P < 0.001). The average urine output and percent of weight loss did not differ between the groups. There was also no difference in the incidence of hyper- natremia. The maximum and minimum sodium concentration
and the degree of sodium fluctuation did not differ between the two groups (Table 3).
The ROC curves regarding the association of severe IVH with sodium and fluid intake from total fluids, transfusion and fluids other than transfusion were plotted (Fig. 2). Related to the fluid Fig. 1. Comparison of fluid and sodium intake between the study groups. The box plots represent the fluid volume (A, B, C) and sodium intake (D, E, F) from total fluids, trans- fusion and the fluids other than transfusion, respectively. The bottom and top of the box represent the first and third quartiles and the band inside the box is the median value.
Fluid intake (mL/kg/d)
Control Severe IVH 175
150 125 100 75 50
Total fluids
A
Fluid intake (mL/kg/d)
Control Severe IVH 50
40 30 20 10 0
Transfusion
B
Fluid intake (mL/kg/d)
Control Severe IVH 150
125 100 75 50 25
Fluids other than transfusion
C
Sodium intake (mEq/kg/d)
Control Severe IVH 18
15 12 9 6 3 0
Total fluids
D
Sodium intake (mEq/kg/d)
Control Severe IVH 8
6
4
2
0
Transfusion
E
Sodium intake (mEq/kg/d)
Control Severe IVH 10
8 6 4 2 0
Fluids other than transfusion
F
Sensitivity
1-Specificity
0.0 0.2 0.4 0.6 0.8 1.0 1.0
0.8 0.6 0.4 0.2 0
Total fluids
Sodium intake (AUC 0.793) Fluid intake (AUC 0.690)
Sensitivity
1-Specificity
0.0 0.2 0.4 0.6 0.8 1.0 1.0
0.8 0.6 0.4 0.2 0
Transfusion
Sodium intake (AUC 0.799) Fluid intake (AUC 0.777)
Sensitivity
1-Specificity
0.0 0.2 0.4 0.6 0.8 1.0 1.0
0.8 0.6 0.4 0.2 0
Fluids other than transfusion
Sodium intake (AUC 0.674) Fluid intake (AUC 0.496)
A B C
AUC (95% CI) P value Cut-off value Sensitivity (%) Specificity (%)
Total fluid intake 0.690 (0.572-0.807) 0.001 100.6 (mL/kg/d) 40.6 94.9
Transfusion volume 0.777 (0.682-0.873) < 0.001 3.4 (mL/kg/d) 71.9 77.4
Fluid intake other than transfusions 0.496 (0.370-0.621) 0.942 98.1 (mL/kg/d) 18.8 96.4
Total sodium intake 0.793 (0.694-0.892) < 0.001 2.8 (mEq/kg/d) 68.8 83.9
Sodium intake from transfusion 0.799 (0.708-0.890) < 0.001 0.4 (mEq/kg/d) 78.1 72.3
Sodium intake other than transfusions 0.674 (0.556-0.792) 0.002 2.5 (mEq/kg/d) 46.9 91.2
AUC, area under curve; CI, confidence interval.
Fig. 2. Receiver operating characteristic (ROC) curves of severe intraventricular hemorrhage in the association of fluid intake (dot line) and sodium intake (solid line) in total flu- ids (A), transfusion (B) and the fluids other than transfusion (C). The area of under the curve (AUC) value of each plot is presented in the separate table under the figure.
balance and sodium intake, the risk for severe IVH was strongly associated with total fluid and sodium intake during the initial four days of life. With respect to the fluids other than transfu- sion, severe IVH can be discriminated only by sodium intake and the mean cut-off value of the sodium intake was 2.8 mEq/
kg/day as the point maximizing the sum of the sensitivity and specificity.
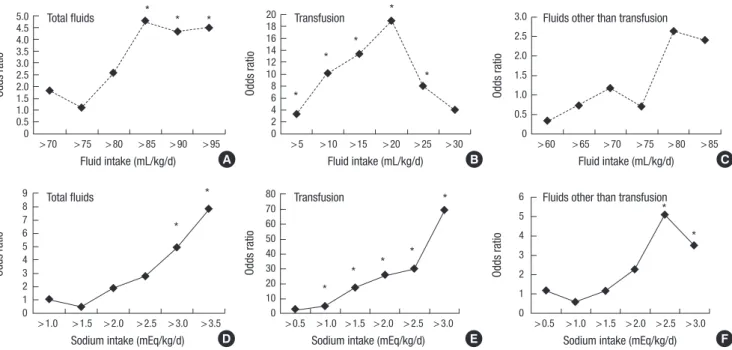
The odds ratio of severe IVH was plotted with the mean daily fluid and sodium intake after adjustment for GA and transfusion (Fig. 3). The intake was stratified by the interval of arbitrary cut- off value of 5 mL/kg/day (for fluid intake) and 0.5 mEq/kg/day (for sodium intake), respectively. During the first four days of life, there was an increase in the risk of severe IVH with total so- dium intake > 3.0 mEq/kg/day or sodium intake from fluids other than transfusions > 2.5 mEq/kg/day. However, no clear relationship was demonstrated between the risk of severe IVH and fluid intake other than transfusion.
DISCUSSION
In our study, the amount of sodium and fluid intake within the first four days of life, and particularly, sodium intake from fluids other than transfusions were significantly associated with se- vere IVH in ELBW infants. Few comparative studies have been conducted which were focused on the association between so- dium intake and IVH in preterm infants. In a small prospective study in 17 very low birth weight (VLBW) infants, the incidence of IVH did not differ between the sodium-restricted group and the sodium-maintenance group, with a mean daily intake of 0.85 mEq/kg/d and 4.33 mEq/kg/d, respectively, although the
Fig. 3. The gestational age and transfusion-adjusted odds ratio of severe intraventricular hemorrhage plotted with the mean fluid (A, B, C) and sodium intake (D, E, F) from total fluids, transfusion and the fluids other than transfusion on day 1 to 3 after birth, respectively. *Odds ratio with P value < 0.05.
Odds ratio
> 70 > 75 > 80 > 85 > 90 > 95 Fluid intake (mL/kg/d) 5.04.5
4.0 3.5 3.02.5 2.0 1.51.0 0.5 0
Total fluids *
* *
A
Odds ratio
> 1.0 > 1.5 > 2.0 > 2.5 > 3.0 > 3.5 Sodium intake (mEq/kg/d) 9
8 7 6 5 4 3 2 1 0
Total fluids
*
*
D
Odds ratio
> 5 > 10 > 15 > 20 > 25 > 30 Fluid intake (mL/kg/d) 20
18 1614 12 10 8 6 4 2 0
Transfusion *
*
*
*
*
B
Odds ratio
> 0.5 > 1.0 > 1.5 > 2.0 > 2.5 > 3.0 Sodium intake (mEq/kg/d) 80
70 60 50 40 30 20 10 0
Transfusion *
*
* *
*
E
Odds ratio
> 60 > 65 > 70 > 75 > 80 > 85 Fluid intake (mL/kg/d) 3.0
2.5 2.0 1.5 1.0 0.5 0
Fluids other than transfusion
C
Odds ratio
> 0.5 > 1.0 > 1.5 > 2.0 > 2.5 > 3.0 Sodium intake (mEq/kg/d) 6
5 4 3 2 1 0
Fluids other than transfusion
F
*
*
dose of “inadvertent” sodium intake was not specified (15). A recent observational study by Barnette et al. (12) demonstrated a clear dose-response relationship between the early sodium intake and IVH of ≥ grade 2 or more in the VLBW infants after controlling GA, the most important determinant of developing IVH. Using a similar study design to that study, we again dem- onstrated the increased odds ratio of severe IVH associated with an average sodium intake > 2.5 mEq/kg/day from fluids other than transfusions after controlling for both GA and blood trans- fusions. The threshold of mean sodium intake in our patient cohort of ELBW infants was seems to be lower than the value in Barnette’s study (> 4.5 mEq/kg) (12). However, we have not de- termined if the ELBW infants are more vulnerable to IVH at the same level of sodium intake than VLBW infants.
Besides the sodium intake through transfusions, the reason why the patients in the severe IVH group received more sodium than the control group remains unclear. The higher sodium in- take particularly during the first 4 days of life in the severe IVH group simply might reflect the higher basal requirement of sa- line-based fluids for maintaining catheter patency for patient monitoring in the severe IVH group as they are at greater risk of hemodynamic instability than the control group. Another ex- planation is more crystalloid infusion to treat low blood pres- sure or low urine output in the severe IVH group than in the control group. However, the mean fluid intake other than trans- fusions did not differ between the groups. This is in accordance with a recent Cochrane analysis (16), where there was no differ- ence in the incidence of all grade IVH between the volume re- striction groups and the liberal fluid intake groups. The possi- bility of caregiver’s preference to administer more amount of
sodium through the parenteral nutrition to strictly control the serum sodium concentration in the severe IVH group that de- monstrated more fluctuations in the serum sodium levels can- not be completely excluded. However, this cannot be verified in this retrospective study.
We were unable to identify a significant correlation between the serum sodium concentration and the severe IVH in our study.
The causality of early hypernatremia in the development of IVH in preterm infants has been conflicting in the published stud- ies. Although a few studies published during the pre-surfactant era raised concerns regarding the risk of liberal and excessive sodium bicarbonate administration in the development of IVH (17, 18), the pathogenesis of IVH using this strategy may be at- tributed to altered cerebral blood flow caused by hypercarbia and/or rapid volume expansion rather than by hyperosmolarity per se (19-21). Lupton et al. (22) revealed that a high serum so- dium concentration during the initial four days of life, when de- fined by serum sodium > 145 mM/L or > 152 mM/L, was not associated with an increased risk of IVH in VLBW infants. A few case reports regarding extremely preterm infants who showed normal development after exposure to extreme hypernatremia, also support this finding (23, 24). Meanwhile, a case-control study by Lim et al. (14) demonstrated the difference in the high- est serum sodium level and the difference in the serum sodium between the IVH and the control groups in the GA and the birth- weight matched cohort. However, they did not address the inci- dence or risk of hypernatremia defined by a specific threshold of serum sodium. Another large study by Perrott et al. (25) also demonstrated the significant association of hypernatremia (> 155 mmol/L) with major neurodevelopmental disability in the pre- term infants with < 30 weeks of GA, although the association with IVH was not directly documented. As with the issue of so- dium intake, the causal relationship of the serum sodium level and severe IVH cannot be elucidated by retrospective studies, including ours.
Our study is clearly limited by its retrospective nature. Despite the control of many confounders, the causality of high sodium intake and IVH can only be determined by large, prospective, comparative trials. The timing of head ultrasound is another limitation for the data analyses, although we excluded those patients whose IVH was identified within 24 hr after birth. Ex- clusion of the patients who died early and were thus free of in- sufficient data for sodium and fluid might have affected our study outcome. The severity of IVH was only graded using the Papile classification. The type of intracranial hemorrhage fol- lowing hypernatremic dehydration differs from the type of IVH or periventricular hemorrhagic infarct in preterm infants in that it demonstrates diffuse linear cerebral lesions, particularly at the gray-white matter junction and in multiple intra- and extra- parenchymal hemorrhage which eventually leads to diffuse en- cephalomalacia (26-28).
In conclusion, along with the previous studies favoring early sodium restriction in the prevention of neonatal morbidities in preterm infants (12, 13, 15), the impact of the sodium restrictive strategy on the development of IVH in ELBW infants should be determined by a large, randomized controlled trials which al- lows a wide range of serum sodium concentrations.
DISCLOSURE
All of the authors have no potential conflicts of interest to dis- closure.
AUTHOR CONTRIBUTION
Conception and design of the study: Lee BS. Acquisition of Data:
Lee HJ, Do HJ, Oh SH, Choi YS, Chung SH. Statistical analysis:
Lee HJ, Lee BS. First draft of manuscript: Lee HJ, Lee BS. Revi- sion and critical review of the manuscript: Lee BS, Kim EA, Kim KS. Manuscript approval: all authors.
ORCID
Hye Jin Lee http://orcid.org/0000-0002-3785-4638 Byong Sop Lee http://orcid.org/0000-0002-1347-4200 Hyun-Jeong Do http://orcid.org/0000-0002-5174-5032 Seong-Hee Oh http://orcid.org/0000-0002-4499-6650 Yong-Sung Choi http://orcid.org/0000-0001-9181-7849 Sung-Hoon Chung http://orcid.org/0000-0002-0352-9722 Ellen Ai-Rhan Kim http://orcid.org/0000-0002-9859-3021 Ki-Soo Kim http://orcid.org/0000-0003-1547-5220
REFERENCES
1. Mercier CE, Dunn MS, Ferrelli KR, Howard DB, Soll RF; Vermont Ox- ford Network ELBW Infant Follow-Up Study Group. Neurodevelopmen- tal outcome of extremely low birth weight infants from the Vermont Ox- ford network: 1998-2003. Neonatology 2010; 97: 329-38.
2. Murphy BP, Inder TE, Rooks V, Taylor GA, Anderson NJ, Mogridge N, Horwood LJ, Volpe JJ. Posthaemorrhagic ventricular dilatation in the premature infant: natural history and predictors of outcome. Arch Dis Child Fetal Neonatal Ed 2002; 87: F37-41.
3. Papile LA, Burstein J, Burstein R, Koffler H. Incidence and evolution of subependymal and intraventricular hemorrhage: a study of infants with birth weights less than 1,500 gm. J Pediatr 1978; 92: 529-34.
4. Horbar JD, Carpenter JH, Badger GJ, Kenny MJ, Soll RF, Morrow KA, Buzas JS. Mortality and neonatal morbidity among infants 501 to 1500 grams from 2000 to 2009. Pediatrics 2012; 129: 1019-26.
5. Stoll BJ, Hansen NI, Bell EF, Shankaran S, Laptook AR, Walsh MC, Hale EC, Newman NS, Schibler K, Carlo WA, et al. Neonatal outcomes of ex- tremely preterm infants from the NICHD Neonatal Research Network.
Pediatrics 2010; 126: 443-56.
6. McCrea HJ, Ment LR. The diagnosis, management, and postnatal pre-
vention of intraventricular hemorrhage in the preterm neonate. Clin Perinatol 2008; 35: 777-92, vii.
7. Kaiser JR, Gauss CH, Pont MM, Williams DK. Hypercapnia during the first 3 days of life is associated with severe intraventricular hemorrhage in very low birth weight infants. J Perinatol 2006; 26: 279-85.
8. Wells JT, Ment LR. Prevention of intraventricular hemorrhage in pre- term infants. Early Hum Dev 1995; 42: 209-33.
9. Ballabh P. Pathogenesis and prevention of intraventricular hemorrhage.
Clin Perinatol 2014; 41: 47-67.
10. Gawlowski Z, Aladangady N, Coen PG. Hypernatraemia in preterm in- fants born at less than 27 weeks gestation. J Paediatr Child Health 2006;
42: 771-4.
11. Harkavy KL, Scanlon JW. Hypernatremia in the very low birthweight in- fant. Int J Pediatr Nephrol 1983; 4: 75-8.
12. Barnette AR, Myers BJ, Berg CS, Inder TE. Sodium intake and intraven- tricular hemorrhage in the preterm infant. Ann Neurol 2010; 67: 817-23.
13. Hartnoll G, Bétrémieux P, Modi N. Randomised controlled trial of post- natal sodium supplementation on body composition in 25 to 30 week gestational age infants. Arch Dis Child Fetal Neonatal Ed 2000; 82: F24-8.
14. Lim WH, Lien R, Chiang MC, Fu RH, Lin JJ, Chu SM, Hsu JF, Yang PH.
Hypernatremia and grade III/IV intraventricular hemorrhage among extremely low birth weight infants. J Perinatol 2011; 31: 193-8.
15. Costarino AT Jr, Gruskay JA, Corcoran L, Polin RA, Baumgart S. Sodium restriction versus daily maintenance replacement in very low birth weight premature neonates: a randomized, blind therapeutic trial. J Pediatr 1992; 120: 99-106.
16. Bell EF, Acarregui MJ. Restricted versus liberal water intake for prevent- ing morbidity and mortality in preterm infants. Cochrane Database Syst Rev 2008: Cd000503.
17. Simmons MA, Adcock EW 3rd, Bard H, Battaglia FC. Hypernatremia and intracranial hemorrhage in neonates. N Engl J Med 1974; 291: 6-10.
18. Wigglesworth JS, Keith IH, Girling DJ, Slade SA. Hyaline membrane dis- ease, alkali, and intraventricular haemorrhage. Arch Dis Child 1976; 51:
755-62.
19. Roberton NR, Howat P. Hypernatraemia as a cause of intracranial hae- morrhage. Arch Dis Child 1975; 50: 938-42.
20. Van de Bor M, Van Bel F, Lineman R, Ruys JH. Perinatal factors and peri- ventricular-intraventricular hemorrhage in preterm infants. Am J Dis Child 1986; 140: 1125-30.
21. Dykes FD, Lazzara A, Ahmann P, Blumenstein B, Schwartz J, Brann AW.
Intraventricular hemorrhage: a prospective evaluation of etiopathogen- esis. Pediatrics 1980; 66: 42-9.
22. Lupton BA, Roland EH, Whitfield MF, Hill A. Serum sodium concentra- tion and intraventricular hemorrhage in premature infants. Am J Dis Child 1990; 144: 1019-21.
23. Sabir H, Stannigel H, Mayatepek E, Hoehn T. Severe hypernatremia in an extremely low birth weight infant with subsequent normal neurologi- cal development. Neonatology 2010; 97: 90-2.
24. Filippi L, Cecchi A, Dani C, Bertini G, Pezzati M, Rubaltelli FF. Hyper- natraemia induced by sodium polystyrene sulphonate (Kayexalate) in two extremely low birth weight newborns. Paediatr Anaesth 2004; 14:
271-5.
25. Perrott S, Dodds L, Vincer M. A population-based study of prognostic factors related to major disability in very preterm survivors. J Perinatol 2003; 23: 111-6.
26. Musapasaoglu H, Agildere AM, Teksam M, Tarcan A, Gurakan B. Hy- pernatraemic dehydration in a neonate: brain MRI findings. Br J Radiol 2008; 81: e57-60.
27. Han BK, Lee M, Yoon HK. Cranial ultrasound and CT findings in infants with hypernatremic dehydration. Pediatr Radiol 1997; 27: 739-42.
28. Korkmaz A, Yiğit S, Firat M, Oran O. Cranial MRI in neonatal hyperna- traemic dehydration. Pediatr Radiol 2000; 30: 323-5.