Vitamin A Improves Hyperglycemia and Glucose-Intolerance
through Regulation of Intracellular Signaling Pathways and
Glycogen Synthesis in WNIN/GR-Ob Obese Rat Model.
Shanmugam M. Jeyakumar, Alex Sheril, and Ayyalasomayajula Vajreswari Lipid Biochemistry Division, National Institute of Nutrition, Hyderabad, Telangana 500007, India
pISSN 2287-1098ㆍeISSN 2287-8602
Received 3 February 2017; Accepted 2 August 2017; Published online 30 September 2017
Correspondence to Ayyalasomayajula Vajreswari, Tel: +91-40-2715-6116, E-mail: [email protected]
Copyright © 2017 by The Korean Society of Food Science and Nutrition. All rights Reserved.
This is an Open Access article distributed under the terms of the Creative Commons Attribution Non-Commercial License (http://creativecommons.org/licenses/by-nc/4.0) which permits unrestricted non-commercial use, distribution, and reproduction in any medium, provided the original work is properly cited.
ABSTRACT: Vitamin A and its metabolites modulate insulin resistance and regulate stearoyl-CoA desaturase 1 (SCD1), which are also known to affect insulin resistance. Here, we tested, whether vitamin A-mediated changes in insulin resist-ance markers are associated with SCD1 regulation or not. For this purpose, 30-week old male lean and glucose-intolerant obese rats of WNIN/GR-Ob strain were given either a stock or vitamin A-enriched diet, i.e. 2.6 mg or 129 mg vitamin A/ kg diet, for 14 weeks. Compared to the stock diet, vitamin A-enriched diet feeding improved hyperglycemia and glucose- clearance rate in obese rats and no such changes were seen in lean rats receiving identical diets. These changes were cor-roborated with concomitant increase in circulatory insulin and glycogen levels of liver and muscle (whose insulin signaling pathway genes were up-regulated) in obese rats. Further, the observed increase in muscle glycogen content in these obese rats could be explained by increased levels of the active form of glycogen synthase, the key regulator of glycogen synthe-sis pathway, possibly inactivated through increased phosphorylation of its upstream inhibitor, glycogen synthase kinase. However, the unaltered hepatic SCD1 protein expression (despite decreased mRNA level) and increased muscle-SCD1 expression (both at gene and protein levels) suggest that vitamin A-mediated changes on glucose metabolism are not as-sociated with SCD1 regulation. Chronic consumption of vitamin A-enriched diet improved hyperglycemia and glucose-in-tolerance, possibly, through the regulation of intracellular signaling and glycogen synthesis pathways of muscle and liver, but not associated with SCD1.
Keywords: retinoids, adipose tissue, insulin, glucose homeostasis, gene expression
INTRODUCTION
Stearoyl-CoA desaturase (SCD1), a microsomal mem-brane-associated enzyme, introduces double bonds at the delta-9 position of saturated fatty acids (SFAs), palmitic acid (C16:0) and stearic acid (C18:0), and thereby con-verting them into monounsaturated fatty acids (MUFAs), palmitoleic acid (C16:1) and oleic acid (C18:1), respec-tively (1). SCD1 is one of the key lipogenic enzymes that controls triglyceride (TG) biosynthesis, through its sub-strate availability, i.e. MUFA (2,3). Studies from SCD1 knock-out mice models have demonstrated that the ab-sence of SCD1 protects mice from obesity and increases insulin sensitivity due to improved insulin signaling (4, 5). In vivo SCD1 inhibition by pharmacological agents im-proved insulin sensitivity in an insulin-resistant rat mod-el, while, SCD1 deficiency, under leptin-resistant condi-tions failed to show improved insulin sensitivity though
ameliorated obesity (6,7). In addition, a study on morbid obese human subjects has shown an association between SCD1 expression and insulin resistance markers (8).
Recent understanding of vitamin A metabolism has shed light on the various metabolic conditions including obesity, metabolic syndrome, and insulin resistance, wherein vitamin A and its metabolites play a key role in the control and/or development of diseases and associ-ated complications, in addition to their wide range of bi-ological functions (9). Further, vitamin A and its metab-olites are known to regulate SCD1 at the transcriptional level and suppress its activity (10,11). Previously, we have reported in an euglycemic obese rat model (WNIN /Ob) that the feeding of a vitamin A-enriched diet im-paired the development of obesity through other mecha-nisms, independent of SCD1 (12). Further, when young obese rats are challenged with an identical diet, it has not only ameliorated obesity, but also improved insulin
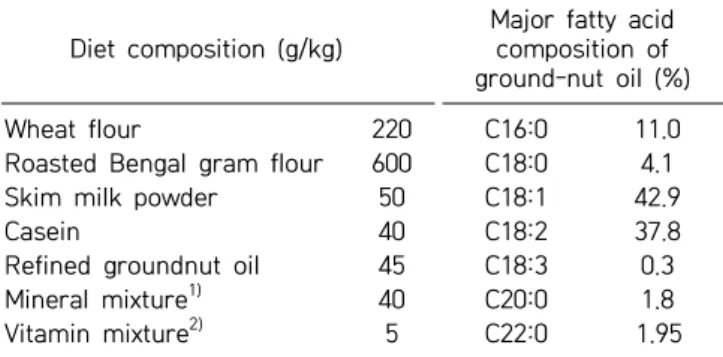
Table 1. Diet and ground-nut oil fatty acid composition Diet composition (g/kg)
Major fatty acid composition of ground-nut oil (%)
Wheat flour 220 C16:0 11.0
Roasted Bengal gram flour 600 C18:0 4.1
Skim milk powder 50 C18:1 42.9
Casein 40 C18:2 37.8
Refined groundnut oil 45 C18:3 0.3
Mineral mixture1) 40 C20:0 1.8
Vitamin mixture2) 5 C22:0 1.95
Vitamin A of 2.6 mg and vitamin D of 10 μg in the form of vani-tin were added per kg diet. Additionally, for vitamin A-enriched diet, 126.4 mg of vitamin A was added per kg diet as retinyl palmitate.
1)Composition of mineral mixture (g/kg): dicalcium phosphate
312.5 g, CaCO3 138.7 g, NaCl 75 g, MgSO4・7H2O 57.3 g, FeSO4・
7H2O 12.5 g; MnSO4・H2O 4.01 g, KI 0.25g, ZnSO4・7H2O 0.55 g,
CuSO4・5H2O 0.48 g, and CoCl2・6H2O 0.003 g. 2)
Composition of vitamin mixture (g/kg): (dl)-α-tocopherol ace-tate 24.0 g, menadione 0.3 g, thiamine 2.4 g, riboflavin 1.0 g, pyridoxine 1.2 g, niacin 2.0 g, pantothenic acid 2.4 g, cyanoco-balamine 1.0 μg, folic acid 0.2 g para-amino benzoic acid 20 g, biotin 0.08 g, inositol 20 g, and choline chloride 200 g.
sensitivity through muscle protein tyrosine phosphatase 1B (PTP-1B) regulation accompanied by decreased SCD1 protein expression (13).
With this background, here we tested the hypothesis that chronic consumption of vitamin A-enriched diet (129 mg vitamin A/kg diet) ameliorates hyperglycemia and glucose-intolerance, which are associated with SCD1 re-gulation of muscle and liver, by employing a glucose-in-tolerant obese rat model of WNIN/GR-Ob strain. Al-though candidate gene(s) of obesity in this strain of rats are yet to be identified, obese rats display impaired glu-cose tolerance along with other features of metabolic syn-drome, such as increased body weight, adiposity, dyslipi-demia, hyperinsulinemia, hyperleptinemia, and high plas-ma high-density lipoprotein-cholesterol levels, as com-pared with their age-and sex- matched lean counterparts (14).
MATERIALS AND METHODS
Chemicals and materials used
All the chemicals used were of analytical grade. TG and glucose assay kits (BioSystems, Barcelona, Spain) were procured. Radioimmunoassay-based insulin assay kit from Board of Radiation and Isotope Technology, Mum-bai, India and PTP-1B assay kit (Biovision Inc., Milpitas, CA, USA) were purchased. Primary antibodies such as glycogen synthase kinase-3β (GSK-3β), pGSK-3β (Ser9), glycogen synthase (GS), pGS (Ser641), and insulin re-ceptor-β (IRβ) were procured from Cell Signaling Tech-nology, Inc. (Danvers, MA, USA). pIRβ (Tyr1162/1163), Glucose transporter type 4 (GLUT4), PTP-1B, AMP-acti-vated protein kinase-α (AMPKα), pAMPKα (Thr172), fatty acid binding protein (FABP), and phosphoenolpyr-uvate caroboxykinase (PEPCK), were purchased from Santa Cruz Biotechnology, Inc. (Dallas, TX, USA). β-Ac-tin monoclonal antibody, secondary antibodies, and pro-tease inhibitor cocktail were purchased from Sigma- Aldrich Co. (St. Louis, MO, USA). Phosphotase inhibitor cocktail, PhosSTop, was obtained from Roche diagnostics GmbH, Mannheim, Germany. WNIN/GR-Ob strain rats were obtained from the National Centre for Laboratory Animal Sciences, National Institute of Nutrition, Hyder-abad, India.
Animals and experimental design
Adult (30-week old), male lean and obese rats of WNIN/ GR-Ob strain were broadly divided into two groups, A and B, each consisting of 12 lean and 12 obese rats (with impaired glucose tolerance traits), respectively and fur-ther divided into two subgroups (A-I, A-II, B-I, and B-II) consisting of 6 rats each. Subgroups A-I and B-I received the stock diet having 2.6 mg of vitamin A/kg diet, while
subgroups A-II and B-II received the vitamin A-enriched diet (129 mg of vitamin A/kg diet as retinyl palmitate) for a period of 14 weeks. The composition of diets was identical in all ingredients, except for the vitamin A con-tent. Diet and fatty acid compositions are given in Table 1. Animals were housed individually at ambient temper-ature, 22.0±10oC, relative humidity of 50∼60%, 12-h/ 12-h light-dark cycle, and cared for in accordance with the principles of the guide to the care and use of experi-mental animals. The study was approved by the Institu-tional Animal Ethics Committee of the NaInstitu-tional Insti-tute of Nutrition, Hyderabad, India (Registered number: 154/1999/CPCSEA & Study number: IAEC/Proj/05). Food and water were provided ad libitum. At the end of the experimental period, blood was drawn from the ret-ro-orbital sinus in ethylenediaminetetraacetic acid (EDTA)-coated tubes, after a 12-h fast and the rats were killed by cervical dislocation. Various tissues were ex-cised, immersed in ice-cold saline, weighed, and rapidly frozen in liquid nitrogen and stored at −80oC, until anal-ysis.
Oral glucose tolerance test and biochemical analyses At the end of 12th week, oral glucose tolerance test (OGTT) was performed by administering 3 g glucose per kg body weight to overnight-fasted rats. Blood was drawn at different time intervals and analyzed for glucose and insulin.
Plasma TG, glucose, and insulin levels were quanti-fied, using commercially available kits. PTP-1B activity was measured according to the manufacturer’s instruc-tions. Tissue glycogen content was determined by the
Table 2. Gene-specific primers used for qRT-PCR analysis
No. Gene Forward (5’→3’) Reverse (5’→3’)
1 ACL CTTTGGGCGTGAGGCATA CCACTTTTGGCATCCAGGT
2 β-Actin CCCGCGAGTACAACCTTCT CGTCATCCATGGCGAACT
3 ADH1 ATCCATTTCCTGCCCACA GCCGCTTTGCATTTGATTA
4 ADH4 ATGATATTGGGCCGTTCTGT ACCAGGTTTGGGACAGAGTC
5 ADH7 CAGACCACAAACCCAGGAAA GGACAGCTGCTTTGCACTTA
6 Adiponectin TGGTCACAATGGGATACCG CCCTTAGGACCAAGAACACCT
7 AKT-1 AACGACGTAGCCATTGTGAA CCATCATTCTTGAGGAGGAAGT
8 Aldh1a1 CAAGCTGGCTGACTTAATGGA CCACCATTGATGGCCTCT
9 Aldh1a2 TCTCATGGTGTCCTCTGCAA TCTGAGCATTTAAGGCGTTG
10 Aldh1a3 GAGCTGGGAGGCAGGAAC GGTGAGCACACTCCACAGC
11 ARPP GATGCCCAGGGAAGACAG CACAATGAAGCATTTTGGGTAG
12 CYP26A1 GAGAGAGGAGAGAGGCTGGATA GGCTGCACTGGCTGTAGTTT
13 CYP26B1 ACGGCAAGGAGATGACCA GCATAGGCTGCGAAGATCA
14 FABP-L CTTCTCCGGCAAGTACCAAG TTCCCTTTCTGGATGAGGTC
15 GLUT4 TGCAGTGCCTGAGTCTTCTTT CCAGTCACTCGCTGCTGA
16 GSK-3β ATCAAGGCACATCCTTGGAC ACGGCTACACAGTGCGATT
17 GYS CGTGCGCAAACAGCTATG GAGCTTCCTCCCAAATTTCTC
19 INSIG1 ATGTATCGCGGTGTTTGTTG TCGATCAAACGTCCACCA
20 IRβ CAGAAAAACCTCTTCAGGCAAT TTCAAGGGATCTTCGCTTTC
22 RARα TTGGAATGGCTCAAACCAC AGGGCTGGGCACTATCTCTT
23 RARγ TCCAGCAGTTTCTACCAGGTC TCCAATGGGTCTCCAAGG
24 RBP4 GTGAGGCAGCGACAGGAG TTGAGGGTCTGCTTTGACAG
25 RXRα ACATGCAGATGGACAAGACG GGGTTTGAGAGCCCCTTAGA
26 RXRβ GTTCTTCCATGGGGTCTCCT GGAGCGACACTGTGGAGTTAAT
27 RXRγ GGGCATGAAGAGGGAAGC TGGCACATTCTGCCTCAC
28 SCD1 GAAGCGAGCAACCGACAG GGTGGTCGTGTAGGAACTGG
method of Passonneau and Lauderdale (15).
Fatty acid composition by gas-liquid chromatography (GC) Gastrconemus muscle total lipids were extracted, used for TG estimation and fatty acid methyl esters prepara-tion, which were analyzed by GC coupled with a flame ionization detector as described earlier (16). The fatty acid desaturase activity index was calculated as the ratio of product to substrate i.e. C16:1/C16:0, C18:1/C18:0, C20:4/C18:2, and C20:4/C20:3 for delta9-16desaturase (D9-16D), delta9-18desaturase (D9-18D), delta6 desatu-rase (D6D), and delta5 desatudesatu-rase (D5D), respectively.
Protein expression by Western blot
Briefly, liver or muscle tissues were homogenized in Tris buffer containing 250 mM sucrose, 10 mM Tris (pH 7.4), 1 mM EDTA, and 1 mM dithiothreitol supplemented with protease and phosphatase inhibitor cocktail and subjected to differential centrifugation. From the various cellular fractions, Western blotting was performed, using protein targeted antibodies according to a standard pro-tocol (16). β-Actin was used as the loading control. Ima-ges were analyzed by the Image J 1.46r software
(Nation-al Institutes of He(Nation-alth, Rockville, MD, USA).
Gene expression by quantitative real time-polymerase chain reaction (qRT-PCR)
Total RNA from liver and gastrocnemus muscle was iso-lated, and reverse transcription reaction was performed as described earlier (16). qRT-PCR was performed as sug-gested by the manufacturer’s instructions, with a Light-Cycler480 Real Time-PCR system (Roche diagnostics GmbH), using pre-validated probes for rat (UPL probes, Roche diagnostics GmbH) and gene-specific primers (Ta-ble 2). Endogenous expression of acidic ribosomal phos-phoprotein was used to normalize the expression data and relative expression levels.
Statistical analysis
Data are expressed as means±standard error of the mean (SEM). Statistical significance was determined by one- way ANOVA, with post-hoc least significant difference test and Pearson’s correlation analysis was performed. P≤0.05 was considered significant. IBM SPSS statistics 19.0 software (IBM Company, Armonk, NY, USA) was used for the statistical analysis.
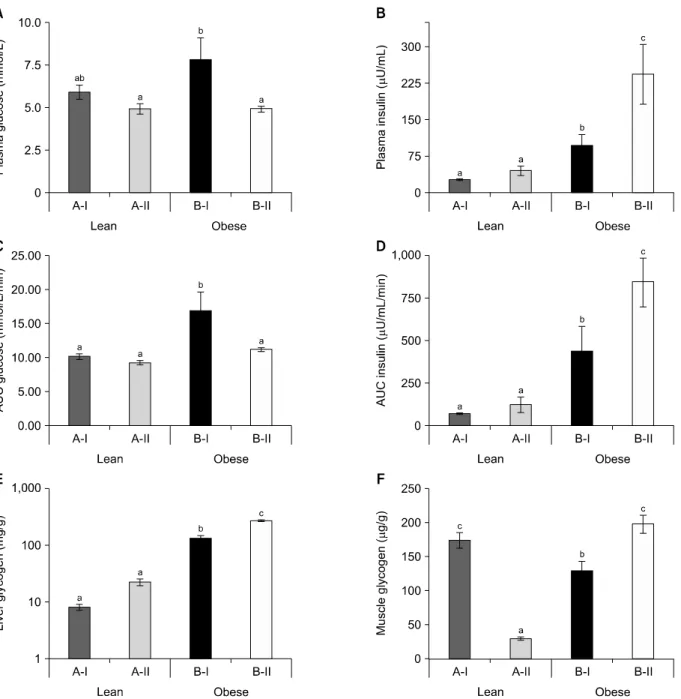
Fig. 1. Effect of vitamin A on insulin sensitivity-associated parameters. (A, B) Fasting plasma glucose and insulin levels, respectively. (C, D) Oral glucose tolerance test-area under the curve (OGTT-AUC) for glucose and insulin, respectively. (E, F) Glycogen levels of liver and muscle, respectively. Values are means±SEM of 6 rats, except for OGTT-AUC, 4 rats were from each group. Data were analyzed by one-way ANOVA-with post-hoc least significant difference test. Groups bearing different letters (a-c) are statisti-cally different at P≤0.05. A-I & B-I, stock diet-fed lean and obese rats, respectively; A-II & B-II, vitamin A-enriched diet-fed lean and obese rats, respectively.
RESULTS
Vitamin A improved hyperglycemia and glucose-intoler-ance
Obese rats of WNIN/GR-Ob strain showed hyperglyce-mia as compared with their age- and sex-matched lean counterparts. At the end of the experiment, obese rats fed on vitamin A-enriched diet showed significant reduc-tions in fasting plasma glucose, with a concomitant in-crease in fasting insulin levels as compared with their stock diet-fed control obese rats. On the other hand, no
such effects were seen in lean rats (Fig. 1A and 1B). From the OGTT, plasma glucose and insulin levels were meas-ured at various time points, and the calculated area un-der the curves clearly showed faster glucose clearance upon high vitamin A ingestion in obese rats, which was corroborated with increased insulin levels against obese rats fed on stock diet. However, no such changes were seen in lean counterparts maintained on identical dietary regimen (Fig. 1C and 1D). Further, vitamin A supple-mentation showed a negative correlation with plasma glucose levels at the P<0.01 (Pearson’s correlation).
Fig. 2. Effect of vitamin A on intracellular signaling pathway proteins and genes of muscle and liver. (A) Western blots of insulin signaling pathway proteins and ratio of phosphorylated to non-phosphorylated protein for glycogen synthase kinase-3β (GSK-3β) and glycogen synthase (GS). (B, C) Relative mRNA levels of insulin signaling pathway genes of muscle and liver, respectively. Values are means±SEM of 3∼4 rats from each group. Data were analyzed by one-way ANOVA-with post-hoc least significant difference test. Groups bearing different letters (a-c) are statistically different at P≤0.05. A-I & B-I, stock diet-fed lean and obese rats, respectively; A-II & B-II, vitamin A-enriched diet-fed lean and obese rats, respectively.
Vitamin A induced intracellular signaling and glycogen accumulation
The data revealed improvement in the hyperglycemic status of these obese rats. Therefore, we tested whether this resulted in the accumulation of glycogen content in liver and muscle. Obese rats fed on stock diet had higher glycogen content in the liver compared with their age- and sex-matched lean counterparts fed on identical diet.
Further, vitamin A-enriched diet feeding resulted in in-creased glycogen content of both phenotypes; however, this increase was only significant in obese rats (Fig. 1E). On the contrary, muscle glycogen content was signifi-cantly lower in the stock diet-fed obese rats compared to their lean counterparts. However, their levels improved upon vitamin A supplementation in obese rats. Surpris-ingly, the identical treatment resulted in decreased
gly-cogen content in lean rats compared with their stock di-et-fed lean rats (Fig. 1F). Notably, Pearson’s correlation analysis showed a positive association between plasma insulin levels and glycogen content of both, liver and muscle at P<0.003 and 0.025 levels, respectively.
To understand the vitamin A-induced improvement in hyperglycemia and glucose intolerance, phosphorylation status of intracellular insulin signaling pathways of mus-cle was studied. In the stock diet-fed obese rats, basal muscle insulin signaling pathway protein phosphoryla-tion (such as GSK-3β and GS) and GLUT4 (membrane to cytosol ratio; data not shown) levels were not signif-icantly different from their identically-treated, age- and sex-matched lean counterparts. However, vitamin A sup-plementation significantly increased the ratio of pGSK- 3β protein to non-phosphorylated GSK-3β protein, and thus, possibly increased the active form of GS (decreased phosphorylated-GS) (Fig. 2A), which was corroborated with concomitant glycogen accumulation in obese rats, without altering the ratio of membrane to cytosol GLUT4 (data not shown), and no such changes were seen in lean rats. Regardless of the treatment, other protein expres-sion pathways including PTP-1B, FABP, PEPCK, and the ratio of pAMPK to AMPK remained unchanged among all groups (data not shown).
Further, we tested whether higher intake of vitamin A affects the transcript levels of these proteins in muscle or not. The data suggest that the basal expression of muscle GSK-3β, GS, GLUT4, and insulin-induced gene 1 (INSIG1) genes were significantly lower in obese rats, while AKT mRNA levels remained unaltered compared with their age- and sex-matched lean rats receiving the stock diet. Feeding the vitamin A-enriched diet to obese rats resulted in significant increases in GSK-3β, GS, GLUT4, and INSIG1 transcript levels compared with their stock diet-fed obese counterparts. However, no such effect was observed in identically-treated lean rats (Fig. 2B).
Unlike muscle, the baseline data of liver showed no significant changes in the expression of various insulin signaling pathway genes, such as AKT, GSK-3β, GS, IRβ, and INSIG1 between lean and obese phenotypes. On the other hand, vitamin A supplementation significantly up- regulated their expression levels in both the phenotypes (except INSIG1, whose mRNA levels increased signifi-cantly in lean rats) compared to their stock diet-fed con-trols (Fig. 2C). Further, regardless of treatment, the activ-ity of PTP-1B (both in liver and muscle), one of the im-portant regulators of insulin receptor phosphorylation, was comparable between the groups, which supports the unaltered ratio of muscle phosphorylated insulin recep-tor to insulin receprecep-tor observed in muscles among vari-ous groups (data not shown).
Vitamin A on tissue TG levels and SCD1 regulation Feeding the vitamin A-enriched diet to obese rats signif-icantly increased TG accumulation in the liver (17) and muscle, while in the lean rats, hepatic TG levels alone were significantly increased as compared with their stock diet-fed respective controls (Fig. 3A and 3B). To under-stand the SCD1 regulation (both at mRNA and protein) by high vitamin A-diet feeding, its expression levels were determined in liver and muscle. In the stock diet-fed obese rats, SCD1 mRNA levels were significantly higher in the liver and muscle compared to their age- and sex- matched lean counterparts. Chronic vitamin A supple-mentation significantly reduced the expression levels of the SCD1 gene in the liver, while augmented its tran-script levels in the muscle of the obese phenotype; how-ever, its levels remained unaltered in lean rats compared to their respective stock diet-fed counterparts (Fig. 3C and 3D).
In line with this, protein expression of SCD1 was also significantly higher in both the liver and muscle of the stock diet-fed obese rats compared to that of lean count-erparts. Contrary to gene expression, vitamin A-enriched diet-fed obese rats displayed no change in hepatic SCD1 protein expression; however, muscle SCD1 protein lev-els showed a significant increase compared to their stock diet-fed obese counterparts. No changes in protein ex-pression were observed in the lean phenotype (Fig. 3E and 3F).
Fatty acid composition reflected SCD1 activity but de-creased polyunsaturated fatty acid (PUFA) levels in both liver and muscle
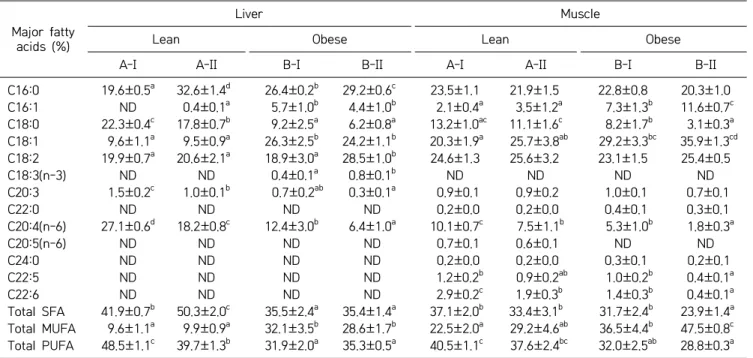
To identify whether the vitamin A-mediated regulation of SCD1 is reflected in fatty acid composition in these tissues or not, the fatty acid composition of total lipids was analyzed. Muscle fatty acid composition analysis showed a marked increase in MUFA [palmitoleic acid (C16:1) and oleic acid (C18:1)], and a significant reduc-tion in SFA [stearic acid (C18:0)] and long chain PUFA [arachidonic acid (C20:4) and docosahexaenoic acid (C22:6)] with no detectable eicosapentaenoic acid (C20:5) in the obese phenotype compared to their age and sex- matched stock diet-fed lean counterparts. A similar trend was reflected even in total MUFAs and PUFAs of muscle fatty acids. Vitamin A supplemented obese rats displayed increased MUFAs, palmitoleic acid (C16:1) and oleic ac-id (C18:1) although the latter was not statistically sig-nificant. Further, this treatment brought down the levels of stearic acid (C18:0) and other long chain PUFAs in obese rats, while in identically-treated lean counterparts, docosahexaenoic acid (C22:6) levels showed a significant reduction, compared to their respective stock diet-fed lean counterparts. Overall, the vitamin A-enriched diet resulted in significant reduction of total SFA, increased
Fig. 3. Effect of vitamin A on triglyceride and stearoyl-CoA desaturase 1 (SCD1) expression levels of liver and muscle. (A, B) Triglyceride levels of liver and muscle, respectively. (C, D) Relative mRNA levels of SCD1 in liver and muscle, respectively. (E, F) Western blot of SCD1 protein in liver and muscle, respectively, and their densitometry values (expressed as fold change relative to stock diet-fed lean rats). Values are means±SEM of 3∼4 rats from each group. Data were analyzed by one-way ANOVA-with post-hoc least significant difference test. Groups bearing different letters (a-c) are statistically different at P≤0.05. A-I & B-I, stock diet-fed lean and obese rats, respectively; A-II & B-II, vitamin A-enriched diet-fed lean and obese rats, respectively.
MUFA in obese phenotypes, and no significant change in total PUFA content. However, the fatty acid composi-tion of identically-treated lean rat muscle did not change (Table 3).
On the other hand, compared to lean rats, the liver fat-ty acid composition of obese rats showed higher SFA
[palmitic acid (C16:0)], MUFA [oleic acid (C18:1)], and low levels of stearic acid (C18:0) and long chain PUFA such as eicosatrienoic acid (C20:3) and arachidonic acid (C20:4). Overall, hepatic total SFA and PUFA levels were significantly lower, while MUFA levels were significantly higher in obese rats receiving the stock diet compared to
Table 3. Effect of vitamin A on the fatty acid composition of liver and muscle Major fatty
acids (%)
Liver Muscle
Lean Obese Lean Obese
A-I A-II B-I B-II A-I A-II B-I B-II
C16:0 19.6±0.5a 32.6±1.4d 26.4±0.2b 29.2±0.6c 23.5±1.1 21.9±1.5 22.8±0.8 20.3±1.0 C16:1 ND 0.4±0.1a 5.7±1.0b 4.4±1.0b 2.1±0.4a 3.5±1.2a 7.3±1.3b 11.6±0.7c C18:0 22.3±0.4c 17.8±0.7b 9.2±2.5a 6.2±0.8a 13.2±1.0ac 11.1±1.6c 8.2±1.7b 3.1±0.3a C18:1 9.6±1.1a 9.5±0.9a 26.3±2.5b 24.2±1.1b 20.3±1.9a 25.7±3.8ab 29.2±3.3bc 35.9±1.3cd C18:2 19.9±0.7a 20.6±2.1a 18.9±3.0a 28.5±1.0b 24.6±1.3 25.6±3.2 23.1±1.5 25.4±0.5 C18:3(n-3) ND ND 0.4±0.1a 0.8±0.1b ND ND ND ND C20:3 1.5±0.2c 1.0±0.1b 0.7±0.2ab 0.3±0.1a 0.9±0.1 0.9±0.2 1.0±0.1 0.7±0.1 C22:0 ND ND ND ND 0.2±0.0 0.2±0.0 0.4±0.1 0.3±0.1 C20:4(n-6) 27.1±0.6d 18.2±0.8c 12.4±3.0b 6.4±1.0a 10.1±0.7c 7.5±1.1b 5.3±1.0b 1.8±0.3a C20:5(n-6) ND ND ND ND 0.7±0.1 0.6±0.1 ND ND C24:0 ND ND ND ND 0.2±0.0 0.2±0.0 0.3±0.1 0.2±0.1 C22:5 ND ND ND ND 1.2±0.2b 0.9±0.2ab 1.0±0.2b 0.4±0.1a C22:6 ND ND ND ND 2.9±0.2c 1.9±0.3b 1.4±0.3b 0.4±0.1a Total SFA 41.9±0.7b 50.3±2.0c 35.5±2.4a 35.4±1.4a 37.1±2.0b 33.4±3.1b 31.7±2.4b 23.9±1.4a Total MUFA 9.6±1.1a 9.9±0.9a 32.1±3.5b 28.6±1.7b 22.5±2.0a 29.2±4.6ab 36.5±4.4b 47.5±0.8c Total PUFA 48.5±1.1c 39.7±1.3b 31.9±2.0a 35.3±0.5a 40.5±1.1c 37.6±2.4bc 32.0±2.5ab 28.8±0.3a
Values are means±SEM of 4 rats from each group.
Data were analyzed by one-way ANOVA-with post-hoc least significant different test.
Groups bearing different letters (a-d) are statistically different at P≤0.05 compared within the same tissue. ND: Non-detectable.
A-I & B-I, stock diet-fed lean and obese rats, respectively. A-II & B-II, vitamin A-enriched diet-fed lean and obese rats, respectively. C16:0, palmitic acid; C16:1, palmitoleic acid; C18:0, stearic acid; C18:1, oleic acid; C18:2, linoleic acid; C18:3, α-linolenic acid; C20:3, eicosatrienoic acid; C22:0, behenic acid; C20:4, arachidonic acid; C20:5, eicosapentaenoic acid; C24:0, tetracosanoic acid; C22:5, docosapentaenoic acid; C22:6, docosahexaenoic acid.
SFA, saturated fatty acid; MUFA, monounsaturated fatty acid; PUFA, polyunsaturated fatty acid.
their lean counterparts. Vitamin A-enriched diet feeding increased the levels of palmitic acid (C16:0), linoleic acid (C18:2), and α-linolenic acid (C18:3) in obese rats (and C16:0 alone in lean rats), but decreased stearic acid (C18:0) and long chain PUFA [eicosatrienoic acid (C20:3) and arachidonic acid (C20:4)] of both phenotypes com-pared with their respective stock diet-fed controls (Table 3).
Vitamin A on fatty acid desaturase activity indices
Increased hepatic D9-18D and decreased D6D were ob-served in obese rats compared to their stock diet lean counterparts. Further, the desaturase activity index of the latter was significantly reduced in both lean and obese rats by vitamin A-enriched diet consumption, while oth-er desaturase activities woth-ere not affected compared to their stock diet-fed respective controls (Fig. 4A).
Muscle fatty acid desaturase activity indices for D9- 16D and D9-18D were significantly higher, whereas D6D and D5D activity indices were significantly lower in obese rats receiving the stock diet compared to their age- and sex-matched lean counterparts. Vitamin A supplementa-tion increased the activity indices of D9-16D and D9- 18D, and decreased D6D and D5D indices significantly in the obese phenotype. On the other hand, in lean rats, the D5D activity-index showed a significant reduction
compared to stock diet obese and lean rats respectively (Fig. 4B).
Vitamin A meagerly regulated its metabolic pathway tran-scripts of liver and muscle
To understand the role of vitamin A metabolic pathway in improved hyperglycemia and glucose clearance, some of the transcript levels were analyzed in both liver and muscle. Hepatic vitamin A metabolic pathway gene ex-pression analysis revealed that basal exex-pression levels of alcohol dehydrogease (Adh) namely, Adh1, Adh4, and Adh7, and aldehyde dehydrogease (Aldh), such as Aldh1a2 and Aldh1a3 remained unaltered, while Aldh1a1 gene was up-regulated in obese rats compared to their age- and sex-matched lean counterparts. Although none of these gene expression levels were altered by vitamin A-enriched diet feeding, Aldh1a3, cytochrome p26 (CYP26)A1, and CYP26B1 mRNA expressions were up- regulated in both lean and obese rats compared to their respective control groups receiving the stock diet. Fur-ther, the isoforms of retinoic acid receptor (RAR) and ret-inoid X receptor (RXR) mRNA levels were comparable among all the groups, except, RXRα mRNA expression was down-regulated in lean rats receiving the vitamin A- enriched diet compared with their stock diet-fed lean counterparts (Fig. 4C).
Fig. 4. Effect of vitamin A on fatty acid desaturase activity indices and transcriptional regulation of vitamin A metabolic pathway genes of liver and muscle. (A, B) Various fatty acid desaturase activity indices of liver and muscle, respectively. (C, D) Relative mRNA levels of vitamin A metabolic pathway in liver and muscle respectively. Values are means±SEM of 3∼4 rats from each group. Data were analyzed by one-way ANOVA-with post-hoc least significant difference test. Groups bearing different letters (a-d) are statistically different at P≤0.05. A-I & B-I, stock diet-fed lean and obese rats, respectively; A-II & B-II, vitamin A-enriched diet-fed lean and obese rats, respectively. D9-16D, delta9-16desaturase; D9-18D, delta 9-18 desaturase; D6D, delta 6 desaturase; D5D, delta 5 desaturase.
In muscle, among the various isoforms, Adh1 and Aldh1a1 expression levels were detectable and no signif-icant changes were observed between phenotypes or treatments, except the basal expression of retinoic acid catabolizing enzyme CYP26A1, which was under-ex-pressed. On the other hand, CYP26B1 was over-expressed in the stock diet-fed obese rats compared to their age- and sex-matched lean counterparts. Higher basal expres-sion levels for RARα and lower expression levels of RXRγ were observed in the stock diet-fed obese rats compared with their lean counterparts. Vitamin A supplementation augmented RXRβ expression only in the obese pheno-type, without affecting other genes in both phenotypes (Fig. 4D).
DISCUSSION
SCD1 is the key lipogenic enzyme responsible for the bi-osynthesis of MUFA and thereby regulates TG and en-ergy homeostasis. Its role in insulin signaling and glucose homeostasis has been well demonstrated through SCD1 deficiency, using both in vivo and in vitro models (5-7,18). Contrary to many of these studies, the hepatic SCD1 pro-tein expression data did not corroborate with either cir-culatory or hepatic TG levels, which suggests that, only under steady state condition, the activity/level of SCD1 expression may correlate with fatty acid synthesis and/ or TG accumulation. In addition, other factors, including substrate availability, synthesis, secretion, clearance, and
turnover-rate influence TG levels/accumulation, inde-pendent of SCD1. Unaltered MUFA levels and fatty acid desaturase activity-indices, particularly D9-16D and D9- 18D of liver are suggestive of unaffected SCD1 protein status (and possibly its activity) due to increased vitamin A consumption. On the other hand, the fatty acid compo-sition showed high levels of MUFA (C16:1 and C18:1), the functional indicator of SCD1 activity, as a result of SCD1 over-expression in the stock diet-fed obese rats, which are in concurrence with our previous findings, with regard to the high MUFA content of obese rat liver.
Unlike liver, SCD1 expression (both protein and gene) of muscle was positively associated with elevated TG levels and corroborated with increased MUFA levels (C16:1) and D9D activity-indices of muscle. Further, the study of Schenk et al. (19) has shown amelioration of fatty acid-induced insulin resistance in obese human subjects through increased TG accumulation in skeletal muscle in response to acute exercise. However, still it is debatable whether increased TG levels are due to SCD1 over-expression or increased uptake of circulatory lipids or both. Previously, Samuel et al. (20) have demonstrated SCD1 induction by RA and the involvement of nuclear transcription factors retinoic acid receptor/retinoid X re-ceptor (RAR/RXR) and DNA response elements 1 (wherein RXR homodimer or RXR/ peroxisome prolifer-ator-activated receptor heterodimer may bind) through gel mobility shift assay, and thus speculated the presence of one or more retinoic acid response elements in the promoter of SCD1. Further, the study of Repa et al. (21) has demonstrated the transcriptional regulation of SCD1 through sterol regulatory element binding protein-1c (SREBP-1c), the master regulator of lipid metabolism. In the current study, vitamin A metabolic pathway tran-script levels did not go hand-in-hand with the observed SCD1 expression of liver and muscle. However, feeding of the vitamin A-enriched diet resulted in decreased hepat-ic SREBP1 mRNA levels in obese rats, while remained unaltered in lean rats compared to their respective con-trols, which is in agreement with the expression of he-patic SCD1. Thus, we postulate that vitamin A-mediated regulation of SCD1 may involve the SREBP1-dependant pathway, at least in the context of the present animal model, which partly explains the differential expression levels of the SCD1 gene in lean and obese phenotypes.
Vitamin A-supplemented diet feeding to glucose-intol-erant obese rats differentially regulated SCD1 (unaltered in liver and elevated in muscle) expression, normalized circulatory glucose levels, and improved glucose clearance rate with a concomitant increase in insulin levels. It is well known that insulin stimulates tissue glycogen syn-thesis and thereby regulates glucose homeostasis (22). The current data on increased tissue glycogen (both liver and muscle) contents and positive correlation between
plasma insulin and tissue glycogen go in favor of our hy-pothesis that vitamin A enhances glucose clearance and its storage as glycogen, thereby improving hyperglycemia, glucose tolerance and thus, suggesting improved insulin sensitivity. This derives support from the observed over- expression of adiponectin mRNA, while no change in ret-inol binding protein 4 in white adipose tissue (data not shown) was observed in vitamin A-challenged obese rats. These observations are also in line with earlier reports, which have shown a positive association between glyco-gen content and insulin sensitivity (23,24). Intracellular insulin signaling pathway of muscle revealed that the in-creased glycogen accumulation by vitamin A in obese rats was associated with decreased phosphorylation of glyco-gen synthase and thereby keeping it in its active form through regulation of glycogen synthase kinase, an up- stream inhibitor of glycogen synthase, without changing GLUT4 protein expression.
On the other hand, the glycogen synthesis pathway was not affected, but there was a drastic reduction in the muscle glycogen content of lean rats receiving high vita-min A diet. Liver glycogen primarily plays the key role in maintaining glucose levels during starvation, and muscle glycogen is utilized, when liver stores are exhausted (25, 26). Therefore, the muscle glycogen reduction may not be due to increased degradation to maintain glucose homeo-stasis, especially in the presence of adequate liver glyco-gen stores, which was comparable to that of the control group. Further, it is possible that increased muscle glu-cose oxidation (which accounts for nearly 90% of glyco-lytic flux) through the activation of pyruvate dehydroge-nase enzyme complex led to the higher demand for gly-cogen breakdown, particularly in the high vitamin A- challenged lean rats, resulting in decreased muscle gly-cogen content. Previously, vitamin A-induced activation of protein kinase Cð, resulting in the activation of pyru-vate dehydrogenase complex and increased oxidation has been demonstrated in vitro cell lines (27). Therefore, the involvement of such pathway may be considered, which partly explains the reduction of muscle glycogen at least in the high vitamin A-fed lean rats. However, further studies are needed to understand the glucose partition-ing mechanisms of muscle in both phenotypes to explain the observed differences in the utilization of primary en-ergy source i.e. glucose. In addition, the vitamin A-in-duced over-expression of insulin signaling pathway/ef-fector genes in both liver and muscle supports the fact that vitamin A regulates insulin signaling not only at phosphorylation, but also at the transcriptional level. Further, the role of other insulin signaling pathway pro-teins such as PTP-1B, insulin receptor, and AMPK-phos-phorylation status seem to be negligible in this glucose- intolerant obese rat model.
resistance appears to be complex with the advent of re-ports stating that hepatic TG accumulation in fact is a protective mechanism to counteract lipotoxic effects of excess non-esterified fatty acid (NEFA) and hence is not associated with or may not aggravate insulin resistance (28). Thus, it appears that vitamin A-induced TG accu-mulation of liver and muscle alleviates lipotoxicity and insulin resistance due to high levels of circulatory NEFA and/or TG, wherein decreased hepatic lipogenesis with no defective very-low-density lipoprotein secretion and/ or fatty acid oxidation is observed (17).
Importantly, long chain PUFA, particularly arachidonic (C20:4) acid levels of liver and muscle were significantly lower in the obese phenotype, which were further re-duced by high vitamin A consumption. In muscle, besides arachidonic acid, other long chain PUFA levels were de-creased in the high vitamin A-fed obese rats. Similar ef-fects were seen even in the identically-fed lean pheno-type. As the source of dietary fat for all groups was the same, we speculate that the conversion of linoleic acid (C18:2) to arachidonic acid (C20:4) is affected due to the inhibitory action of vitamin A on fatty acid desaturases, particularly D6D and D5D (as reflected by their activity indices), which is in line with previous findings on vita-min A and its metabolite retinoic acid-mediated regula-tion of D5D (29). Arachidonic acid (C20:4) deficiency in streptozotocin-induced diabetic rat model and low levels in muscle of obese zucker rats (fa/fa) have been previ-ously reported by Holman et al. (30) and Voss et al. (31). The current study could not relate the changes in long chain PUFA content, insulin signaling, and glycogen ac-cumulation and their molecular link. Unlike other effects that are very specific to the obese phenotype, decreased arachidonic acid (C20:4) in response to vitamin A sup-plementation was seen in both lean and obese rats. This observation warrants further investigations to address the regulation of arachidonic acid (C20:4) by the bio-synthe-tic pathway of vitamin A, its biological significance and relevance to clinical research, especially in various chron-ic diseases including cancer, wherein vitamin A and its metabolites are of great therapeutic potential. In conclu-sion, chronic feeding of vitamin A-enriched diet to glu-cose-intolerant obese rats improved hyperglycemia and glucose intolerance, possibly by enhancing glycogen accu-mulation through the regulation of intracellular signal-ing and metabolic pathways of muscle and liver, but not associated with SCD1.
ACKNOWLEDGEMENTS
Authors thank Heinz Nutrition Foundation India for the financial support and Dr. Giridharan N. V. for providing experimental animals for the study. Mrs Sheril Alex
thanks Council of Scientific and Industrial Research, New Delhi, India, for the research fellowship.
AUTHOR DISCLOSURE STATEMENT
The authors declare no conflict of interest.
REFERENCES
1. Sampath H, Ntambi JM. 2011. The role of stearoyl-CoA de-saturase in obesity, insulin resistance, and inflammation. Ann NY Acad Sci 1243: 47-53.
2. Jeffcoat R, Roberts PA, Ormesher J, James AT. 1979. Stearoyl- CoA desaturase: a control enzme in hepatic lipogenesis. Eur J Biochem 101: 439-445.
3. Attie AD, Krauss RM, Gray-Keller MP, Brownlie A, Miyazaki M, Kastelein JJ, Lusis AJ, Stalenhoef AF, Stoehr JP, Hayden MR, Ntambi JM. 2002. Relationship between stearoyl-CoA desaturase activity and plasma triglycerides in human and mouse hypertriglyceridemia. J Lipid Res 43: 1899-1907. 4. Ntambi JM, Miyazaki M, Stoehr JP, Lan H, Kendziorski CM,
Yandell BS, Song Y, Cohen P, Friedman JM, Attie AD. 2002. Loss of stearoyl-CoA desaturase-1 function protects mice against adiposity. Proc Natl Acad Sci USA 99: 11482-11486. 5. Rahman SM, Dobrzyn A, Dobrzyn P, Lee SH, Miyazaki M,
Ntambi JM. 2003. Stearoyl-CoA desaturase 1 deficiency ele-vates insulin-signaling components and down-regulates pro-tein-tyrosine phosphatase 1B in muscle. Proc Natl Acad Sci USA 100: 11110-11115.
6. Issandou M, Bouillot A, Brusq JM, Forest MC, Grillot D, Guillard R, Martin S, Michiels C, Sulpice T, Daugan A. 2009. Pharmacological inhibition of stearoyl-CoA desaturase 1 im-proves insulin sensitivity in insulin-resistant rat models. Eur J Pharmacol 618: 28-36.
7. Flowers JB, Rabaglia ME, Schueler KL, Flowers MT, Lan H, Keller MP, Ntambi JM, Attie AD. 2007. Loss of stearoyl-CoA desaturase-1 improves insulin sensitivity in lean mice but worsens diabetes in leptin-deficient obese mice. Diabetes 56: 1228-1239.
8. García-Serrano S, Moreno-Santos I, Garrido-Sánchez L, Gutierrez-Repiso C, García-Almeida JM, García-Arnés J, Rivas-Marín J, Gallego-Perales JL, García-Escobar E, Rojo- Martinez G, Tinahones F, Soriguer F, Macias-Gonzalez M, García-Fuentes E. 2011. Stearoyl-CoA desaturase-1 is associ-ated with insulin resistance in morbidly obese subjects. Mol Med 17: 273-280.
9. Jeyakumar SM, Vajreswari A. 2015. Vitamin A as a key regul-ator of obesity & its associated disorders: evidences from an obese rat model. Indian J Med Res 141: 275-284.
10. Miller CW, Waters KM, Ntambi JM. 1997. Regulation of he-patic stearoyl-CoA desaturase gene 1 by vitamin A. Biochem Biophys Res Commun 231: 206-210.
11. Stone RL, Bernlohr DA. 1990. The molecular basis for inhibi-tion of adipose conversion of murine 3T3-L1 cells by retinoic acid. Differentiation 45: 119-127.
12. Jeyakumar SM, Vajreswari A, Giridharan NV. 2008. Vitamin A regulates obesity in WNIN/Ob obese rat; independent of stearoyl-CoA desaturase-1. Biochem Biophys Res Commun 370: 243-247.
13. Jeyakumar SM, Vijaya Kumar P, Giridharan NV, Vajreswari A. 2011. Vitamin A improves insulin sensitivity by increasing insulin receptor phosphorylation through protein tyrosine
phosphatase 1B regulation at early age in obese rats of WNIN/ Ob strain. Diabetes Obes Metab 13: 955-958.
14. Harishankar N, Vajreswari A, Giridharan NV. 2011. WNIN/ GR-Ob-an insulin-resistant obese rat model from inbred WNIN strain. Indian J Med Res 134: 320-329.
15. Passonneau JV, Lauderdale VR. 1974. A comparison of three methods of glycogen measurement in tissues. Anal Biochem 60: 405-412.
16. Raja Gopal Reddy M, Pavan Kumar C, Mahesh M, Sravan Kumar M, Mullapudi Venkata S, Putcha UK, Vajreswari A, Jeyakumar SM. 2016. Vitamin A deficiency suppresses high fructose-induced triglyceride synthesis and elevates resolvin D1. Biochim Biophys Acta 1861: 156-165.
17. Jeyakumar SM, Sheril A, Vajreswari A. 2015. Chronic vitamin A-enriched diet feeding induces body weight gain and adipo-sity in lean and glucose-intolerant obese rats of WNIN/GR- Ob strain. Exp Physiol 100: 1352-1361.
18. Crespillo A, Alonso M, Vida M, Pavón FJ, Serrano A, Rivera P, Romero-Zerbo Y, Fernández-Llebrez P, Martínez A, Pérez- Valero V, Bermúdez-Silva FJ, Suárez J, de Fonseca FR. 2011. Reduction of body weight, liver steatosis and expression of stearoyl-CoA desaturase 1 by the isoflavone daidzein in diet- induced obesity. Br J Pharmacol 164: 1899-1915.
19. Schenk S, Horowitz JF. 2007. Acute exercise increases trigly-ceride synthesis in skeletal muscle and prevents fatty acid-in-duced insulin resistance. J Clin Invest 117: 1690-1698. 20. Samuel W, Kutty RK, Nagineni S, Gordon JS, Prouty SM,
Chandraratna RA, Wiggert B. 2001. Regulation of stearoyl co-enzyme A desaturase expression in human retinal pigment ep-ithelial cells by retinoic acid. J Biol Chem 276: 28744-28750. 21. Repa JJ, Liang G, Ou J, Bashmakov Y, Lobaccaro JM,
Shimomura I, Shan B, Brown MS, Goldstein JL, Mangelsdorf DJ. 2000. Regulation of mouse sterol regulatory element- binding protein-1c gene (SREBP-1c) by oxysterol receptors, LXRα and LXRβ. Genes Dev 14: 2819-2830.
22. Rayasam GV, Tulasi VK, Sodhi R, Davis JA, Ray A. 2009. Gly-cogen synthase kinase 3: more than a namesake. Br J Pharmacol 156: 885-898.
23. Marková I, Zídek V, Musilová A, Simáková M, Mlejnek P, Kazdová L, Pravenec M. 2010. Long-term pioglitazone treat-ment augtreat-ments insulin sensitivity and PKC-ε and PKC-θ ac-tivation in skeletal muscles in sucrose fed rats. Physiol Res 59: 509-616.
24. Jung JY, Lim Y, Moon MS, Kim JY, Kwon O. 2011. Onion peel extracts ameliorate hyperglycemia and insulin resistance in high fat diet/streptozotocin-induced diabetic rats. Nutr Metab 8: 18.
25. Sakaida M, Watanabe J, Kanamura S, Tokunaga H, Ogawa R. 1987. Physiological role of skeletal muscle glycogen in starved mice. Anat Rec 218: 267-274.
26. Sugden MC, Orfali KA, Holness MJ. 1995. The pyruvate de-hydrogenase complex: nutrient control and the pathogenesis of insulin resistance. J Nutr 125: 1746S-1752S.
27. Acin-Perez R, Hoyos B, Zhao F, Vinogradov V, Fischman DA, Harris RA, Leitges M, Wongsiriroj N, Blaner WS, Manfredi G, Hammerling U. 2010. Control of oxidative phosphoryla-tion by vitamin A illuminates a fundamental role in mito-chondrial energy homoeostasis. FASEB J 24: 627-636. 28. Listenberger LL, Han X, Lewis SE, Cases S, Farese RV Jr, Ory
DS, Schaffer JE. 2003. Triglyceride accumulation protects against fatty acid-induced lipotoxicity. Proc Natl Acad Sci USA 100: 3077-3082.
29. Zolfaghari R, Cifelli CJ, Banta MD, Ross AC. 2001. Fatty acid Δ5-desaturase mRNA is regulated by dietary vitamin a and exogenous retinoic acid in liver of adult rats. Arch Biochem Biophys 391: 8-15.
30. Holman RT, Johnson SB, Gerrard JM, Mauer SM, Kupcho- Sandberg S, Brown DM. 1983. Arachidonic acid deficiency in streptozotocin-induced diabetes. Proc Natl Acad Sci USA 80: 2375-2379.
31. Voss MD, Beha A, Tennagels N, Tschank G, Herling AW, Quint M, Gerl M, Metz-Weidmann C, Haun G, Korn M. 2005. Gene expression profiling in skeletal muscle of Zucker diabetic fatty rats: implications for a role of stearoyl-CoA de-saturase 1 in insulin resistance. Diabetologia 48: 2622-2630.