Medial Temporal Atrophy Alone is
Insufficient to Predict Underlying
Alzheimer’s Disease Pathology
Hyo Eun Jeong, Da Hye Shin, Duk-Chul Lee*
Department of Family Medicine, Yonsei University College of Medicine, Seoul, Korea
Background:
The medial temporal region is the earliest affected structure in patients with Alzheimer’s disease
(AD), and its atrophy is known as the hallmark of AD. This study aimed to investigate the value of medial temporal
atrophy (MTA) for detecting 18F-florbetaben positron emission tomography (PET)-proven AD pathology.
Methods:
We retrospectively enrolled 265 subjects complaining of cognitive decline at a dementia outpatient clinic
from March 2015 to December 2017. All subjects underwent brain magnetic resonance imaging,
18F-fluorodeoxy-glucose PET, and 18F-florbetaben PET at baseline. We performed multivariable logistic regression analyses on
vari-ables including age, sex, years of education, white matter hyperintensities, apolipoprotein E (APOE) genotype, and
memory composite scores in various combinations to investigate whether MTA was indicative of underlying AD
pathology.
Results:
Our sample population of 265 patients comprised 121 with AD-related cognitive impairment, 42 with
Lewy bodies-related cognitive impairment, 32 with vascular cognitive impairment, and 70 with other or
undeter-mined pathologies. In the multivariable logistic regression analyses, MTA was not an independent predictor of
un-derlying AD pathology (P>0.200). The predictive power of unun-derlying AD-related cognitive impairment
significant-ly increased when multiple variables including APOE genotype and memory composite scores were considered
to-gether (area under the curve >0.750).
Conclusion:
Our results suggest that MTA alone may be insufficient to accurately predict the presence of AD
pa-thology. It is necessary to comprehensively consider various other factors such as APOE genotype and a detailed
memory function to determine whether the patient is at high risk of AD.
Keywords:
Alzheimer Disease; Brain Magnetic Resonance Imaging; Medial Temporal Atrophy; Prediction
Received: August 6, 2018, Revised: December 24, 2018, Accepted: December 24, 2018 *Corresponding Author: Duk-Chul Lee https://orcid.org/0000-0001-9166-1813
Tel: +82-2-2228-2331, Fax: +82-2-362-2473, E-mail: faith@yuhs.ac
Original Article
INTRODUCTION
With increasing age, the number of patients visiting primary health care facilities due to memory decline has been increasing. The spec-trum of complaints of memory decline ranges from subjective memo-ry impairment (SMI) to mild cognitive impairment (MCI) to dementia. The clinical significance of SMI and amnestic MCI has been growing, as these conditions may represent a transitional state between normal cognition and Alzheimer’s disease (AD).1,2) However, not all patients
progress to AD, and early detection of individuals who are at high risk of AD is important to predict prognosis and reduce social burdens. The hippocampus is the earliest affected and most vulnerable struc-ture in AD,3) and medial temporal atrophy (MTA) is known as the
hall-mark of AD. Brain magnetic resonance imaging (MRI) is, therefore, a useful screening tool to detect MTA with a predictive value for AD. However, hippocampal atrophy can also be observed in various neu-rodegenerative diseases, such as vascular dementia, dementia with Lewy bodies, and Parkinson’s disease.4,5) It is necessary to consider
whether or not MTA is in fact a specific marker of AD.
Indeed, several previous studies have reported inconsistent results regarding the value of MTA for detecting the prodromal stage of AD6,7)
and for differentiating AD from other dementias.8) However, these
studies are limited by the pathologically unproven AD diagnosis; to the best of our knowledge, in most of these studies, AD was diagnosed based on clinical criteria without any evidence of β-amyloid deposi-tion from pathological data or on positron emission tomography (PET) scans.8-10) Therefore, the aim of this study was to investigate the value
of MTA for detecting 18F-florbetaben (18F-FBB) PET-proven AD pa-thology. If MTA can reflect underlying AD pathology, a brain imaging study can be actively recommended as a screening tool for dementia in primary care.
METHODS
1. Subjects
We consecutively enrolled 265 patients complaining of cognitive de-cline at the dementia outpatient clinic, Severance Hospital (Yonsei University College of Medicine), from March 2015 to December 2017. All subjects underwent a detailed neuropsychological assessment (Seoul Neuropsychological Screening Battery [SNSB]) to assess their level of cognitive performance.11) To uncover the underlying disease
that caused the cognitive decline, all subjects underwent brain MRI, 18F-fludeoxyglucose (18F-FDG) PET, and 18F-FBB PET. Apolipopro-tein E (APOE) genotyping was performed in 260 patients (five patients declined to be genotyped). All subjects also underwent a neurologic examination, and 18F-fluorinated N-3-fluoropropyl-2-beta-carboxy-methoxy-3-beta-(4-iodophenyl) nortropane (18F-FP-CIT) PET scans were performed in 132 subjects who showed parkinsonism. 18F-FDG PET, 18F-FBB PET, and 18F-FP-CIT PET revealed regional hyper-/hy-pometabolism, β-amyloid deposition, and nigrostriatal dopaminergic degeneration, respectively. All these diagnostic work-up procedures
were carried out within 6 months, and clinical diagnoses were per-formed based on the clinical features and neuroimaging findings. This study was approved by the Yonsei University Severance Hospital insti-tutional review board (IRB approval no., 4-2016-0210). The need for informed consent was waived because of the retrospective nature of the study.
2. Neuropsychological Assessment
The SNSB covers five cognitive domains: attention and working mem-ory (forward/backward digit span task and letter cancellation test); language and related functions (the Korean version of the Boston Naming Test, calculation, and praxis); visuospatial function (the Rey Complex Figure Test [RCFT] copy and interlocking pentagon); verbal and visual memory (immediate recall/delayed recall/recognition test using the Seoul Verbal Learning Test [SVLT] for verbal memory; im-mediate recall/delayed recall/recognition test using the RCFT for visu-al memory); and frontvisu-al/executive function (contrasting program, go/ no-go test, the Controlled Oral Word Association Test, and the Stroop test). In addition, the Korean version of the Mini-Mental State Exami-nation (K-MMSE) was used to assess general cognition. We used z-scores to assess the level of cognitive performance. A z-score was de-fined as where the score was positioned in the distribution of scores for age- and education-matched normal subjects. The memory com-posite scores were calculated by dividing the sum of the z-scores by the number of tests in the memory function domain.
3. Visual Rating of Medial Temporal Atrophy and White
Matter Hyperintensities
1) Brain MRI acquisition
MRI scans were acquired using a Philips 3.0 T scanner (Philips Achie-va; Philips Medical Systema, Best, The Netherlands) with a SENSE head coil (SENSE factor=2).
2) Visual rating of MTA
The Scheltens scale was used to rate MTA.12) According to this scale,
visual assessment of MTA is scored on a scale of 0 (no atrophy) to 4 (end-stage atrophy). The characteristics of each group were defined as the width of the choroid fissure, the width of the temporal horn, and the height of the hippocampal formation (Table 1). Then, we used four criteria to assess the extent of MTA in each subject. According to crite-rion 1, the MTA score was calculated by averaging the right and left
Table 1. Visual rating of medial temporal lobe atrophy
Score Width of choroid fissure Width of temporal horn Height of hippocampus
0 N N N
1 ↑ N N
2 ↑↑ ↑ ↓
3 ↑↑↑ ↑↑ ↓↓
4 ↑↑↑ ↑↑↑ ↓↓↓
MTA scores for each subject as a continuous variable. For all other cri-teria, the MTA findings were classified into normal or abnormal ac-cording to the following cut-off scores: criterion 2: a cut-off score of 1.5 was used (i.e., an average MTA score equal to or greater than 1.5 was regarded as abnormal);13) criterion 3: an age-dependent cut-off score
(i.e., 3 for subjects ≥75 years old, and 2 for subjects <75 years old, in ei-ther hemisphere) was used;14) and criterion 4, age was further
subdi-vided using cut-off scores of 1, 1.5, and 2.0 for subjects <65, 65–74, and >75 years old, respectively.15)
3) Visual rating of WMHs
The modified Fazekas scale was used to describe the extent of periven-tricular and deep white matter hyperintensities (WMHs).16)
Periven-tricular WMH was classified as P1 (cap and band <5 mm), P2 (5 mm ≤ cap or band <10 mm), or P3 (10 mm ≤ cap or band) and deep WMH was classified as D1 (maximum diameter of deep white matter lesion <10 mm), D2 (10 mm ≤ lesion <25 mm), or D3 (≥25 mm). We subdi-vided the subjects into three groups: the minimal ischemia group (D1P1 and D1P2), the moderate ischemia group (D1P3, D2P1, D2P2, and D2P3), and the severe ischemia group (D3P1, D3P2, and D3P3).17)
4. Visual Assessment of Amyloid Deposition
1) 18F-FBB PET data acquisition
18F-FBB PET scans were performed using Discovery 600 (General Electric Healthcare, Milwaukee, MI, USA). The images were acquired with a 256×256 matrix 90 minutes after administration of 300 MBq (8 mCi) FBB for 20 minutes. Then the images were reconstructed with an ordered-subsets expectation maximization algorithm in an iso-0.98-mm voxel size.
2) Visual assessment of 18F-FBB PET images
The regional cortical tracer uptake (RCTU) and brain β-amyloid plaque load (BAPL) scoring systems were used to visually assess the deposition of β-amyloid.18) The RCTU scoring system grades the tracer
uptake in the lateral temporal cortex, frontal cortex, posterior cingulate cortex/precuneus, and parietal cortex as follows: grade 1, no binding; grade 2, minor binding; grade 3, pronounced binding. Based on the RCTU scores, the BAPL scoring system classifies the results into β-amyloid-negative PET scans (BAPL score 1) and β-amyloid-positive PET scans (BAPL scores 2 and 3).
5. Clinical Diagnosis of Alzheimer’s Disease
AD was diagnosed based on both the clinical diagnostic criteria19) and
the imaging findings on 18F-FDG PET (hypometabolism in AD signa-ture region of interest)20) and 18F-FBB PET (BAPL scores 2 and 3).21-23)
6. Statistical Analyses
Multivariable logistic regression analyses were performed to investi-gate whether the MTA and K-MMSE z-scores, which can be easily ob-tained in primary health care clinics, were predictive of underlying AD pathology (model 1). In addition, we performed multivariable logistic regression analyses by entering additional variables including age, sex, years of education, WMH, APOE genotype, and memory composite scores in various combinations. Model 2 included age, sex, years of education, WMH, MMSE z-scores, and MTA as variables. Model 3 in-cluded age, sex, years of education, WMH, APOE genotype, memory composite scores, and MTA as variables. The discriminatory power of variables was investigated by receiver operating characteristic analy-ses. A Bootstrap method was used to compare the area under the curve (AUC) between the variables. The statistical analyses were
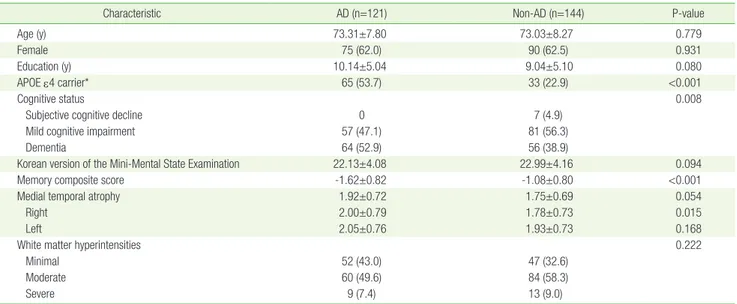
per-Table 2. Demographic characteristics of 265 patients in this study
Characteristic AD (n=121) Non-AD (n=144) P-value
Age (y) 73.31±7.80 73.03±8.27 0.779
Female 75 (62.0) 90 (62.5) 0.931
Education (y) 10.14±5.04 9.04±5.10 0.080
APOE ε4 carrier* 65 (53.7) 33 (22.9) <0.001
Cognitive status 0.008
Subjective cognitive decline 0 7 (4.9)
Mild cognitive impairment 57 (47.1) 81 (56.3)
Dementia 64 (52.9) 56 (38.9)
Korean version of the Mini-Mental State Examination 22.13±4.08 22.99±4.16 0.094
Memory composite score -1.62±0.82 -1.08±0.80 <0.001
Medial temporal atrophy 1.92±0.72 1.75±0.69 0.054
Right 2.00±0.79 1.78±0.73 0.015
Left 2.05±0.76 1.93±0.73 0.168
White matter hyperintensities 0.222
Minimal 52 (43.0) 47 (32.6)
Moderate 60 (49.6) 84 (58.3)
Severe 9 (7.4) 13 (9.0)
Values are presented as mean±standard deviation or number (%). AD, Alzheimer’s disease; APOE, apolipoprotein E.
formed with IBM SPSS software ver. 23.0 (IBM Corp., Armonk, NY, USA) and R software package ver. 3.4.0 (http://www.r-project.org), and a two-tailed P<0.05 was considered significant.
RESULTS
1. Demographic Characteristics
Of the 265 patients, 121 were diagnosed with AD-related cognitive im-pairment (98 with pure AD pathology and 23 with mixed pathology). The other 144 were diagnosed with Lewy bodies-related cognitive im-pairment (i.e., Parkinson’s disease or dementia with Lewy bodies; n=42), vascular cognitive impairment (n=32), other pathologies (i.e., epileptic cognitive impairment, tauopathy, normal pressure hydro-cephalus and others; n=23), and undetermined pathologies (n=47). There were no significant differences in age, sex, education, K-MMSE scores, and WMHs between the AD and non-AD pathology groups. The prevalence of the APOE ε4 allele and dementia were higher in pa-tients with AD pathology. In addition, the papa-tients with AD-related cognitive impairment had lower memory composite scores and tend-ed to show more severe MTA than those with non-AD pathology (Ta-ble 2).
2. Association between Medial Temporal Atrophy and
Alzheimer’s Disease Pathology
Multivariable logistic regression analyses were performed using the MTA and K-MMSE z-scores as variables (model 1). The results show that MTA was not an independent predictor for the presence of AD pathology in patients with cognitive complaints (MTA criterion 1, P=0.222; criterion 2, P=0.302; criterion 3, P=0.422; criterion 4, P=0.771) (Table 3). The analyses were not powerful enough to differentiate AD-related cognitive impairment from non-AD-AD-related cognitive impair-ment; the AUCs were 0.616 (95% confidence interval [CI], 0.549– 0.684), 0.617 (95% CI, 0.549–0.683), 0.618 (95% CI, 0.551–0.686), and 0.618 (95% CI, 0.551–0.686) for the MTA criteria 1, 2, 3, and 4, respec-tively (Table 4, Figure 1).
3. Receiver Operating Characteristic Analyses for
Differentiating Alzheimer’s Disease from Non-Alzheimer’s
Disease
Additionally, we performed multivariable logistic regression analyses by entering additional variables. Model 2 showed again that MTA was not an independent predictor for the presence of AD pathology in pa-tients with cognitive decline (MTA criterion 1, P=0.202; criterion 2, P=0.352; criterion 3, P=0.383; criterion 4, P=0.831) (Table 3). This sta-tistical model did not have enough discriminatory power to discrimi-nate between AD- and non-AD-related cognitive impairment either (AUC, 0.647; 95% CI, 0.580–0.713) for MTA criterion 1, (AUC, 0.644; 95% CI, 0.578–0.711) for MTA criterion 2, (AUC, 0.644; 95% CI, 0.578– 0.711) for MTA criterion 3, and (AUC, 0.645; 95% CI, 0.578–0.711) for MTA criterion 4 (Table 4, Figure 1).
Model 3 also showed that MTA did not significantly predict the pres- Table 3.
Multivariate analysis of factors associated with prediction of underlying
AD pathology Variable MT A criteria 1 MT A criteria 2 MT A criteria 3 MT A criteria 4 OR (95% CI) P-value OR (95% CI) P-value OR (95% CI) P-value OR (95% CI) P-value Model 1 M TA 1.253 (0.872–1.801) 0.222 1.408 (0.735–2.696) 0.302 1.252 (0.723–2.170) 0.422 1.089 (0.612–1.939) 0.771 K-MMSE z-score 0.850 (0.751–0.963) 0.011 0.844 (0.746–0.954) 0.007 0.847 (0.747–0.960) 0.009 0.838 (0.740–0.950) 0.006 Model 2 M TA 1.313 (0864–1.994) 0.202 1.399 (0.689–2.839) 0.352 1.284 (0.732–2.250) 0.383 1.067 (0.589–1.932) 0.831 K-MMSE z-score 0.862 (0.753–0.987) 0.032 0.848 (0.744–0.968) 0.014 0.850 (0.744–0.971) 0.017 0.839 (0.735–0.958) 0.009 Age 1.012 (0.976–1.050) 0.506 1.017 (0.982–1.053) 0.353 1.024 (0.990–1.058) 0.167 1.022 (0.989–1.057) 0.193 Sex 1.072 (0.618–1.858) 0.806 1.036 (0.600–1.789) 0.899 1.055 (0.610–1.827) 0.847 1.037 (0.597–1.800) 0.897 Education 1.031 (0.976–1.088) 0.273 1.029 (0.974–1.086) 0.308 1.028 (0.974–1.085) 0.315 1.028 (0.973–1.085) 0.324 WMH 0.658 (0.427–1.014) 0.058 0.672 (0.437–1.032) 0.069 0.678 (0.442–1.040) 0.075 0.678 (0.442–1.040) 0.075 Model 3 M TA 1.097 (0.702–1.714) 0.686 1.144 (0.529–2.472) 0.732 1.218 (0.665–2.231) 0.524 0.913 (0.482–1.732) 0.781 Age 1.029 (0.989–1.070) 0.156 1.030 (0.992–1.070) 0.127 1.034 (0.997–1.072) 0.073 1.033 (0.996–1.071) 0.080 Sex 1.011 (0.558–1.830) 0.972 1.000 (0.554–1.803) 0.999 1.017 (0.562–1.839) 0.956 0.982 (0.541–1.782) 0.952 Education 1.003 (0.945–1.064) 0.930 1.002 (0.944–1.063) 0.951 1.002 (0.945–1.063) 0.949 1.001 (0.944–1.062) 0.964 WMH 0.604 (0.381–0.958) 0.032 -0.608 (0.358–0.962) 0.0344 0.610 (0.386–0.964) 0.034 0.612 (0.387–0.967) 0.036 APOE ε4 allele 3.649 (2.078–6.411) <0.001 3.653 (2.080–6.416) <0.001 3.680 (2.092–6.474) <0.001 3.653 (2.081–6.416) <0.001 Memor y composite score 0.449 (0.303–0.664) <0.001 0.445 (0.303–0.653) <0.001 0.449 (0.307–0.657) <0.001 0.433 (0.295–0.636) <0.001 AD, Alzheimer’ s disease; MT A,
medial temporal atrophy; OR,
odds ratio; CI,
confidence inter
val; K-MMSE,
the Korean version of the Mini-Mental State Examination;
WMHs,
white matter hyperintensities;
APOE,
ence of AD pathology (MTA criterion 1, P=0.686; criterion 2, P=0.732; criterion 3, P=0.524; criterion 4, P=0.781) (Table 3). However, this model had a fair discriminatory power with AUCs of 0.751 (95% CI, 0.692–0.810), 0.752 (95% CI, 0.694–0.811), 0.751 (95% CI, 0.692–0.810), and 0.751 (95% CI, 0.692–0.809) for MTA criteria 1, 2, 3, and 4, respec-tively (Table 4, Figure 1). The AUCs for model 3 were significantly greater than those for the other models (e.g., for the MTA criterion 4: model 1 versus model 2, P=0.963; model 1 versus model 3, P=0.001; model 2 versus model 3, P=0.003) (Table 4).
DISCUSSION
The present study investigated whether MTA observed on brain MRI scans accurately reflects the underlying AD pathology confirmed by 18F-FDG PET and 18F-FBB PET scans. The major findings of the study were as follows: (1) in the multiple logistic regression analyses, MTA was not an independent predictor of underlying AD pathology; and (2) the predictive power of the statistical model significantly increased (model 3) when multiple variables including age, sex, years of educa-tion, WMH, APOE genotype, and memory composite scores were Table 4. Receiver operating curve analyses in differentiating AD from non-AD
Variable MTA criteria 1 MTA criteria 2 MTA criteria 3 MTA criteria 4
AUC (95% CI) P-value AUC (95% CI) P-value AUC (95% CI) P-value AUC (95% CI) P-value Model 1 0.616 (0.549–0.684) 0.034 0.616 (0.549–0.683) 0.034 0.618 (0.551–0.686) 0.035 0.618 (0.551–0.686) 0.034 Model 2 0.647 (0.580–0.713) <0.001 0.644 (0.578–0.711) <0.001 0.644 (0.578–0.711) <0.001 0.645 (0.578–0.711) <0.001 Model 3 0.751 (0.692–0.810) <0.001 0.752 (0.694–0.811) <0.001 0.751 (0.692–0.810) <0.001 0.751 (0.692–0.809) <0.001 1 vs. 2* 0.627 0.726 0.820 0.963 2 vs. 3* 0.003 0.003 0.002 0.003 1 vs. 3* 0.001 <0.001 <0.001 0.001
AD, Alzheimer’s disease; MTA, medial temporal atrophy; AUC, area under the curve; CI, confidence interval. *Bonferroni correction for multiple comparisons.
Model 1 Model 2 Model 3 0 0.2 0.4 0.6 0.8 1.0 Sensitivity 1-Specificity 1.0 0.8 0.6 0.4 0.2 0 Model 1 Model 2 Model 3 0 0.2 0.4 0.6 0.8 1.0 Sensitivity 1-Specificity 1.0 0.8 0.6 0.4 0.2 0
A
B
Model 1 Model 2 Model 3 0 0.2 0.4 0.6 0.8 1.0 Sensitivity 1-Specificity 1.0 0.8 0.6 0.4 0.2 0 Model 1 Model 2 Model 3 0 0.5 1.0 Sensitivity 1-Specificity 1.0 0.8 0.6 0.4 0.2 0C
D
Figure 1. Receiver operating characteristic curves to discriminate between AD-related cognitive impairment and non-AD-related cognitive impairment. (A) MTA criterion 1, (B) MTA criterion 2, (C) MTA criterion 3, and (D) MTA criterion 4. The area under the curve for model 3 is significantly greater than that for the other models. AD, Alzheimer’s disease; MTA, medial temporal atrophy.
considered together. However, the statistical model (model 2) includ-ing age, sex, years of education, WMH, and K-MMSE z-scores as vari-ables did not predict the underlying AD pathology effectively. These findings suggest that K-MMSE and brain imaging studies, which are mainly used for screening of dementia in primary health care facilities, have a weak predictive power on whether or not the patient’s memory decline is caused by AD-related cognitive impairment.
Dementia is a clinically observable outcome of the cumulative bur-den of multiple pathological insults in the brain and can result from various neurodegenerative disorders (e.g., AD, Parkinson’s disease, dementia with Lewy bodies, frontotemporal dementia, and others) as well as non-neurodegenerative conditions (e.g., vascular cognitive im-pairment and vitamin deficiency). It is important to uncover the un-derlying pathogenesis leading to cognitive decline because the prog-nosis and therapeutic approach depend on the specific condition. The most common pathological condition underlying dementia is AD,24)
and many patients who visit the outpatient clinic due to cognitive de-cline would thus like to know if their problems are caused by AD-relat-ed cognitive impairment. MTA is known as one of the typical features of AD,3) and brain MRI scans are, thus, commonly used to reveal the
underlying AD pathology. In fact, a number of studies on the possibili-ty of predicting AD by MRI have been conducted,6-10) but the results are
still controversial.
The present study demonstrates that the visual rating of MTA on brain MRI scans do not provide crucial information in predicting un-derlying AD pathology. This is probably due to the following reasons. (1) MTA is not a specific finding of AD. Previous studies have suggested that hippocampal atrophy is also commonly found in healthy elderly people,4) particularly in those of advanced age, as well as in patients
with frontotemporal dementia,25) dementia with Lewy bodies, and
Parkinson’s disease.5) (2) The structural abnormalities found on brain
MRI may be minimal to mild in the preclinical stage of AD or amnestic MCI. According to Alzheimer’s pathological cascade,26) β-amyloid
plaque deposition precedes clinical symptoms and reaches a plateau by the time clinical symptoms appear. Then, tau-mediated neuronal damage and dysfunction occur later, and correlate well with clinical symptom severity. Structural abnormalities assessed by brain MRI is the last biomarker, and the brain atrophy rate accelerates as patients approach dementia. In addition, according to Braak and Braak,27) the
AD-related neurofibrillary changes occur in six stages: transentorhinal stages (stages 1 and 2), limbic stages (stages 3 and 4), and neocortical stages (stages 5 and 6). In the transentorhinal stages, the neurodegen-erative changes in the brain remain below the threshold, which indi-cates clinical symptoms. The characteristic brain lesions, such as de-struction of limbic circuits, become evident in the limbic stage. In this regard, structural alterations observed on brain MRI alone may be a less sensitive tool for detecting underlying AD pathology in patients with either SMI or amnestic MCI.
Model 2, which included age, sex, years of education, and WMH as additional variables, did not have enough discriminatory power to predict the underlying AD pathology, while model 3, which
addition-ally included APOE genotype and memory composite scores, predict-ed the underlying AD pathology, regardless of the MTA criteria. The APOE ε4 allele is a well-established generic risk factor for late-onset AD through both β-amyloid-dependent and β-amyloid-independent pathways.28) The prominent memory dysfunction is the
pathogno-monic neuropsychological profile of AD-related cognitive impairment, given that early AD pathology frequently affects the neuroanatomical networks for episodic memory before other networks.29) Therefore, at
least a detailed memory function test (i.e., the SVLT and RCFT in the SNSB) should be considered in patients who complain of memory de-cline, to differentiate AD-related cognitive impairment from non-AD-related cognitive impairment.
Our study has some limitations. First, selection bias may have oc-curred when we enrolled the patients with non-AD-related cognitive impairment. We retrospectively recruited patients who underwent both 18F-FDG PET and 18F-FBB PET to exclude the possibility of un-derlying AD pathology. These subjects may be more likely to have MTA and thus undergo 18F-FBB PET, which might have led to the re-sults showing that MTA was not an independent predictor for the pres-ence of AD pathology. Second, this study was based on visual ratings of MTA and 18F-FBB uptake, which may be somewhat subjective. An objective measurement or quantification of medial temporal volume and β-amyloid deposition is needed to confirm our findings in the fu-ture. Third, although MRI is the preferred imaging modality in the di-agnostic work-up of cognitive decline, MRI is not available to a num-ber of patients in primary health care clinics. Instead, brain computed tomography can be used as an alternative for MRI, which has been re-ported to yield reliable information on MTA.30)
In conclusion, our results suggest that the visual rating of MTA alone is insufficient to accurately predict the presence of AD pathology. In order to determine whether the patient is at high risk of AD or not, it is necessary to comprehensively consider various other factors such as APOE genotype and the results of a detailed memory function test.
CONFLICT OF INTEREST
No potential conflict of interest relevant to this article was reported.
ORCID
Hyo Eun Jeong: https://orcid.org/0000-0001-6488-8318 Da Hye Shin: https://orcid.org/0000-0001-8013-8189 Duk-Chul Lee: https://orcid.org/0000-0001-9166-1813
REFERENCES
1. Abdulrab K, Heun R. Subjective memory impairment: a review of its definitions indicates the need for a comprehensive set of standardised and validated criteria. Eur Psychiatry 2008;23:321-30.
2. Petersen RC. Mild cognitive impairment as a diagnostic entity. J Intern Med 2004;256:183-94.
3. Devanand DP, Pradhaban G, Liu X, Khandji A, De Santi S, Segal S, et al. Hippocampal and entorhinal atrophy in mild cognitive impair-ment: prediction of Alzheimer disease. Neurology 2007;68:828-36. 4. Launer LJ, Scheltens P, Lindeboom J, Barkhof F, Weinstein HC, Jonker
C. Medial temporal lobe atrophy in an open population of very old persons: cognitive, brain atrophy, and sociomedical correlates. Neu-rology 1995;45:747-52.
5. Tam CW, Burton EJ, McKeith IG, Burn DJ, O’Brien JT. Temporal lobe atrophy on MRI in Parkinson disease with dementia: a comparison with Alzheimer disease and dementia with Lewy bodies. Neurology 2005;64:861-5.
6. Visser PJ, Verhey FR, Hofman PA, Scheltens P, Jolles J. Medial temporal lobe atrophy predicts Alzheimer’s disease in patients with minor cog-nitive impairment. J Neurol Neurosurg Psychiatry 2002;72:491-7. 7. Bouwman FH, Schoonenboom SN, van der Flier WM, van Elk EJ, Kok
A, Barkhof F, et al. CSF biomarkers and medial temporal lobe atrophy predict dementia in mild cognitive impairment. Neurobiol Aging 2007;28:1070-4.
8. Burton EJ, Barber R, Mukaetova-Ladinska EB, Robson J, Perry RH, Ja-ros E, et al. Medial temporal lobe atrophy on MRI differentiates Al-zheimer’s disease from dementia with Lewy bodies and vascular cog-nitive impairment: a prospective study with pathological verification of diagnosis. Brain 2009;132(Pt 1):195-203.
9. Prestia A, Caroli A, Herholz K, Reiman E, Chen K, Jagust WJ, et al. Di-agnostic accuracy of markers for prodromal Alzheimer’s disease in in-dependent clinical series. Alzheimers Dement 2013;9:677-86. 10. Harper L, Fumagalli GG, Barkhof F, Scheltens P, O’Brien JT, Bouwman
F, et al. MRI visual rating scales in the diagnosis of dementia: evalua-tion in 184 post-mortem confirmed cases. Brain 2016;139(Pt 4):1211-25.
11. Ahn HJ, Chin J, Park A, Lee BH, Suh MK, Seo SW, et al. Seoul Neuro-psychological Screening Battery-dementia version (SNSB-D): a useful tool for assessing and monitoring cognitive impairments in dementia patients. J Korean Med Sci 2010;25:1071-6.
12. Scheltens P, Leys D, Barkhof F, Huglo D, Weinstein HC, Vermersch P, et al. Atrophy of medial temporal lobes on MRI in “probable” Alzheim-er’s disease and normal ageing: diagnostic value and neuropsycholog-ical correlates. J Neurol Neurosurg Psychiatry 1992;55:967-72. 13. Schoonenboom NS, van der Flier WM, Blankenstein MA, Bouwman
FH, van Kamp GJ, Barkhof F, et al. CSF and MRI markers indepen-dently contribute to the diagnosis of Alzheimer’s disease. Neurobiol Aging 2008;29:669-75.
14. Pereira JB, Cavallin L, Spulber G, Aguilar C, Mecocci P, Vellas B, et al. Influence of age, disease onset and ApoE4 on visual medial temporal lobe atrophy cut-offs. J Intern Med 2014;275:317-30.
15. Claus JJ, Staekenborg SS, Holl DC, Roorda JJ, Schuur J, Koster P, et al. Practical use of visual medial temporal lobe atrophy cut-off scores in Alzheimer’s disease: validation in a large memory clinic population. Eur Radiol 2017;27:3147-55.
16. Fazekas F, Chawluk JB, Alavi A, Hurtig HI, Zimmerman RA. MR signal abnormalities at 1.5 T in Alzheimer’s dementia and normal aging. AJR Am J Roentgenol 1987;149:351-6.
17. Noh Y, Lee Y, Seo SW, Jeong JH, Choi SH, Back JH, et al. A new classifi-cation system for ischemia using a combination of deep and periven-tricular white matter hyperintensities. J Stroke Cerebrovasc Dis 2014; 23:636-42.
18. Sabri O, Seibyl J, Rowe C, Barthel H. Beta-amyloid imaging with flor-betaben. Clin Transl Imaging 2015;3:13-26.
19. McKhann G, Drachman D, Folstein M, Katzman R, Price D, Stadlan EM. Clinical diagnosis of Alzheimer’s disease: report of the NINCDS-ADRDA Work Group under the auspices of Department of Health and Human Services Task Force on Alzheimer’s Disease. Neurology 1984;34:939-44.
20. Landau SM, Harvey D, Madison CM, Koeppe RA, Reiman EM, Foster NL, et al. Associations between cognitive, functional, and FDG-PET measures of decline in AD and MCI. Neurobiol Aging 2011;32:1207-18.
21. Schipke CG, Koglin N, Bullich S, Joachim LK, Haas B, Seibyl J, et al. Correlation of florbetaben PET imaging and the amyloid peptide Aß42 in cerebrospinal fluid. Psychiatry Res Neuroimaging 2017;265:98-101. 22. Morris E, Chalkidou A, Hammers A, Peacock J, Summers J, Keevil S.
Diagnostic accuracy of (18)F amyloid PET tracers for the diagnosis of Alzheimer’s disease: a systematic review and meta-analysis. Eur J Nucl Med Mol Imaging 2016;43:374-85.
23. Ong KT, Villemagne VL, Bahar-Fuchs A, Lamb F, Langdon N, Catafau AM, et al. Aβ imaging with 18F-florbetaben in prodromal Alzheimer’s disease: a prospective outcome study. J Neurol Neurosurg Psychiatry 2015;86:431-6.
24. Schneider JA, Arvanitakis Z, Bang W, Bennett DA. Mixed brain pathol-ogies account for most dementia cases in community-dwelling older persons. Neurology 2007;69:2197-204.
25. Galton CJ, Patterson K, Graham K, Lambon-Ralph MA, Williams G, Antoun N, et al. Differing patterns of temporal atrophy in Alzheimer’s disease and semantic dementia. Neurology 2001;57:216-25.
26. Jack CR Jr, Knopman DS, Jagust WJ, Shaw LM, Aisen PS, Weiner MW, et al. Hypothetical model of dynamic biomarkers of the Alzheimer’s pathological cascade. Lancet Neurol 2010;9:119-28.
27. Braak H, Braak E. Staging of Alzheimer’s disease-related neurofibril-lary changes. Neurobiol Aging 1995;16:271-84.
28. Yu JT, Tan L, Hardy J. Apolipoprotein E in Alzheimer’s disease: an up-date. Annu Rev Neurosci 2014;37:79-100.
29. Weintraub S, Wicklund AH, Salmon DP. The neuropsychological pro-file of Alzheimer disease. Cold Spring Harb Perspect Med 2012;2: a006171.
30. Wattjes MP, Henneman WJ, van der Flier WM, de Vries O, Traber F, Geurts JJ, et al. Diagnostic imaging of patients in a memory clinic: comparison of MR imaging and 64-detector row CT. Radiology 2009; 253:174-83.