Baseline Chloride Levels are
Associated with the Incidence of
Contrast-Associated Acute Kidney
Injury
Hyung Jung Oh
1,2, Sungwon Kim
3, Jung Tak Park
4, Sang-Joon Kim
5, Seung Hyeok Han
4,
Tae-Hyun Yoo
4, Dong-Ryeol Ryu
1,6,7, Shin-Wook Kang
4,8& Yong Eun Chung
3,8Although hypo- and hyperchloremia have been associated with worsening renal outcomes, there has been no study that correlates hypo- and hyperchloremia and the incidence of contrast-associated acute kidney injury (CA-AKI). A total of 13,088 patients with less than 2.0 mg/dL of serum creatinine (Cr) who underwent contrast-enhanced abdominal CT (CECT) were included. Patients were divided into 3 groups based on Cl (the hypo-, normo- and hyperchloremia groups). Patients were also classified by baseline Cr (<1.2; the ‘Normal Cr group’ and 1.2–2.0 mg/dL; the ‘Slightly increased Cr group’). Multivariate logistic regression analysis was used to reveal the association between Cl and CA-AKI. Among patients, 2,525 (19.3%) and 241 (1.8%) patients were classified in the hypo- and hyperchloremia group. The incidence of CA-AKI was significantly lower in the normochloremia group (4.0%) compared to the hypo- (5.4%) and hyperchloremia groups (9.5%). On multivariate logistic regression, hypochloremia was significantly associated with the incidence of CA-AKI compared with normochloremia (1.382, P = 0.002). Moreover, hypochloremia was still significantly associated with the incidence of CA-AKI in ‘Normal Cr group’ compared with normochloremia (1.314, P = 0.015), while hyperchloremia did not show significant association with CA-AKI incidence. In conclusion, hypochloremia might be associated with the incidence of CA-AKI even in patients who have normal-range Cr levels.
Acute deterioration of renal function due to iodinated contrast agents, defined as contrast-associated acute kid-ney injury (CA-AKI), is generally mild and transient, but sometimes can result in lasting renal dysfunction and need for renal replacement therapy1–3. CA-AKI is the leading cause of new onset renal failure in hospitalized
patients, with the highest risk being observed in patients with pre-existing impaired renal function1–3, and it
is significantly associated with increases in in-hospital and long-term morbidity and mortality, acceleration of chronic renal disease, and increased costs for medical care4.
Although the pathophysiology of CA-AKI is poorly understood, it may include acute vasoconstriction result-ing in renal hypoperfusion, hypoxia-induced oxidative stress, and free radicals generated within the acid envi-ronment of the renal medulla5. However, since there is no specific therapy for CA-AKI and because the disease
is mostly iatrogenic, prevention is considered to be of paramount importance, and a variety of approaches have been suggested to prevent CA-AKI by targeting these pathomechanisms6–11; 24-hour volume supplementation
with sodium chloride 0.9% is one approach still accepted and it is considered a cornerstone in the prevention of CA-AKI in clinical practice12,13. However, sodium chloride saline is chloride-rich14–16, and supplementing patients
with the solution can lead to hyperchloremia after fluid replacement16,17. Also, the consequent hyperchloremic
1Ewha Institute of Convergence Medicine, Ewha Womans University Mokdong Hospital, Seoul, Republic of Korea. 2Research Institute for Human Health Information, Ewha Womans University Mokdong Hospital, Seoul, Republic
of Korea. 3Department of Radiology, Yonsei University College of Medicine, 50-1 Yonsei-ro, Seodaemun-gu, Seoul,
03722, Korea. 4Department of Internal Medicine, College of Medicine, Yonsei University, Seoul, Republic of Korea. 5Ewha School of Business, Ewha Womans University, Seoul, Republic of Korea. 6Department of Internal Medicine,
School of Medicine, Ewha Womans University, Seoul, Republic of Korea. 7Tissue Injury Defense Research Center,
Ewha Womans University, Seoul, Republic of Korea. 8BK21 PLUS Project for Medical Science, Yonsei University
College of Medicine, Seoul, Republic of Korea. Correspondence and requests for materials should be addressed to Y.E.C. (email: yelv@yuhs.ac)
Received: 26 June 2017 Accepted: 30 November 2017 Published: xx xx xxxx
metabolic acidosis derived from chloride-rich solutions has been associated with poorly progressive outcomes in critically ill patients16,18–20.
Hypochloremia has also been independently associated with increased risk of mortality in critically ill patients, and this has been explained with the occurrence of metabolic alkalosis21. However, there are only a
few observational studies evaluating the association of hypochloremia with hospital morbidity22,23. Moreover,
no studies have been done on the correlation between hypochloremia and the incidence of CA-AKI. Thus, the aim of this study was primarily to investigate the association between the incidence of CA-AKI and baseline serum chloride concentrations by stratifying patients into three groups (hypochloremia, normochloremia, and hyperchloremia). Secondarily, we evaluated how changes in chloride levels from the baseline level affected the incidence of CA-AKI for each group.
Results
Baseline characteristics.
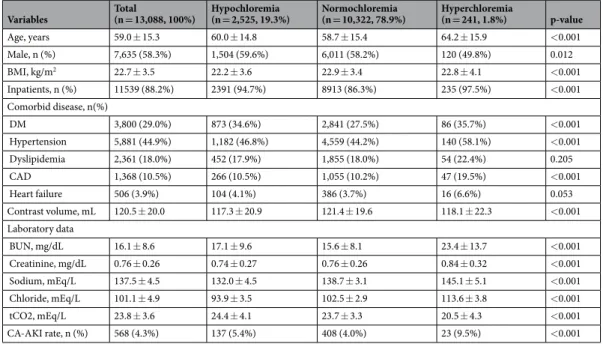
The mean age was 59.0 ± 15.3 years, and 7,635 (58.3%) patients were male. In addition, the mean body mass index (BMI) was 22.7 ± 3.5 kg/m2, and the detailed demographics are summarizedin Table 1.
When these patients were divided into three groups (hypochloremia, normochloremia, and hyperchloremia), 2,525 (19.3%) patients were in the hypochloremia group, and 241 (1.8%) patients were in the hyperchloremia group. Most of the patients were inpatients [11539 (88.1%)], and the hyperchloremia group had the highest por-tion of inpatients (94.7%) among the three groups with statistical significance. Patients in the hyperchloremia group were significantly older, and had more diabetes mellitus (DM), hypertension, and coronary artery dis-ease (CAD) compared to the other groups, and there were significantly more males in the hypochloremia group compared to the other groups. In the normochloremia group, the BMI was significantly higher than the other groups. The administered volume of contrast media was also significantly different between the groups. However, the volume per weight was the same for all groups because the contrast media volume was adjusted to each patient’s body weight (2 mL/kg). Moreover, of the laboratory data, serum blood urea nitrogen (BUN), creatinine (Cr), sodium, and chloride concentrations were significantly increased in the hyperchloremia group, whereas the serum total CO2 level was significantly elevated in the hypochloremia group compared to the other groups
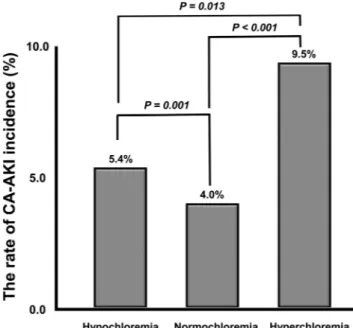
(Table 1). In addition, CA-AKI incidence was the highest in the hyperchloremia group (9.5%), and the second highest in the hypochloremia group (5.4%), with statistically significance compared to the normochloremia group (4.0%). Moreover, there was also significant difference in the incident rate of CA-AKI between hypochlo-remia and hyperchlohypochlo-remia groups (Table 1 and Fig. 1).
Hypochloremia is associated with incidence of CA-AKI.
Univariate analysis showed that both hypochloremia (RR; 1.394, 95% CI; 1.143–1.700, P = 0.001) and hyperchloremia (2.561, 95% CI; 1.650–3.984, P < 0.001) were significantly related to increased CA-AKI incidence compared to normochloremia. In addition, hypochloremia was significantly associated with CA-AKI incidence compared to normochloremia even afterVariables Total (n = 13,088, 100%) Hypochloremia (n = 2,525, 19.3%) Normochloremia (n = 10,322, 78.9%) Hyperchloremia (n = 241, 1.8%) p-value
Age, years 59.0 ± 15.3 60.0 ± 14.8 58.7 ± 15.4 64.2 ± 15.9 <0.001 Male, n (%) 7,635 (58.3%) 1,504 (59.6%) 6,011 (58.2%) 120 (49.8%) 0.012 BMI, kg/m2 22.7 ± 3.5 22.2 ± 3.6 22.9 ± 3.4 22.8 ± 4.1 <0.001 Inpatients, n (%) 11539 (88.2%) 2391 (94.7%) 8913 (86.3%) 235 (97.5%) <0.001 Comorbid disease, n(%) DM 3,800 (29.0%) 873 (34.6%) 2,841 (27.5%) 86 (35.7%) <0.001 Hypertension 5,881 (44.9%) 1,182 (46.8%) 4,559 (44.2%) 140 (58.1%) <0.001 Dyslipidemia 2,361 (18.0%) 452 (17.9%) 1,855 (18.0%) 54 (22.4%) 0.205 CAD 1,368 (10.5%) 266 (10.5%) 1,055 (10.2%) 47 (19.5%) <0.001 Heart failure 506 (3.9%) 104 (4.1%) 386 (3.7%) 16 (6.6%) 0.053 Contrast volume, mL 120.5 ± 20.0 117.3 ± 20.9 121.4 ± 19.6 118.1 ± 22.3 <0.001 Laboratory data BUN, mg/dL 16.1 ± 8.6 17.1 ± 9.6 15.6 ± 8.1 23.4 ± 13.7 <0.001 Creatinine, mg/dL 0.76 ± 0.26 0.74 ± 0.27 0.76 ± 0.26 0.84 ± 0.32 <0.001 Sodium, mEq/L 137.5 ± 4.5 132.0 ± 4.5 138.7 ± 3.1 145.1 ± 5.1 <0.001 Chloride, mEq/L 101.1 ± 4.9 93.9 ± 3.5 102.5 ± 2.9 113.6 ± 3.8 <0.001 tCO2, mEq/L 23.8 ± 3.6 24.4 ± 4.1 23.7 ± 3.3 20.5 ± 4.3 <0.001 CA-AKI rate, n (%) 568 (4.3%) 137 (5.4%) 408 (4.0%) 23 (9.5%) <0.001
Table 1. Baseline characteristics among the patients performing contrast CT, but with less than 2.0 mg/dL of
serum creatinine at baseline. Data are expressed as mean (with standard deviation) or n (%); Abbreviations; DM, diabetes mellitus; CAD, coronary arterial disease; BUN, blood urea nitrogen; tCO2, total CO2;
CA-AKI, contrast-associated acute kidney injury. Hypochloremia; chloride level less than 98 mEq/L at baseline; Normochloremia; chloride level between 98 to 110 mEq/L at baseline; Hyperchloremia; chloride level over 110 mEq/L at baseline.
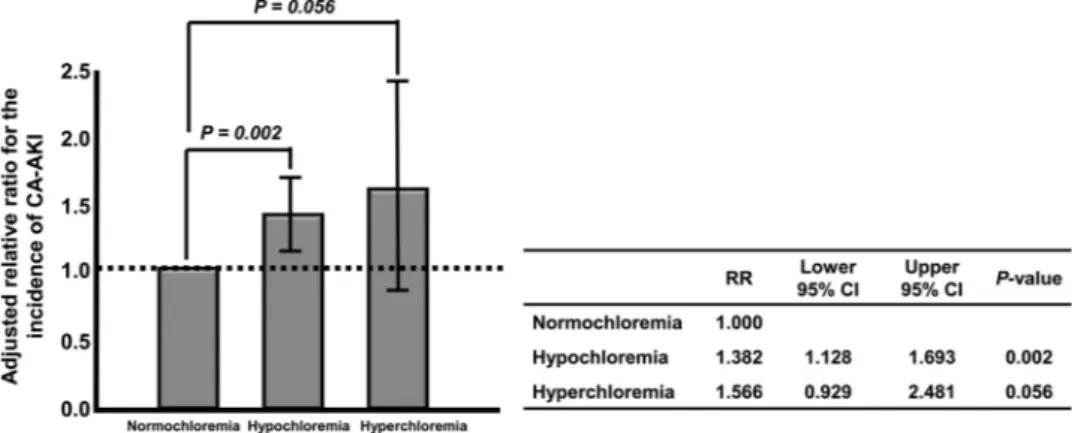
adjusting for several covariables [relative risk (RR), 1.382; 95% confidence interval (CI), 1.128–1.693; P = 0.002], whereas hyperchloremia was marginally related to the CA-AKI incidence compared to normochloremia (RR, 1.566; 95% CI, 0.929–2.481; P = 0.056) (Table 2 and Fig. 2).
The incidence of CA-AKI according to creatinine levels.
The same analyses were conducted in patients who had serum Cr concentrations of less than 1.2 mg/dL (the ‘Normal Cr group’, n = 12,280) or 1.2 to 2.0 mg/ dL (the ‘Slightly increased Cr group’, n = 808) serum Cr concentrations at baseline, respectively, and the baseline characteristics are described in Supplementary Tables 1 and 2.Multivariate logistic analyses presented that hypochloremia was still significantly associated with CA-AKI incidence in the ‘Normal Cr group’ compared with normochloremia (RR, 1.314; 95% CI, 1.550–1.636; P = 0.015), while hyperchloremia did not show significant association with the CA-AKI incidence in ‘Normal Cr group’. In ‘Slightly increased Cr group’, neither hypochloremia nor hyperchloremia was significantly related to CA-AKI incidence (Table 3).
Effect of increases in chloride concentration on the incident rate of CA-AKI.
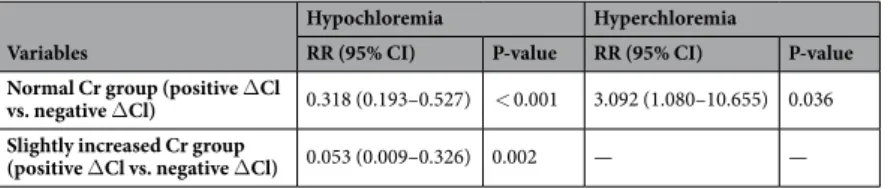
We examined the post chloride concentration when the post Cr was measured and calculated delta chloride (ΔCl). Positive ΔCl, defined by an increase in chloride concentration from the baseline concentration, was significantly associated with a reduction in CA-AKI incidence in all groups of hypochloremia (in both the ‘Normal Cr group’ and the ‘Slightly increased Cr group’) compared to negative ΔCl (in the ‘Normal Cr group’, RR, 0.318; 95% CI, 0.193– 0.527; P < 0.001, in the ‘Slightly increased Cr group’, RR, 0.053; 95% CI, 0.009–0.326; P = 0.002), while in hyper-chloremia group, positive ΔCl was significantly related to an increase in CA-AKI incidence in the ‘Normal Cr group’ compared to negative ΔCl (RR, 3.092; 95% CI, 1.080–10.655; P = 0.036) (Table 4).Figure 1. The rate of CA-AKI incidence. CA-AKI incidence was the highest in the hyperchloremia group
(9.5%), and the second highest in the hypochloremia group (5.4%), with statistically significance compared to the normochloremia group (4.0%). Moreover, there was also significant difference in the incident rate of CA-AKI between the hypochloremia and hyperchloremia groups Abbreviations; CA-CA-AKI, contrast-associated acute kidney injury.
Variables
Univariate Multivariate
RR (95% CI) P-value RR (95% CI) P-value
Normochloremia Reference Reference
Hypochloremia 1.394 (1.143–1.700) 0.001 1.382 (1.128–1.693) 0.002 Hyperchloremia 2.564 (1.650–3.984) <0.001 1.566 (0.989–2.481) 0.056
Table 2. Univariate and multivariate logistic regression analysis for the incidence of CA-AKI on the baseline
chloride level (n = 13,088). Abbreviations; RR, relative risk; CI, confidence interval; CA-AKI, contrast-associated acute kidney injury. Adjusted for age, sex, admission status, comorbidity diseases including DM, hypertension, coronary artery disease, and heart failure, serum creatinine level, serum BUN level, serum tCO2. Hypochloremia; chloride level less than 98 mEq/L at baseline. Normochloremia; chloride level between 98 to 110 mEq/L at baseline. Hyperchloremia; chloride level over 110 mEq/L at baseline.
Discussion
Several previous studies described a positive correlation between chloride levels and severity of AKI19,20,24.
Especially, Yunos et al.24 demonstrated that chloride-restrictive solution results in a lower incidence of AKI
com-pared with chloride-liberal fluid strategies in critically ill patients. However, recent studies could not prove that sodium bicarbonate was superior to isotonic sodium chloride for preventing incidence of CA-AKI25,26. Therefore,
we tried to identify the association between CA-AKI incidence and baseline serum chloride concentrations and to evaluate what effect an increase in chloride level would have on the incidence of CA-AKI. In the current study, the rate of CA-AKI incidence was significantly increased in the hypochloremia group by 38.2% compared to the normochloremia group, and was marginally increased in the hyperchloremia group compared to the normochlo-remia group. In contrast, hypochlonormochlo-remia was significantly associated with an increase in CA-AKI incidence only in the ‘Normal Cr group’, while there were no significant associations between incidence of CA-AKI incidence and hyperchloremia in the ‘Normal Cr group’. Plus, neither hypochloremia nor hyperchloremia was significantly related to CA-AKI incidence in the ‘Slightly increased Cr group’. However, positive ΔCl was significantly associ-ated with reduced CA-AKI incidence in the hypochloremia group compared with negative ΔCl, whereas it was significantly related to increased CA-AKI incidence in the hyperchloremia group of the ‘Normal Cr group’.
Hypochloremia is related to mortality in critically ill patients, and this is thought to be due to metabolic alkalosis27,28,
but the main factor responsible for mortality due to hypochloremia and metabolic alkalosis is unclear23,29. Tani et al.23
showed that hypochloremic patients with metabolic acidosis had a higher mortality rate compared with those with metabolic alkalosis, suggesting that hypochloremia is associated with mortality independently of metabolic alkalosis. Moreover, hypochloremia could be a sign of illness severity as a result of dysregulated homeostasis22,
and it can be related to increased CA-AKI incidence compared with normochloremia. In this study, patients with hypochloremia were also significantly older, and had more DM and hypertensive comorbidity diseases than patients with normochloremia. However, hypochloremia was still independently associated with increased
Figure 2. Adjusted relative risk of CA-AKI. Hypochloremia was significantly associated with CA-AKI
incidence compared to normochloremia even after adjusting for several covariables, whereas hyperchloremia was marginally related to CA-AKI incidence compared to normochloremia. Abbreviations; CA-AKI, contrast-associated acute kidney injury.
Variables
Univariate Multivariate
RR (95% CI) P-value RR (95% CI) P-value Normal Cr group (n = 12,280)
Normochloremia Reference Reference
Hypochloremia 1.347 (1.086–1.671) 0.007 1.314 (1.550–1.636) 0.015 Hyperchloremia 2.356 (1.419–3.913) 0.001 1.360 (0.799–2.315) 0.257 Slightly increased Cr group (n = 808)
Normochloremia Reference Reference
Hypochloremia 1.781 (1.048–3.027) 0.033 1.641 (0.940–2.866) 0.082 Hyperchloremia 2.303 (0.912–5.819) 0.078 2.322 (0.872–6.186) 0.092
Table 3. Subgroup analysis for the incidence of CA-AKI on the baseline chloride level depending on serum
creatinine level [‘Normal Cr group’ (n = 12,280) and ‘Slightly increased Cr group (n = 808)]. Abbreviations; CA-AKI, contrast-associated acute kidney injury; RR, relative risk; CI, confidence interval; Cr, creatinine. Adjusted for age, sex, admission status, comorbidity diseases including DM, hypertension, coronary artery disease, and heart failure, serum creatinine level, serum BUN level, serum tCO2. Normal Cr group; patients who had a serum Cr level of less than 1.2 mg/dL. Slightly increased Cr group; patients who had 1.2 ≤ serum Cr levels < 2.0 mg/dL. Hypochloremia; chloride level less than 98 mEq/L at baseline. Normochloremia; chloride level between 98 to 110 mEq/L at baseline. Hyperchloremia; chloride level over 110 mEq/L at baseline.
CA-AKI incidence even after adjusting for the above factors, suggesting that hypochloremia was associated with an increase in CA-AKI incidence, independent of the disease comorbidity. Unfortunately, we could not measure serial total CO2 levels in these patients to evaluate changes in acid-base. This is thought to be one of several
limi-tations that can explain why positive ΔCl helped to reduce the incidence of CA-AKI in the hypochloremia group, but aggravated the incident rate of CA-AKI in hyperchloremia group compared with negative ΔCl. However, based on our results, active correction of serum chloride levels before contrast-enhanced CT examination might help prevent CA-AKI incidence in hypochloremic milieu.
In comparison, hyperchloremia was not related to the incidence of CA-AKI in this study. Unlike previous studies, the hyperchloremia group was comprised of only 248 (1.8%) patients, hampering identification of signif-icant associations between hyperchloremia and the increased CA-AKI incident rate. Thus, further studies involv-ing larger populations are warranted to determine the relationship between hyperchloremia and CA-AKI. In contrast, since positive ΔCl was significantly related to an increase of CA-AKI incidence compared with negative ΔCl in the hyperchloremia group of the ‘Normal Cr group’, caution should be taken not to elevate chloride levels when patients are in a hyperchloremic condition, even though they might need contrast CT examinations.
Although alkalization with bicarbonate perfusion may attenuate the production of hydroxyl radicals and thus reduce the formation of reactive oxygen species30, bicarbonate solution cannot be determined as superior to saline
solution for preventing CA-AKI incidence25,26. However, this study can suggest that additional interventional
studies to investigate the superiority of each solution (bicarbonate solution vs. saline solution) may be useful after patients are stratified according to baseline chloride levels.
As seen in Supplementary Table 3, the ‘No CA-AKI group’ used a significantly higher total contrast volume compared to the ‘CA-AKI group’ in the ‘Slightly increased Cr group’, while there were no significant differences in the total contrast volume used between the two groups in all the enrolled patients and the ‘Normal Cr group’. However, since the amount of contrast agent injected is adjusted to each patient’s body weight (2 ml/kg), the administered contrast volume per body weight (kg) was the same throughout this study. The difference in total contrast volume between the three groups of patients with Cr of 1.2 to 2.0 mg/dL might originate from different body weights.
There are several limitations in this study. First, this was retrospective cohort study and thus was subject to selection bias. Second, patients were arbitrarily classified into three groups according to our hospital reference values, and consequently, patients were distributed unevenly among the three groups. However, there are no established cut-off values for hypo-, normo-, or hyperchloremia19,22,23; most studies use cut-off values of 98 mEq/L
for hypochloremia and 110 mEq/L for hyperchloremia19,22. Third, only patients with a serum Cr concentration
of less than 2.0 mg/dL were selected arbitrarily. Thus, our findings cannot be extrapolated beyond 2.0 mg/dL of serum Cr. Fourth, the current status of patients and the reasons for CT examination were not investigated. Fifth, we did not investigate how acid‒base changed according to alterations of the chloride level, and it was hard to explain the pure effect of chloride level changes on preventing CA-AKI. Despite these limitations, for the first time, this study showed that hypochloremia may be independently associated with increased CA-AKI incidence especially in patients with normal kidney function, and that an increase in chloride level from the baseline level may be independently related to decrease of CA-AKI incidental rate in hypochloremic patients compared with a decrease in chloride level from the baseline, while in hyperchloremia, elevation of chloride rather increased the CA-AKI incidence.
In conclusion, hypochloremia might be significantly associated with increased CA-AKI especially in patients with normal kidney function and an increment of chloride might reduce the incidence of CA-AKI in hypochlo-remic conditions. Hence, patients with hypochloremia and normal renal function at baseline should be mon-itored closely when they need to undergo a contrast-CT examination. In the future, a randomized-controlled interventional study involving a larger population is needed to evaluate the association between increased chlo-ride levels and the CA-AKI incident rate of hypochloremic patients.
Variables
Hypochloremia Hyperchloremia
RR (95% CI) P-value RR (95% CI) P-value Normal Cr group (positive ΔCl
vs. negative ΔCl) 0.318 (0.193–0.527) < 0.001 3.092 (1.080–10.655) 0.036 Slightly increased Cr group
(positive ΔCl vs. negative ΔCl) 0.053 (0.009–0.326) 0.002 — —
Table 4. Multivariate logistic regression analyses for the incidence of CA-AKI with delta chloride concentration
within 72 hours in hypo- and hyperchloremia groups. Abbreviations; CA-AKI, contrast-associated acute kidney injury; RR, relative risk; CI, confidence interval; Cr, creatinine. ΔCl was defined by [post peak chloride concentration – chloride concentration at baseline]. Positive ΔCl was defined as ΔCl ≥ 0, while negative ΔCl was defined as ΔCl < 0. Adjusted for age, sex, BMI, admission status, comorbidity diseases (such as DM, hypertension, coronary artery disease, and heart failure), serum creatinine, serum BUN, tCO2, and contrast media volume. Normal Cr group; patients who had a serum Cr level of less than 1.2 mg/dL. Slightly increased Cr group; patients who had 1.2 ≤ serum Cr levels < 2.0 mg/dL. Hypochloremia; chloride level less than 98 mEq/L at baseline. Normochloremia; chloride level between 98 to 110 mEq/L at baseline. Hyperchloremia; chloride level over 110 mEq/L at baseline.
Materials and Methods
Study population.
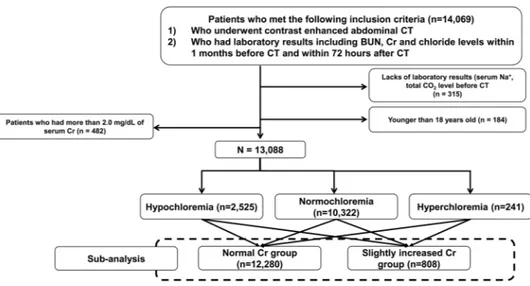
This retrospective and Health Insurance Portability and Accountability Act-compliant (HIPAA) study was approved by the institutional review board of Yonsei University College of Medicine and informed consent was waived. This study was performed in accordance with HIPAA. From January 2014 to December 2015, patients who met the following inclusion criteria were included in this study: 1) patients who underwent contrast-enhanced abdominal CT, 2) patients who had laboratory results including serum BUN, Cr and Cl levels within 1 month before CT examination and within 72 hours after CT examination. Through a search of the electronic medical database, 14,069 patients who met the inclusion criteria were found. Among them, patients who did not have laboratory results for the total CO2 level or the serum sodium level within 1 monthbefore CT examination (n = 315) were excluded.
Additionally, 184 patients who were younger than 18 years old, and 482 patients who had more than 2.0 mg/ dL of serum Cr before CT examination were also excluded. Finally, 13,088 patients (mean age, 59.0 ± 15.3; male ratio, 58.3%) were included in this study (Fig. 3). Patients were divided into three groups according to the refer-ence values of our institution: the hypochloremia group (serum Cl− < 98 mEq/L, n = 2,525), normochloremia
group (98 ≤ serum Cl− ≤ 110 mEq/L, n = 10,322), and hyperchloremia group (serum Cl− > 110 mEq/L, n = 241).
Data collection.
Data on baseline characteristics, including demographic information and preexisting chronic comorbidities were collected at the point of CT examination. Moreover, baseline laboratory data acquired within 1 month before CT examination were collected, and the peak values of post BUN and Cr concentrations were recorded within 72 hours after performing CT. In this study, we considered the last values obtained before the patient underwent CT as the baseline laboratory data, but we excluded patients who did not have laboratory results within 1 month before the CT procedure. We theorized that the last value obtained before CT examination would reflect each patient’s condition better than other laboratory values. Most of the inpatients in the current study had laboratory results obtained within 3 days before CT examination, and we assumed that these results would effectively show the status of each patient before CT procedure. Meanwhile, according to our hospital pol-icy, laboratory results (especially BUN and Cr) obtained within 1 month before CT examination are considered as recent data for outpatients, while patients who do not have BUN/Cr results obtained within 1 month before CT procedure undergo laboratory tests. Hence, we set the ‘1 month before CT examination as the cut-off timeline for recent laboratory data. In addition, serum chloride concentrations were measured by indirect potentiometry (ADVIA 1800 Chemistry System; Siemens Healthcare Diagnostic Inc., Oakville, ON, Canada). We also measured chloride concentrations at the same time as serum post BUN and Cr concentrations to evaluate how changes in chloride levels affected the development of CA-AKI.Definition.
1. CA-AKI was defined based on the KDIGO criteria with any of the following conditions; Increase in SCr by ≥0.3 mg/dL within 48 hours or increase in SCr to ≥1.5 times baseline, which is known or presumed to have occurred within the prior 7 days or urine volume < 0.5 mL/kg/h for 6 hours31.
2. Post BUN was defined as the peak serum BUN concentration found within 72 hours after CT examination 3. Post Cr was defined as the peak serum Cr concentration found within 72 hours after CT examination 4. Delta creatinine level (ΔCr) (%) was defined by [Crwithin 72h − Crat baseline]/[Crat baseline] × 100(%).
• Crwithin 72h was defined by the peak value of serum Cr found within 72 hours after contrast administration.
• Crat baseline was defined as the serum Cr level found before contrast administration.
5. Delta chloride level (ΔCl) (mEq/L) was defined by [Cl−
within 72h − Cl−at baseline].
• Cl−
within 72h was defined by the peak value of chloride found within 72 hours after contrast administration.
• Cl−
at baseline was defined as the chloride level found before contrast administration.
• Positive ΔCl was defined as ΔCl ≥ 0, while negative ΔCl was defined as ΔCl < 0.
Sub-analysis.
All patients were separated into two groups with the normal reference range of serum Cr (1.2 mg/dL) used in our hospital; the ‘Normal Cr group’ had a serum Cr level of less than 1.2 mg/dL (n = 12,280) and the ‘Slightly increased Cr group’ had 1.2 ≤ serum Cr levels < 2.0 mg/dL (n = 808). We analyzed the associa-tions between hypo- or hyperchloremia and the increase in CA-AKI occurrence for the ‘Normal Cr group’ and the ‘Slightly increased Cr group’, respectively. Moreover, all patients were also divided into two groups according to changes in chloride concentrations before and after CT examination: positive ΔCl and negative ΔCl. The effect of positive ΔCl on CA-AKI incidence was compared with the effect of negative ΔCl for the ‘Normal Cr group’ and the ‘Slightly increased Cr group’, respectively.Statistical analysis.
Statistical analysis was performed using SPSS for Windows, version 22.0 (SPSS Inc, Chicago, IL, USA). Continuous variables were presented as means ± standard deviations, and categorical varia-bles were presented as numbers and percentages. Groups were compared with ANOVA for continuous variavaria-bles and the χ2 test for categorical variables, respectively. Multivariate logistic regression analyses were conducted to estimate hypochloremia and hyperchloremia for the incidence of CA-AKI with relative risk (RR) and 95% confidence interval (CI). Among the significant covariates identified by univariate analysis (P < 0.1), several var-iables were selected after correlation analysis to avoid multicollinearity (variance inflation factor < 10); age, sex, admission status of patients, the presence of DM, hypertension, CAD, heart failure, serum BUN, Cr, tCO2. A finalmultiple logistic regression analysis was then conducted in a backward stepwise manner. All tests were two-sided, and a P value of < 0.05 was considered statistically significant.
References
1. Weisbord, S. D. & Palesvsky, P. M. Acute kidney injury: intravenous fluid to prevent contrast-induced AKI. Nat Rev Nephrol 5, 256–257 (2009).
2. Subramaniam, R. M. et al. Effectiveness of prevention strategies for contrast-induced nephropathy: A systematic review and meta-analysis. Ann Intern Med 164, 406–416 (2016).
3. Eng, J. et al. Comparative effect of contrast media type on the incidence of contrast-induced nephropathy: A systematic review and meta-analysis. Ann Intern Med 164, 417–424 (2016).
4. Rihal, C. S. et al. Incidence and prognostic importance of acute renal failure after percutaneous coronary intervention. Circulation
105, 2259–2264 (2002).
5. Mueller, C. Prevention of contrast-induced nephropathy with volume supplementation. Kidney Int Suppl; https://doi.org/10.1038/ sj.ki.5000369. S16–19 (2006).
6. Marenzi, G. et al. The prevention of radiocontrast-agent-induced nephropathy by hemofiltration. N Engl J Med 349, 1333–1340 (2003).
7. Marenzi, G. et al. N-acetylcysteine and contrast-induced nephropathy in primary angioplasty. N Engl J Med 354, 2773–2782 (2006). 8. Merten, G. J. et al. Prevention of contrast-induced nephropathy with sodium bicarbonate: a randomized controlled trial. JAMA 291,
2328–2334 (2004).
9. Stone, G. W. et al. Fenoldopam mesylate for the prevention of contrast-induced nephropathy: a randomized controlled trial. JAMA
290, 2284–2291 (2003).
10. Birck, R. et al. Acetylcysteine for prevention of contrast nephropathy: meta-analysis. Lancet 362, 598–603 (2003).
11. Hoffmann, U., Fischereder, M., Kruger, B., Drobnik, W. & Kramer, B. K. The value of N-acetylcysteine in the prevention of radiocontrast agent-induced nephropathy seems questionable. J Am Soc Nephrol 15, 407–410 (2004).
12. Bader, B. D. et al. What is the best hydration regimen to prevent contrast media-induced nephrotoxicity? Clin Nephrol 62, 1–7 (2004).
13. Trivedi, H. S. et al. A randomized prospective trial to assess the role of saline hydration on the development of contrast nephrotoxicity. Nephron Clin Pract 93, C29–34 (2003).
14. Soni, N. British Consensus Guidelines on Intravenous Fluid Therapy for Adult Surgical Patients (GIFTASUP): Cassandra’s view.
Anaesthesia 64, 235–238 (2009).
15. Myburgh, J. A. & Mythen, M. G. Resuscitation fluids. N Engl J Med 369, 1243–1251 (2013).
16. O’Dell, E., Tibby, S. M., Durward, A. & Murdoch, I. A. Hyperchloremia is the dominant cause of metabolic acidosis in the postresuscitation phase of pediatric meningococcal sepsis. Crit Care Med 35, 2390–2394 (2007).
17. Noritomi, D. T. et al. Metabolic acidosis in patients with severe sepsis and septic shock: a longitudinal quantitative study. Crit Care
Med 37, 2733–2739 (2009).
18. Moviat, M. et al. Stewart analysis of apparently normal acid-base state in the critically ill. J Crit Care 28, 1048–1054 (2013). 19. Neyra, J. A. et al. Association of Hyperchloremia With Hospital Mortality in Critically Ill Septic Patients. Crit Care Med 43,
1938–1944 (2015).
20. Zhang, Z., Xu, X., Fan, H., Li, D. & Deng, H. Higher serum chloride concentrations are associated with acute kidney injury in unselected critically ill patients. BMC Nephrol 14, 235 (2013).
21. Khanna, A. & Kurtzman, N. A. Metabolic alkalosis. J Nephrol 19(Suppl 9), S86–96 (2006).
22. Kimura, S. et al. Association of serum chloride concentration with outcomes in postoperative critically ill patients: a retrospective observational study. J Intensive Care 2, 39 (2014).
23. Tani, M., Morimatsu, H., Takatsu, F. & Morita, K. The incidence and prognostic value of hypochloremia in critically ill patients.
ScientificWorldJournal 2012, 474185 (2012).
24. Yunos, N. M. et al. Association between a chloride-liberal vs chloride-restrictive intravenous fluid administration strategy and kidney injury in critically ill adults. JAMA 308, 1566–1572 (2012).
25. Valette, X. et al. Sodium Bicarbonate Versus Sodium Chloride for Preventing Contrast-Associated Acute Kidney Injury in Critically Ill Patients: A Randomized Controlled Trial. Crit Care Med, https://doi.org/10.1097/ccm.0000000000002267 (2017).
26. Solomon, R. et al. Randomized Trial of Bicarbonate or Saline Study for the Prevention of Contrast-Induced Nephropathy in Patients with CKD. Clin J Am Soc Nephrol 10, 1519–1524 (2015).
27. Angus, D. C. & van der Poll, T. Severe sepsis and septic shock. N Engl J Med 369, 840–851 (2013). 28. Khanna, A. & Kurtzman, N. A. Metabolic alkalosis. J Nephrol 19, S86–S96 (2006).
29. Terzano, C. et al. Mixed acid-base disorders, hydroelectrolyte imbalance and lactate production in hypercapnic respiratory failure: the role of noninvasive ventilation. PLoS One 7, e35245 (2012).
30. Heyman, S. N., Rosen, S., Khamaisi, M., Idee, J. M. & Rosenberger, C. Reactive oxygen species and the pathogenesis of radiocontrast-induced nephropathy. Invest Radiol 45, 188–195 (2010).
31. KDIGO Clinical Practice Guideline for Acute Kidney Injury. Kidndy Int Suppl 2, 1, https://doi.org/10.1038/kisup.2012.1 (2012).
Acknowledgements
This research was supported by Basic Science Research Program through the National Research Foundation of Korea (NRF) grant funded by the Korea government (MSIT) (2010–0027945 and NRF-2014R1A1A2057091).
Author Contributions
H.J.O. conceived the idea, prepared, analyzed data, performed statistical analysis, wrote the main manuscript text, and prepared figures and tables. He also contributed to critical correction of the paper. S.W.K. prepared and analyzed data. He also contributed to the writing and critical correction of the paper. J.T.P., He contributed to the writing and critical correction of the paper. S.J.K. He performed statistical analysis and contributed to the writing and critical correction of the paper. S.H.H. He contributed to the writing and critical correction of the paper. T.H.Y. He contributed to the writing and critical correction of the paper. D.R.R. He contributed to the writing and critical correction of the paper. S.W.K. He contributed to the writing and critical correction of the paper. Y.E.C. conceived the idea, prepared, analyzed data, performed statistical analysis, wrote the main manuscript text, and prepared figures and tables. He also contributed to the critical correction of the paper.
Additional Information
Supplementary information accompanies this paper at https://doi.org/10.1038/s41598-017-17763-7.
Competing Interests: The authors declare that they have no competing interests.
Publisher's note: Springer Nature remains neutral with regard to jurisdictional claims in published maps and
institutional affiliations.
Open Access This article is licensed under a Creative Commons Attribution 4.0 International
License, which permits use, sharing, adaptation, distribution and reproduction in any medium or format, as long as you give appropriate credit to the original author(s) and the source, provide a link to the Cre-ative Commons license, and indicate if changes were made. The images or other third party material in this article are included in the article’s Creative Commons license, unless indicated otherwise in a credit line to the material. If material is not included in the article’s Creative Commons license and your intended use is not per-mitted by statutory regulation or exceeds the perper-mitted use, you will need to obtain permission directly from the copyright holder. To view a copy of this license, visit http://creativecommons.org/licenses/by/4.0/.