Sterol Regulatory Element-binding Protein
(SREBP)-1-mediated Lipogenesis Is Involved in Cell Senescence
*
□SReceived for publication, March 4, 2010, and in revised form, June 23, 2010Published, JBC Papers in Press, July 8, 2010, DOI 10.1074/jbc.M110.120386 You-Mie Kim‡§, Hyun-Taek Shin‡§, Yong-Hak Seo‡§, Hae-Ok Byun‡§, Soo-Han Yoon§¶, In-Kyu Lee储, Dong-Hoon Hyun**, Hae-Young Chung‡‡, and Gyesoon Yoon‡§1
From the‡Department of Biochemistry and Molecular Biology and the¶Department of Neurosurgery, School of Medicine, and the
§Department of Molecular Science and Technology, the Graduate School, Ajou University, Suwon 443-721, Korea , the储Department
of Internal Medicine, Kyungpook National University School of Medicine, Daegu 700-721, Korea, the **Department of Life Science, Ewha Womans University, Seoul 120-750, South Korea, and the‡‡College of Pharmacy, Pusan National University,
Pusan 609-735, Korea
Increased cell mass is one of the characteristics of senescent cells, but this event has not been clearly defined. When subcel-lular organellar mass was estimated with organelle-specific fluo-rescence dyes, we observed that most membranous organelles progressively increase in mass during cell senescence. This increase was accompanied by an increase in membrane lipids and augmented expression of lipogenic enzymes, such as fatty acid synthase (FAS), ATP citrate lyase, and acetyl-CoA carbox-ylase. The mature form of sterol regulatory element-binding protein (SREBP)-1 was also elevated. Increased expression of these lipogenic effectors was further observed in the liver tissues of aging Fischer 344 rats. Ectopic expression of mature form of SREBP-1 in both Chang cells and primary young human diploid fibroblasts was enough to induce senescence. Blocking lipo-genesis with FAS inhibitors (cerulenin and C75) and via siRNA-mediated silencing of SREBP-1 and ATP citrate lyase significantly attenuated H2O2-induced senescence. Finally, old human diploid fibroblasts were effectively reversed to young-like cells by challenging with FAS inhibitors. Our results suggest that enhanced lipogenesis is not only a common event, but also critically involved in senescence via SREBP-1 induction, thereby contributing to the increase in organelle mass (as a part of cell mass), a novel indicator of senescence.
Enlarged cell morphology is a typical characteristic of senes-cent cells, reflecting increased cell mass (1–3). However, the detailed components of the mass are not clearly defined, and whether the increase in mass is due to the increase of any spe-cific cellular compartment(s), or all, is unknown. Until now, the lysosome has been the most recognized organelle increased in both senescent and aged cells (4, 5). However, senescent lyso-somes are filled with indigestible autofluorescent pigments, such as lipofuscin, and displaying nonfunctionality (6). Re-cently, an increase in mitochondrial mass has been reported in stress-induced senescence (7) and replicative senescence (8, 9),
which was generally explained to be the result of its compensa-tory biogenesis to cope with the persistent functional defects of mitochondria (10, 11). An increase in mitochondrial mass is further augmented by the inability of the lysosome to remove damaged mitochondria, thereby allowing the damaged mito-chondria to generate hazardous reactive oxygen species (ROS)2 continuously. This sequence suggests that most senescent mitochondria are also not functionally intact. The functional deterioration of mitochondrial respiration accompanied by a dramatic increase in their mass during cell senescence and aging has often been found, supporting the hypothesis (7, 12). The close link between the accumulated nonfunctional or-ganelles, mitochondria and lysosomes, yields the “mitochon-drial-lysosomal axis theory of aging” (13, 14). This theory suffi-ciently supports the generation of persistent oxidative stress during the progression of senescence. Analogous to this theory, the inevitable increase in nonfunctional organelles due to the combined actions of the uncontrolled ROS generator (mito-chondria) and the nonfunctional eradicator (lysosome) is likely not restricted to mitochondria, but may be applied to all sub-cellular components. Therefore, whether all sub-cellular organelles, especially membranous ones, are also under the compensatory enhancement of their biosynthesis and, if so, whether these features are genuinely involved in the progression of cell senes-cence should be evaluated. Monitoring the biogenetic activity of each organelle is not simple; however, lipid biosynthesis is a critical element for the biogenesis of all membranous organelles and may be a plausible barometer of overall membranous organelle biogenesis.
Lipid biosynthesis, called lipogenesis, includes fatty acid syn-thesis and the subsequent synsyn-thesis of triglycerides and mem-brane phosphoglycerides. Lipogenesis is activated during cell growth and proliferation to provide membranous components for subcellular organelle formation (15, 16). Lipogenesis com-prises multiple sequential steps governed by several key lipo-genic enzymes, including ATP citrate lyase (ACL), acetyl-CoA *This work was supported by Korean Science and Engineering Foundation
Grant R13-2003-019-01007-0 funded by the Korean government.
□S
The on-line version of this article (available at http://www.jbc.org) contains supplemental Figs. S1–S4.
1To whom correspondence should be addressed: Gyesoon Yoon, Dept. of
Biochemistry and Molecular Biology, School of Medicine, Ajou University, Suwon 443-721, Korea. Tel.: 82-31-219-5054; Fax: 82-31-219-5059; E-mail: ypeace@ajou.ac.kr.
2The abbreviations used are: ROS, reactive oxygen species; ACC, acetyl-CoA
carboxylase; ACL, ATP citrate lyase; ad-mSREBP, mature SREBP-1
adenovi-rus; DCFH-DA, 2⬘,7⬘-dichlorodihydrofluorescein diacetate; DFO,
deferox-amine; DT, doubling time; FAS, fatty acid synthase; FSC, forward scatter;
HDF, human diploid fibroblast; PD, population doubling; SA-
-galactosid-ase, senescence-associated-galactosidase; SREBP, sterol regulatory
ele-ment-binding protein; SSC, side scatter.
at Ewha Medical Library on October 24, 2016
http://www.jbc.org/
Downloaded from
at Ewha Medical Library on October 24, 2016
http://www.jbc.org/
Downloaded from
at Ewha Medical Library on October 24, 2016
http://www.jbc.org/
Downloaded from
at Ewha Medical Library on October 24, 2016
http://www.jbc.org/
Downloaded from
at Ewha Medical Library on October 24, 2016
http://www.jbc.org/
Downloaded from
at Ewha Medical Library on October 24, 2016
http://www.jbc.org/
Downloaded from
at Ewha Medical Library on October 24, 2016
http://www.jbc.org/
carboxylase (ACC), and fatty acid synthase (FAS) (17). ACL converts cytosolic citrate into acetyl-CoA and oxaloacetate, supplying essential metabolites for lipid biosynthesis. ACC cat-alyzes the irreversible carboxylation of acetyl-CoA to produce malonyl-CoA, and FAS subsequently condenses acetyl-CoA and malonyl-CoA to generate long chain fatty acids. Interest-ingly, the expression of these lipogenic enzymes is controlled by the common lipogenic transcription factors, sterol regulatory element-binding proteins (SREBPs). Three SREBP isoforms (SREBP-1a, -1c, and -2) have been identified. SREBP-1a and -1c are alternative spliced forms transcribed from two distinct pro-moters on the same gene, whereas SREBP-2 is encoded from a different gene. SREBP-1 plays a greater role in regulating fatty acid synthesis than cholesterol synthesis, whereas SREBP-2 is relatively selective in transcriptionally activating genes in-volved in cholesterol biosynthesis (18, 19). SREBPs are initially bound to the rough endoplasmic reticulum membrane but, upon activation, are cleaved to liberate the N-terminal portion containing a basic helix-loop-helix leucine zipper domain. The cleaved active fragment enters the nucleus, where it binds to specific sterol response elements within the promoter regions of the lipogenic genes and activates their transcription (17, 18). Therefore, SREBP activation can be used as a good indicator of the lipogenesis status of the cell. In addition, SREBP is the best target for controlling cellular lipogenesis and exploring the relationship between lipogenesis and senescence.
In this study, we show that all subcellular organelles are gen-erally increased with membrane lipids in both stress-induced senescence and replicative senescence. In addition, we demon-strate that lipid biosynthesis is directly involved in senescence-associated organelle biogenesis via SREBP-1 activation. These results suggest that SREBP-1-mediated lipogenesis is an impor-tant modulator of senescence and provide new insight into the metabolic background of aging and aging-related pathogenesis. The overall organelle increase is also indicated as a novel indi-cator of senescence.
EXPERIMENTAL PROCEDURES
Cell Culture, Generation of Cell Senescence, Cell Growth Rate— Chang cells were purchased from the American Type Culture Collection and were cultured in DMEM supplemented with 10% fetal bovine serum (FBS; Invitrogen) and antibiotics at 37 °C in a humidified incubator with 5% CO2. Chang cells, immortalized normal human hepatocytes, were chosen to understand metabolic backgrounds related to stress-induced senescence due to their homogeneous replicative capacity and strong metabolic properties. To generate stress-induced senes-cence, Chang cells were exposed to 200 M deferoxamine
(DFO) or H2O2for the indicated periods. For replicative senes-cence, the primary human diploid fibroblasts (HDFs) were gen-erously provided by Dr. Lim (Ajou University, South Korea) (20). Confluent cells were evenly transferred into two new dishes, and the cells were cultured until getting confluent again to generate one population doubling. The numbers of popula-tion doublings (PD, number) as well as the doubling time (DT, days) were continuously counted. Young and old cells used in the present experiments were defined as the HDF with a dou-bling time of around 24 h and⬎1 week, respectively.
To evaluate cellular growth rate, cells were harvested by trypsinization and counted with a hemocytometer after stain-ing with 0.4% (w/v) trypan blue (Invitrogen) to exclude dead cells. No significant dead cells were observed during both stress-induced and replicative senescence. The total cell num-ber of trypan blue-negative live cells was obtained upon com-pletion of the experiments.
Estimation and Visualization of Subcellular Organellar Mass— To estimate cellular organellar mass, cells were stained with organelle-specific fluorescence dyes according to the manu-facturer’s instruction. Briefly, proper concentrations and incubation times for each organelle were first determined. Mitotracker Red CMXRos (100 nM, M7512; Molecular Probes), Lyso Tracker Green DND-26 (1M, L7526; Molecular Probes),
and ER Tracker Blue-White DPX (1M, E-12353; Molecular
Probes) were applied for 30 min at 37 °C. Especially to stain the Golgi body, cells were incubated for 30 min at 4 °C with 5M
BODIPY C5-ceramide (D3521; Molecular Probes) after pre-conjugating the dye with BSA and further incubated in fresh medium at 37 °C for 30 min. After staining cells with the dyes, cells were harvested in phosphate-buffered saline (PBS), and their fluorescence intensities were analyzed by flow cytometry (FACSCantoTM II; Becton Dickinson Corp.). Subcellular or-ganellar masses were represented as mean values of an arbitrary fluorescence unit of 10,000 cells.
To confirm specific staining of subcellular organelles with the dyes, fluorescence images of the stained cells were visual-ized by Axiovert 200M with a cooled AxioCam HRm operated by the Axiovision 4.8 software (Carl Zeiss AG, Gottingen, Ger-many). Nuclear membrane mass was represented by nucleus area (square micrometers) measured from the nuclear fluores-cence images of the Hoechst 33258-stained cells. Cytoplasmic membrane mass was represented by cell area (square microme-ters) measured from phase contrast images of the cells. The nuclear or cytoplasmic area was calculated automatically by Axiovision 4.8 software (Carl Zeiss AG).
Determination of Intracellular ROS, and Cell Size and Granularity—To estimate intracellular ROS level, cells were stained with 10M2⬘,7⬘-dichlorodihydrofluorescein diacetate
(DCFH-DA; Molecular Probes) for 15 min at 37 °C before per-forming flow cytometric analysis with FACSCantoTMII. Cell size and granularity were evaluated by analyzing forward scat-ter (FSC) and side scatscat-ter (SSC) of the stained cells, respectively, as described previously (3).
Thin Layer Chromatographic Analysis of Cellular Lipids—To analyze cellular lipid profiles, cellular lipids were extracted as described by Folch et al. (22) with slight modification. Briefly, the indicated numbers of cells were harvested into glass tubes and mixed with 1 ml of chloroform:methanol (2:1). After vor-texing, H2O (500l) was added into the tubes and centrifuged at 1,500 rpm for 15 min. The lower chloroform phase was col-lected and backwashed by adding methanol (300l) and H2O (300l). After removing the top layer, chloroform phases were concentrated by evaporating chloroform under N2 gas and loaded onto a TLC plate (1.05721.0001, 20⫻ 20, silica-coated; Merck). To separate the cellular lipids, we used the Kupke and Zeugner method (23) with a slight modification. Briefly, the chromatogram was first developed in a saturated chamber with
at Ewha Medical Library on October 24, 2016
http://www.jbc.org/
solvent I (chloroform:methanol:H2O⫽ 65:30:5) to allow polar lipids to be separated. The solvent front was allowed to migrate ⬃10 cm from the bottom of the plate. After evaporating the solvents, the nonpolar lipids were separated by developing the chromatogram with solvent II (n-hexane:diethyl ether:acetic acid⫽ 80:20:1.5) up to 1 cm from the top of the plate. The plates were dried under a stream of air and sprayed with primulin (Sigma) solution (50 g/ml in acetone:water (80:20)). The plates were dried again, and fluorescent lipid spots were scanned on a UV transilluminator (SL-20; Seoulin Scientific Co., Seoul, Korea) equipped with a camera (PC1210; Canon Inc., Japan). The densities of lipid spots were estimated by using Gel-Pro Analyzer 4.0 software (Media Cybernetics, Silver Spring, MD). Standard lipids were obtained from Sigma as follows: cholesteryl palmitate (C6072), palmitate (P5586), cholesterol (C8667), cardiolipin (C0563), 1,2-diacyl-sn-glyc-ero-3-phosphatidylserine (P7769), L-
␣-lysophosphatidylcho-line (L4129), and 3-sn-lysophosphatidylethanolamine (L4754).
Western Blot Analysis and Antibodies—Cells were washed twice with PBS and lysed with lysis buffer (50 mMTris-Cl, pH
7.5, 0.1MNaCl, 1 mMEDTA, 1% (v/v) Triton X-100, 10g/ml each aprotinin and leupeptin, and 1 mMPMSF). A portion (30
g) of the lysate was applied to Western blot analysis as described previously (7). Antibodies against SREBP-1 (catalog 557036) and SREBP-2 (catalog 557037) were purchased from BD Biosciences, and antibody for␣-tubulin (Ab-1) was from Oncogene (Boston, MA). Antibodies against FAS, ACC, and ACL were kindly provided by Prof. Kyung-Sup Kim (Yonsei University, Seoul, Korea). The expression level of each protein was estimated by comparing the band intensities exposed on x-ray film by using Gel-Pro Analyzer 4.0 software.
Preparation and Infection of Recombinant Adenovirus of Mature Form of SREBP-1—The recombinant mature SREBP-1 adenovirus (ad-mSREBP-1) was prepared as described previ-ously (24). Briefly, the cDNA encoding rat SREBP-1 (1– 403 amino acids, a mature form) was cloned into pAd-YC2 shuttle vector. For homologous recombination, pAd-YC2 shuttle vec-tor (5g) and a rescue vector, pJM17 (5 g), were cotransfected into human embryonic kidney 293 cells. Pure plaques were purified and propagated in 293 cells with screening by PCR for the cloned cDNA region. Then, the recombinants were ampli-fied in 293 cells and further isolated using CsCl2(Sigma). The preparations were collected and desalted, and titers were deter-mined by the measurement of plaque counts. To overexpress the mature form of SREBP-1 (mSREBP-1) with the recombi-nant adenovirus (ad-mSREBP-1), ⬃1 ⫻ 104 Chang cells or young HDFs (PD16) were seeded on 12-well plates and in-fected with ad-mSREBP-1 at the indicated titer for 12 h at 37 °C. Recombinant adenovirus of green fluorescence pro-tein (ad-GFP, NAS0039; BioService) was used as control adenovirus.
Introduction of siRNA into Cells—Oligonucleotides for SREBP1 siRNA #1 (5⬘-GGCCGAAGGCAGUGCAAGATT-3⬘),
SREBP1 siRNA #2 (5
⬘-CCGAAGGCAGUGCAAGAGATT-3⬘), ACL siRNA #1 (5⬘-CAAAAUAUGUGGAGUAGUATT-3⬘), ACL siRNA #2 (5⬘-UGAAAUGUCUUGUGUCUUATT-3⬘), and negative control siRNA (5⬘-UAGCGACUAAACACAUCAA-3⬘) were produced by Samchully Pharmaceutical Co. (Seoul,
Korea). siRNA duplexes were introduced into cells using Oli-gofectamine (Invitrogen) according to the manufacturer’s instructions.
Senescence-associated-Galactosidase (SA--galactosidase) Assay—SA--galactosidase activity was assayed at pH 6.0 as
described by Dimri et al. (25) with a slight modification. Briefly, cells were washed twice with PBS, fixed to plates by 3.5% form-aldehyde for 5 min, and then incubated overnight in freshly prepared staining solution (40 mMcitrate-phosphate buffer, pH
6.0, containing 1 mg/ml 5-bromo-4-chloro-3-indolyl--D -galactopyranoside (Sigma), 5 mMpotassium ferrocyanide, 5 mM
potassium ferricyanide, 150 mMNaCl, and 2 mMMgCl2). The stain was visible 12 h after incubation at 37 °C. By counting the numbers of the blue and total cells using ImageJ software (National Institutes of Health), the percentage of the SA- -galactosidase-positive cells was obtained to estimate the degree of senescence-associated cells.
RESULTS
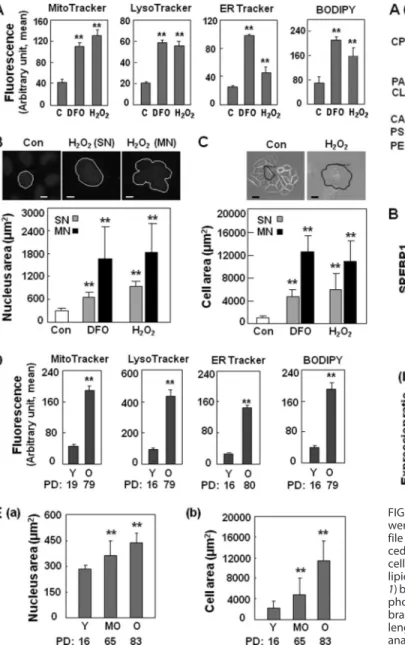
Overall Mass Increases in Membranous Subcellular Organ-elles of Senescent Cells—First, we examined changes in mass of all cellular organelles, especially membranous ones, in stress-induced senescence triggered by DFO and H2O2as described previously (7, 26, 27). Subcellular organelles were stained with organelle-specific fluorescent dyes, and their masses were esti-mated by flow cytometric analysis (Fig. 1A) after confirming their specificities by visualizing with fluorescence microscopy (supplemental Fig. S1). Unexpectedly, increased organelle mass was observed not only in lysosomes and mitochondria, but also in other organelles, such as the endoplasmic reticulum and Golgi. Whether the number of organelles was increased or whether their individual volumes enlarged without changes in number was difficult to clarify, one clear finding was that the total membranous portion of the specified organelle within a single cell was increased. In the case of the nucleus, senescent cells developed either a single giant nucleus or highly conju-gated multinuclei. To estimate the membranous portion of the nucleus, we measured its single-sectioned area after staining with Hoechst 33258. Regardless of the morphological diversity, the nuclear area of most senescent cells was significantly increased compared with control cells, suggesting a marked increase in nuclear membrane (Fig. 1B). Increased cytoplasmic membrane was also identified using an analogous approach (Fig. 1C). Moreover, similar results of overall mass increases in membranous organelles were obtained during the replica-tive senescence of primary HDFs, which is the best repre-sentative model of cell senescence (Fig. 1, D and E). These results indicate that the mass of all subcellular membranous organelles is commonly increased in senescence, contribut-ing to the increase in cell mass. The results also suggest that membrane lipids, major components of the organelles, may increase for this phenomenon.
Increase in Membrane Lipid Content and Lipogenesis in Se-nescence—Biological membranes are complex structures with up to 70% of their composition being membrane lipids. To measure membrane lipid content, total cellular lipids were extracted and separated by TLC (Fig. 2Aa). Total lipids (sum of the lipids indicated as 1–5 in Fig. 2A) increased roughly 3-fold
at Ewha Medical Library on October 24, 2016
http://www.jbc.org/
at 2 days and 4-fold at 3 days after exposure to DFO. Potential membrane lipids (sum of the lipids indicated as 2–5 in Fig. 2A) positioned with similar retardation as the standard membrane lipids, such as phosphatidylethanolamine, phosphatidylserine, cardiolipin, and cholesterol, amounted to⬃89% of the total lipids in control cells and obviously increased to 95.5% in DFO-induced senescent cells, whereas the potential storage lipid (indicated as 1 in Fig. 2Aa) with retardation similar to that
chol-esteryl palmitate decreased (Fig. 2Ab). Increases in total lipid content and the membrane lipid portion were also observed in H2O2-induced senescent cells (supplemental Fig. S2A).
Un-doubtedly, old HDFs were found to have increased total lipids (2.4-fold) and an increased portion of membrane lipids (96.11% in young, 98.4% in old; Fig. 3A). These results indicate that an increase in cellular lipids, especially membrane lipids, can also be recognized as a common characteristic of senescence, sup-porting the increase in organellar mass.
Next, we investigated whether the increase in membrane lip-ids results from the activation of lipid biosynthesis. We moni-tored the expression level of the mature form of SREBP-1, which is known to be a master regulator of the transcription of diverse lipogenic enzymes (28). As expected, the active mature form of SREBP-1 was clearly increased in DFO-induced senes-cence (Fig. 2B). The protein levels of SREBP-1 target enzymes FAS, ACC, and ACL were also monitored. When the enzyme levels were normalized to tubulin, they reached a maximum at 24 h (Fig. 2Bb) and then slightly decreased, which does not
FIGURE 1. Overall increases of membranous subcellular organelles in cell
senescence. A–C, Chang cells were treated with 200MDFO or H2O2for 3
days. A, subcellular organellar masses were estimated by comparing the fluorescence intensities with flow cytometry after staining cells with organelle-specific dyes as described under “Experimental Procedures.” ER, endoplasmic reticulum. B, nuclear membrane mass of a cell was represented by single-sectioned area (square micrometers) of nucleus of each cell. Upper
panels are the representative images for both single giant nucleus (SN) and
multinuclei (MN) of H2O2-treated single senescent cell. Scale bar, 5M. C, cellular cytoplasmic membrane mass was represented by single-sectioned
area (square micrometers) of each cell. Upper panels are representative cell phase images of H2O2-treated senescent cell. Scale bar, 10M. D, subcellular
organellar masses of young (Y, PD 16 or 19) and old (O, PD 79 or 80) HDFs.
E, nuclear membrane mass (a) and cytoplasmic membrane mass (b) of young
(PD 16), mid-old (MO, PD 65) and old (PD 83) HDFs were also estimated as described in B. **p⬍ 0.01. Error bars, S.D.
FIGURE 2. Increased lipogenesis in DFO-induced senescence. Chang cells were treated with 200MDFO for the indicated periods. A, cellular lipid pro-file of senescent cells obtained by TLC as described under “Experimental Pro-cedures.” Representative TLC image (a) and quantitative estimation (b) of cellular lipids extracted from different numbers of cells are shown. Standard lipid mixture (Std) containing 10g each was used. Cholesteryl palmitate (CP,
1) belongs to nonpolar storage lipid, and cholesterol (CL, 2), cardiolipin (CA, 3),
phosphatidylcholine (PC, 4) and phosphatidylserine (PS, 5) belong to mem-brane lipids. d in the x axis stands for day. B, Western blot for SREBP-1. Full-length and mature forms of SREBP-1 are indicated by arrows. Ca, Western blot analyses for lipogenic enzymes. Expression ratios of ACC (f), ACL (Œ), and FAS (⽧) to tubulin (b) or lamin (c) are shown.
at Ewha Medical Library on October 24, 2016
http://www.jbc.org/
correlate with the pattern of total cellular lipid content. We confirmed that the increase in cytoplasmic proteins is much greater than the increase in nuclear proteins (data not shown), although nuclear mass also increases (Fig. 1B) during cell senes-cence, implying that overall cytoplasmic mass is the combined result of all of the other cytoplasmic organelles except the nucleus. Therefore, we normalized the enzyme expression lev-els to lamin (nuclear protein) to represent the protein level per cell because cellular lipid contents were analyzed based on cell number. In this case, progressive and dramatic increases in the lipogenic enzymes were clearly observed (Fig. 2Bc). Similar results were obtained with H2O2-induced senescence (supplemental Fig. S2C). This increased expression of lipogenic enzymes and the active form of their master key regulator, SREBP-1c, was further observed in replicative senescence (Fig. 3, B and C) and the aging F344 rat model (Fig. 4), even when normalized to tubulin. Taken together, these results suggest that enhanced lipogenesis via SREBP-1 activation may contrib-ute to the increased cellular lipids of senescence and aging.
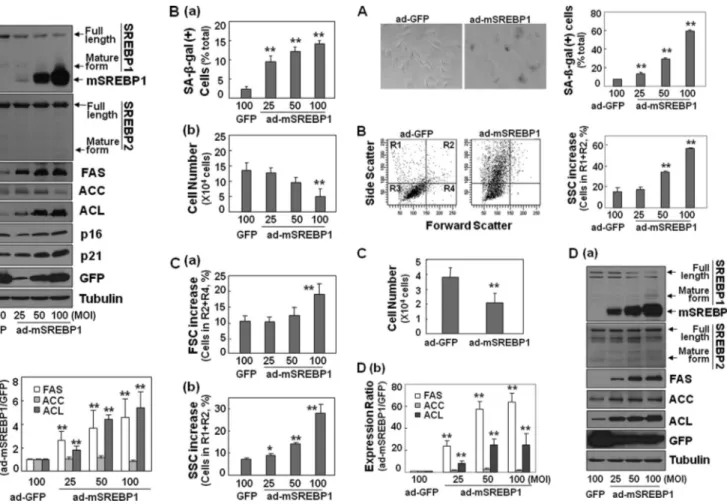
Enhanced Lipogenesis Is Enough to Induce Cellular Senes-cence—To determine whether enhanced lipogenesis is genu-inely involved in the development of cell senescence, we exam-ined the effect of enhanced lipogenesis using the ectopic expression of active SREBP-1. We introduced adenovirus har-boring the N-terminal fragment (mature form) of rat SREBP-1 into Chang cells. As shown in Fig. 5A, overexpressed mature SREBP-1 (mSREBP-1) was sufficient to increase the expression of FAS and ACL without affecting endogenous SREBP-1 or SREBP-2 expression. mRNA levels of all of the lipogenic enzymes (FAS, ACC, and ACL) were significantly induced by mSREBP-1 at the transcriptional level, implying its
transcrip-tional activation (supplemental Fig. S4A). This finding implies that mSREBP-1 overexpression can effectively enhance cellular lipogenesis in a cell culture system. Excitedly, this enhanced lipogenesis by mSREBP-1 overexpression alone clearly induced senescence, as shown by an increase in SA--galactosidase activity, arrest of cellular growth, increased cell granularity rep-resented by SSC, and increased cell size reprep-resented by FSC (Fig. 5, B and C). The induction of senescence was further con-firmed by the induction of the p21 and p16 proteins, the inhib-itory cell cycle regulators (Fig. 5A). Similar and more remarka-ble results by overexpressing SREBP-1 on gain of senescence phenotypes, including SA--galactosidase, granularity (SSC), and delayed cell growth in addition to induction of lipogenic enzymes were obtained in young HDFs (Fig. 6 and sup-plemental Fig. S4B). These data provide strong evidence that enhanced lipogenesis, at least by SREBP-1 activation, is suffi-cient for inducing senescence.
Blocking Lipogenesis Significantly Attenuates Cell Senes-cence—Next, we investigated the effect of blocking lipogenesis on H2O2-induced senescence using siRNA-mediated
knock-down of SREBP-1 or ACL expression and pharmacological FAS inhibitors. SREBP-1 knockdown effectively attenuated all senescence phenotypes induced by H2O2 (Fig. 7, A and B).
Attenuation of the senescence phenotypes correlated well with intracellular ROS levels, suggesting that the enhanced lipogen-esis may be tightly linked to cellular oxidative stress (Fig. 7Bd). The H2O2-induced senescence was also diminished by
siRNA-mediated ACL knockdown or FAS-specific inhibitors cerulenin and C75 (29, 30) as shown in Fig. 7, C and D.
Finally, we investigated whether the inhibition of lipogenesis can reverse senescent phenotypes of old HDFs, which are devel-oped spontaneously by a series of cell passage rather than by any
FIGURE 3. Increased lipogenesis in old HDFs. A, cellular lipid profiles of young (PD 15, DT 2) and old (PD 82, DT 9) HDFs were compared by TLC as described under “Experimental Procedures” and Fig. 2A. Quantitative estima-tion of TLC analysis of cellular lipids shown insupplemental Fig. S3is ana-lyzed. Numbers in the graph stands for the lipid spots on TLC as explained in Fig. 2A. B and C, young (Y; PD 15, DT 2) and old (O; PD 82, DT 9) HDFs were cultured and applied to Western blot analysis for SREBP-1 (B) and lipogenic enzymes (Ca). Quantitative comparison of the expression levels of the
lipo-genic enzymes shown in Cb. *, p⬍ 0.05; error bars, S.D.
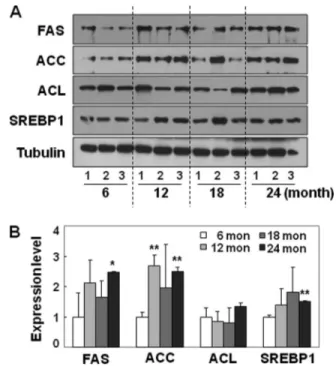
FIGURE 4. Increased lipogenic enzymes and SREBP1 in aging F344 rats. Liver tissues of the aging process of F344 rats (three individuals for each age) were applied to Western blot analysis. A, Western blot analysis for lipogenic enzymes and SREBP1. B, expression levels compared. **, p⬍ 0.01 versus 6-month-old rat livers; error bars, S.D.
at Ewha Medical Library on October 24, 2016
http://www.jbc.org/
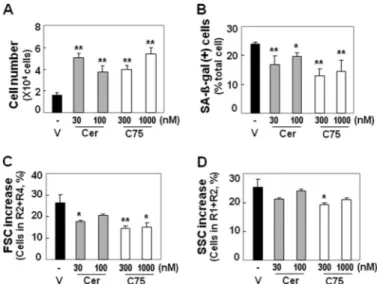
exogenous insult, to young-like phenotypes. For this purpose, we first determined optimal concentrations of FAS inhibitors (data not shown). Surprisingly, most senescent phenotypes of old HDFs were effectively reversed by repeatedly exposing the cells to a determined concentration of FAS inhibitors (cerule-nin and C75), although the effect on cell granularity (estimated by SSC) was minor (Fig. 8). Higher concentrations of FAS inhibitors were toxic to cells, and single treatment of the low dose was not enough to display the inhibitory effects (data not shown). These data imply that lipogenesis is importantly involved in cellular senescence, and pharmacologically block-ing of lipogenesis at fatty acid synthesis is an effective approach for attenuating cellular senescence.
DISCUSSION
Increases in cell mass during senescence and the aging proc-ess have often been documented (3). Although the detailed components of the mass have not been clearly understood, increasing numbers of reports on the mass of lysosomes and
mitochondria in senescence indicate that particular organelles seem to be associated with the mass of the senescent cell (3–5, 7–9). However, in the present study, we emphasize that, rather than certain organelles, all cellular organelles, particu-larly membranous organelles, increase during the development of cell senescence, as shown in both stress-induced and repli-cative senescence. These organellar mass increases correspond well with the increase in membrane lipid content and induction of lipogenic enzymes (FAS, ACC, and ACL) and SREBP-1. This finding implies that enhanced lipogenesis may contribute to the overall organelle increase in cell senescence. Therefore, in pref-erence to investigating the changes or importance of individual organelles, we focused here on exploring the involvement of lipogenesis in the development of senescence. Indeed, enhanc-ing lipogenesis by overexpressenhanc-ing mature SREBP-1 was enough to induce senescent phenotypes in both immortalized Chang cells and primary HDFs. Furthermore, blocking lipogenesis using siRNA-mediated knockdown of SREBP-1 or ACL signif-icantly attenuated H2O2-induced senescence. More interest-ingly, the inhibition of lipogenesis by FAS-specific inhibitors reversed the senescent phenotypes, not only of the stress-in-duced senescence, but also of replicative senescence. All of FIGURE 5. Ectopic expression of mature SREBP-1 induces senescence of
Chang cells. Chang cells were infected with recombinant adenovirus
encod-ing mature form of SREBP-1 (ad-mSREBP-1) for 4 days. Recombinant adeno-virus encoding GFP (ad-GFP) was used as control. Aa, Western blot analysis of lipogenesis and senescence-related proteins. Ab, quantitative analysis of the expression levels of lipogenic enzymes. Recombinant mSREBP-1 migrates faster than mature form of endogenous human SREBP-1. Ba, analysis of SA--galactosidase-positive cell population. Bb, cell growth rates compared by counting trypan blue-negative live cells. Dead cells were hardly observed.
C, cell size (a) and cell granularity (b) analyzed by comparing FSC and SSC,
respectively. R1, R2, R3, and R4 in the y axis indicate the same window of the cell distribution by flow cytometry as designated in the left panel of Fig. 6B. *,
p⬍ 0.05; **, p ⬍ 0.01 versus ad-GFP.
FIGURE 6. Ectopic expression of mature SREBP-1 induces senescence of
young HDFs. HDFs (PD 24, DT 2) were infected with ad-GFP or ad-mSREBP-1
for 4 days. A, SA--galactosidase activities were monitored. Representative images (left) and SA--galactosidase-positive cell populations (right) are shown. B, flow cytometric analysis of the cell distribution. Representative pro-files (left) and cell granularity (SSC analysis, right) are shown. C, cell growth rates. D, Western blot analysis (a) and quantitative analysis (b) of lipogenic enzyme expressions.
at Ewha Medical Library on October 24, 2016
http://www.jbc.org/
these results demonstrate that enhanced lipogenesis is crit-ically involved in the senescence process, possibly contrib-uting to the membranous organellar mass and, conse-quently, cell mass (Fig. 9).
The relationship between phospholipid synthesis and senes-cence or aging has been discussed in only a few reports, although reports on storage fat or oxidatively damaged lipids with aging are increasing (31–33). Inhibitors of HMG-CoA
reductase, one of the targets of SREBP, reduce cellular senes-cence (34, 35), supporting our hypothesis. However, contradic-tory results have also been reported. Maeda et al. (36) observed that de novo phospholipid synthesis declines in senescent human fibroblasts, although the formation of cholesterol was increased compared with young cells. In that same study, senes-FIGURE 7. SREBP-1 knockdown attenuates H2O2-induced senescence of
Chang cells. A–C, Chang cells (1⫻ 104) seeded on 6-well plates were
trans-fected with siRNAs for SREBP-1 and then treated with 200MH2O2for 4 days. Aa, knockdown of SREBP-1 expression was confirmed by Western blotting. Ab, SA--galactosidase activities are shown. B, cell size and cell granularity
were estimated by comparing FSC (a) and SSC (b) of cell distribution with flow cytometry, respectively. Bc, cell growth rate was compared by counting trypan blue-negative live cell. Dead cells were hardly observed. Bd, intracel-lular ROS levels were estimated by flow cytometric analysis of DCF fluores-cence after staining cells with DCFH-DA. C, Chang cells (1⫻ 104) were treated
with siRNAs for ACL and then treated with 200MH2O2for 4 days.
SA--galactosidase activities (upper panel) and Western blot analysis of ACL (lower
panel) are shown. D, Chang cells were pretreated with the indicated
concen-trations of cerulenin (Cer; Sigma C2389) or C75 (Sigma C5490) and then treated with 200MH2O2for 4 days. SA--galactosidase activities (upper panel) and Western blotting were performed. Two different siRNAs for each
protein (SREBP-1 or ACL) were used. siRNA of random sequence was used as negative control (NC) and DMSO was used as vehicle (V). ##, p⬍ 0.01 versus no H2O2. **, p⬍ 0.01 versus NC or V.
FIGURE 8. Reversal of senescent phenotypes of old HDFs by
pharmaco-logical inhibition of lipogenesis. Old HDFs (PD 73, DT 8) were treated with
the indicated concentrations of FAS inhibitors and replenished with new medium containing the inhibitors every other day for 2 weeks. A, cell growth rate was estimated by counting trypan blue-negative cells. Dead cells were hardly detected. B, SA--galactosidase activity is shown. C, cell size was esti-mated by FSC analysis with flow cytometry. D, cell granularity was estiesti-mated by SSC analysis with flow cytometry. *, p⬍ 0.05; **, p ⬍ 0.01 versus vehicle;
error bars, S.D.
FIGURE 9. Schematic diagram for involvement of lipid biosynthesis in
cellular senescence.
at Ewha Medical Library on October 24, 2016
http://www.jbc.org/
cent cells developed only after the 25th passage of cell culture, whereas the young HDFs obtained from a 4-year-old boy in our study reached senescence after 75 doublings, implying that the reported cell condition was somewhat different from ours. We also observed that cells in the later stage of senescence (just before reaching cell death) contain much lower levels of lipo-genic activity than well developed senescent cells, with maxi-mum SA--galactosidase activity in both stress-induced and replicative senescence (data not shown). Interestingly, in-creased expression of lipogenesis-associated proteins was fur-ther found in the aging F344 rats, presenting the potential involvement of lipogenesis in the aging process. All of these reports and findings further support our hypothesis of the important contribution of enhanced lipogenesis to senescence and aging.
All mammalian cells require the biosynthesis of membrane lipids for the duplication of membranous organelles undergo-ing cell division. Therefore, further activation of lipogenesis is expected in cancer development, in which the strength of cell growth and proliferation is increased. Indeed, an increasing number of studies on the importance of lipogenesis in carcino-genesis have been reported, and lipid synthesis is regarded as a new target for the development of cancer therapeutics (37–39). However, in terms of cell proliferation, cancer development is the opposite situation to senescence. Therefore, the question of why enhanced lipogenesis leads cells to senescence and not to cell proliferation is important. When we overexpressed mature SREBP-1 protein, we clearly observed p21 and p16 proteins, the negative cell cycle regulators, in addition to the increased expression of lipogenic enzymes. Although protein induction of ACC, the rate-limiting enzyme of fatty acid synthesis, by SREBP-1 was minor, overall flow of fatty acid synthesis may be enhanced by modulation of substrate (acetyl-CoA) and product (malonyl-CoA) levels via the increased ACC and FAS proteins. In addition, the result of the inhibitory cell cycle regulators corresponds well to the previous report that mature SREBP-1 causes cell cycle arrest through the induction of the cyclin-de-pendent kinase inhibitors, such as p21, p27, and p16 (40, 41). Therefore, enhanced lipogenesis via SREBP-1 activation alone may act as an inducer of senescence. In other words, cancer cells should acquire any additional strategy to suppress the action of the cyclin-dependent kinase inhibitors that may be induced by SREBP-1 to use the lipogenic power for cell proliferation.
The questions then are why the senescent cells need an increased organellar mass and whether the organelles are func-tional. The simple explanations previously applied to lysosomes and mitochondria are possibly applicable to these questions. Senescent cells regenerate organelles to compensate for the nonfunctional organelles damaged by senescence-associated ROS as a defensive response, but the organelles that are sup-posed to remove the damaged organelles (components), such as lysosomes and proteasomes, have also lost their function, resulting in an accumulation of nonfunctional organelles (14, 42, 43). The worse scenario is that even newly synthesized organelles may be nonfunctional due to an oxidatively stressed cellular environment, aggravating or maintaining senescence. However, in question is what happens to the newly generated
organelles in the senescence induced by overexpressed mSREBP-1 protein alone, in which no additional stress exists. So far, whether the organelles have normal function, structure, and well balanced composition, including membrane lipids and proteins, is not clear. Interestingly, knocking down SREBP-1 reduced the senescent intracellular ROS level, implying that lipogenesis is probably linked to oxidative stress. Therefore, we can hypothesize that enhancement of lipid biosynthesis alone, without supporting other components (for example, proteins) for organelles, may act as a stress by forming only lipid-en-riched nonfunctional organelles. For example, in lipid-enlipid-en-riched mitochondria, respiratory complexes may be dispersed, making their electron transfer reaction defective and increasing ROS generation. However, a detailed understanding of the func-tional and composifunc-tional status of individual organelles in senescence remains unexplored.
SREBP-1 is known to regulate the supply of membrane lipids in response to cell growth and is highly expressed in cells that are actively growing (44). However, SREBP-1-expressing livers of transgenic mice exhibit impaired regeneration after partial hepatectomy (41), indirectly supporting our results that mSREBP-1 overexpression sufficiently induces senescence-as-sociated growth arrest. We also showed that knocking down the up-regulated SREBP-1 in the stress-induced senescent cells effectively attenuated the senescence phenotypes, indicating the potential role of SREBP-1 as a novel effective target for modulating senescence. However, we also observed that knock-ing down SREBP-1 below the level of control cells by usknock-ing high dose siRNA also induced growth arrest (data not shown), sug-gesting that the well balanced regulation of lipogenesis is required to maintain normal cellular function, and the fine con-trol of SREBP-1 activation is essential to concon-trol senescence. In addition, our previous study proved that glycogen synthase kinase 3 (GSK3) is commonly inactivated by being phosphory-lated and is also importantly involved in all the cell senescence systems (DFO- and H2O2-induced, and replicative senescence) employed in this study (27). GSK3 is known to modulate SREBP1 activity through phosphorylation-mediated ubiquiti-nation (21). Therefore, it is suggested that GSK3 may play a critical role in activating SREBP-1 as an upstream modulator in senescence induced by stresses. A detailed link between GSK3 and SREBP-1 in senescence is under investigation. Collectively, our results provide new insight into the metabolic background of cellular senescence and indicate SREBP-1-induced lipogen-esis as a potentially effective novel target for senescence and aging-related diseases.
Acknowledgment—We thank the Aging Tissue Bank (Pusan, Korea) for supplying the aged tissues.
REFERENCES
1. Cristofalo, V. J., and Kritchevsky, D. (1969) Med. Exp. Int. J. Exp. Med. 19, 313–320
2. Greenberg, S. B., Grove, G. L., and Cristofalo, V. J. (1977) In Vitro 13, 297–300
3. Hwang, E. S., Yoon, G., and Kang, H. T. (2009) Cell. Mol. Life Sci. 66, 2503–2524
4. Lipetz, J., and Cristofalo, V. J. (1972) J. Ultrastruct. Res. 39, 43–56
at Ewha Medical Library on October 24, 2016
http://www.jbc.org/
5. De Priester, W., Van Manen, R., and Knook, D. L. (1984) Mech. Ageing Dev.
26,205–216
6. Schmucker, D. L., and Sachs, H. (2002) Arch. Gerontol. Geriatr. 34, 249 –261
7. Yoon, Y. S., Yoon, D. S., Lim, I. K., Yoon, S. H., Chung, H. Y., Rojo, M., Malka, F., Jou, M. J., Martinou, J. C., and Yoon, G. (2006) J. Cell. Physiol.
209,468 – 480
8. Lee, H. C., Yin, P. H., Chi, C. W., and Wei, Y. H. (2002) J. Biomed. Sci. 9, 517–526
9. Passos, J. F., Saretzki, G., Ahmed, S., Nelson, G., Richter, T., Peters, H., Wappler, I., Birket, M. J., Harold, G., Schaeuble, K., Birch-Machin, M. A., Kirkwood, T. B., and von Zglinicki, T. (2007) PLoS Biol. 5, e110 10. Lee, H. C., Lu, C. Y., Fahn, H. J., and Wei, Y. H. (1998) FEBS Lett. 441,
292–296
11. Wei, Y. H., Lee, C. F., Lee, H. C., Ma, Y. S., Wang, C. W., Lu, C. Y., and Pang, C. Y. (2001) Ann. N.Y. Acad. Sci. 928, 97–112
12. Boffoli, D., Scacco, S. C., Vergari, R., Solarino, G., Santacroce, G., and Papa, S. (1994) Biochim. Biophys. Acta 1226, 73– 82
13. Kurz, T., Terman, A., Gustafsson, B., and Brunk, U. T. (2008) Biochim.
Biophys. Acta 1780,1291–1303
14. Terman, A., Kurz, T., Navratil, M., Arriaga, E. A., and Brunk, U. T. (2010)
Antioxid. Redox Signal. 12,503–535
15. Porstmann, T., Santos, C. R., Lewis, C., Griffiths, B., and Schulze, A. (2009)
Biochem. Soc. Trans. 37,278 –283
16. Demoulin, J. B., Ericsson, J., Kallin, A., Rorsman, C., Ro¨nnstrand, L., and Heldin, C. H. (2004) J. Biol. Chem. 279, 35392–35402
17. Horton, J. D., Shah, N. A., Warrington, J. A., Anderson, N. N., Park, S. W., Brown, M. S., and Goldstein, J. L. (2003) Proc. Natl. Acad. Sci. U.S.A. 100, 12027–12032
18. Horton, J. D., Goldstein, J. L., and Brown, M. S. (2002) J. Clin. Invest. 109, 1125–1131
19. Shimano, H. (2001) Prog. Lipid Res. 40, 439 – 452
20. Kim, H. S., Song, M. C., Kwak, I. H., Park, T. J., and Lim, I. K. (2003) J. Biol.
Chem. 278,37497–37510
21. Punga, T., Bengoechea-Alonso, M. T., and Ericsson, J. (2006) J. Biol. Chem.
281,25278 –25286
22. Folch, J., Lees, M., and Sloane Stanley, G. H. (1957) J. Biol. Chem. 226, 497–509
23. Kupke, I. R., and Zeugner, S. (1978) J. Chromatogr. 146, 261–271 24. Kim, K. H., Song, M. J., Yoo, E. J., Choe, S. S., Park, S. D., and Kim, J. B.
(2004) J. Biol. Chem. 279, 51999 –52006
25. Dimri, G. P., Lee, X., Basile, G., Acosta, M., Scott, G., Roskelley, C., Me-drano, E. E., Linskens, M., Rubelj, I., and Pereira-Smith, O. (1995) Proc.
Natl. Acad. Sci. U.S.A. 92,9363–9367
26. Yoon, G., Kim, H. J., Yoon, Y. S., Cho, H., Lim, I. K., and Lee, J. H. (2002)
Biochem. J. 366,613– 621
27. Seo, Y. H., Jung, H. J., Shin, H. T., Kim, Y. M., Yim, H., Chung, H. Y., Lim, I. K., and Yoon, G. (2008) Aging Cell 7, 894 –907
28. Laplante, M., and Sabatini, D. M. (2009) Curr. Biol. 19, R1046 –R1052 29. Omura, S. (1976) Bacteriol. Rev. 40, 681– 697
30. Pizer, E. S., Chrest, F. J., DiGiuseppe, J. A., and Han, W. F. (1998) Cancer
Res. 58,4611– 4615
31. Slawik, M., and Vidal-Puig, A. J. (2006) Ageing Res. Rev. 5, 144 –164 32. Tahara, S., Matsuo, M., and Kaneko, T. (2001) Mech. Ageing Dev. 122,
415– 426
33. Wang, M. C., O’Rourke, E. J., and Ruvkun, G. (2008) Science 322, 957–960 34. Assmus, B., Urbich, C., Aicher, A., Hofmann, W. K., Haendeler, J., Ro¨ssig, L., Spyridopoulos, I., Zeiher, A. M., and Dimmeler, S. (2003) Circ. Res. 92, 1049 –1055
35. Horton, J. D., Shimomura, I., Brown, M. S., Hammer, R. E., Goldstein, J. L., and Shimano, H. (1998) J. Clin. Invest. 101, 2331–2339
36. Maeda, M., Scaglia, N., and Igal, R. A. (2009) Life Sci. 84, 119 –124 37. Bauer, D. E., Hatzivassiliou, G., Zhao, F., Andreadis, C., and Thompson,
C. B. (2005) Oncogene 24, 6314 – 6322
38. Hatzivassiliou, G., Zhao, F., Bauer, D. E., Andreadis, C., Shaw, A. N., Dhanak, D., Hingorani, S. R., Tuveson, D. A., and Thompson, C. B. (2005)
Cancer Cell 8,311–321
39. Furuta, E., Okuda, H., Kobayashi, A., and Watabe, K. (2010) Biochim.
Biophys. Acta 1805,141–152
40. Inoue, N., Shimano, H., Nakakuki, M., Matsuzaka, T., Nakagawa, Y., Yamamoto, T., Sato, R., Takahashi, A., Sone, H., Yahagi, N., Suzuki, H., Toyoshima, H., and Yamada, N. (2005) Mol. Cell. Biol. 25, 8938 – 8947 41. Nakakuki, M., Shimano, H., Inoue, N., Tamura, M., Matsuzaka, T.,
Naka-gawa, Y., Yahagi, N., Toyoshima, H., Sato, R., and Yamada, N. (2007) FEBS
J. 274,4440 – 4452
42. Chondrogianni, N., Fragoulis, E. G., and Gonos, E. S. (2002) Biogerontology
3,121–123
43. Chondrogianni, N., and Gonos, E. S. (2004) Biogerontology 5, 55– 61 44. Shimomura, I., Shimano, H., Horton, J. D., Goldstein, J. L., and Brown,
M. S. (1997) J. Clin. Invest. 99, 838 – 845
at Ewha Medical Library on October 24, 2016
http://www.jbc.org/
DFO
H O
C
A
acker
XRos
DFO
H
2O
2Con
Mean value Mean value Mean value
MitoT
ra
Red CM
B
44.1
110.6
131.0
racker
D
ND-26
C
Lyso T
r
Green
D
Tracker
e-White
D
B
ODIPY
-Ceramide
ER
T
Blu
e
B
C
5-lar lipids
c
ontrol)
200
300
S
REBP1
Full
length
Mature
form
*
A
B
5
4
Cellu
(%
c
100
H
2O
2: C 3d
0
H
C 1 2 3 (d)
2O
2:
Tubulin
S
form
1
3
2
FAS
ACC
o
n ratio
tubulin)
C
(a)
(b)
10
15
20
C
6
12
24 48 (h)
ACL
Tubulin
Lamin
Expressi
o
(Enzy
m
es/
C
6
12 24 48 (h)
(c)
0
5
10
H
2O
2C 6 12 24 48 (h)
x
pression ratio
E
nzy
m
es/lamin)
20
40
60
80
C
6
12 24 48 (h)
E
x
(E
0
A
1
2
3
PA
CL
CP
A
HDF :
5 10 20 40 5 10 20 40 (x10
4cells)
PD 15
PD 82
Std PS PC
3
4
5
CA
PE
HDF : PD 15
PD 82
Chang
Lamin
FAS
Lamin
ACC
A
e
xpression
2
3
4
5
FAS
ACC
ACL
**
**
**
**
**
**
**
**
ACC
ACL
Lamin
100 25 50 100 (MOI)
100 25 50 100 (MOI)
ad-GFP ad-mSREBP1
mRNA
e
GFP ad-mSREBP1
0
1
2
**
**
HDF
Lamin
FAS
B
ression
FAS
ACC
ACL
6
8
**
**
**
Lamin
ACC
100 25 50 100 (MOI)
ACL
Lamin
100 25 50 100 (MOI)
mRNA
exp
r
ad-GFP ad-mSREBP1
ACL
0
2
4
**
**
**
*
*
100 25 50 100 (MOI)
GFP ad-mSREBP1
Supplementary Fig. S1. Representative fluorescence images for subcellular organelles of
stress-induced senescent Chang cells. Chang cells were exposed to 200 µM DFO or H
2O
2for 3 days. A.
Fluorescence images (upper panel), phase images (middle) and flow cytometric analysis (lower panel)
of Mitostained cells. Fluorescence images of Lysostained cells (B), ER
Tracker-stained cells (C) and BODIPY C
5-Ceramide-stained cells (D) are presented.
Supplementary Fig. S2. Increased lipogenesis in H
2O
2-induced senescent Chang cells. Chang cells
were exposed to 200 µM H
2O
2for 3 days. A. Cellular lipid profile of senescent cells was obtained by
TLC as described in Experimental procedures. Quantitative estimation of cellular lipids is shown.
Cholesteryl palmitate (CP, 1) belongs to non-polar storage lipid, and cholesterol (CL, 2), cardiolipin
(CA, 3), phosphatidyl choline (PC, 4) and phosphatidyl serine (PS, 5) belong to membrane lipids. ‘d’
in the x-axis stands for day. B. Western blot for SREBP-1. Full length and mature form of SREBP1
were indicated by arrows. * is unidentified non-specific proteins. C. Western blot analyses for
lipogenic enzymes (a). Expression ratios of ACC (■), ACL (▲), and FAS (◆) to tubulin (b) or lamin
(c) are shown.
Supplementary Fig. S3. Representative TLC image for cellular lipid profiles of young and old HDFs.
Cellular lipid profiles of young (PD 15, DT 2) and old (PD 82; DT 9) HDFs were compared by TLC
as described in Experimental procedures and figure 2A.
Supplementary Fig. S4. Ectopic expression of mature SREBP-1 induces mRNAs of lipogenic
enzymes. Chang cells or young HDFs (PD 24, DT 2) were infected with recombinant adenovirus
encoding mature form of SREBP-1 (ad-mSREBP1) for 4 days. Recombinant adenovirus encoding
GFP (ad-GFP) was used as control. Total RNA was isolated using Trizol (Invitrogen) and cDNA was
prepared using avian myeloblastosis virus reverse transcriptase (Promega, Madison, WI, USA). PCR
involved 25-30 cycles of 94°C for 30 seconds, 52–55°C for 30 seconds, and 72°C for 60 seconds.
Oligonucleotide primers were produced by Bioneer (Seoul, Korea). The PCR primer sequences were:
5’-CCTCAACTATGCTAAGAAGGAATC-3’ and 5’-TTGGCATGGTAAGTCTGCTC-3’ for lamin;
TCAACCCAGATTCACTCCGAG-3’ and ATGGCCTGGTAGGCGTTC-3’ for FAS;
CACGCTCAAGTCACCAAGAA-3’ and CTGCAG GTTCTCAATGCAAA-3’ for ACC;
5’-ATCTCCGGCCTCTTCAATTT-3’ and 5’-GGTTCAGCAAGGTCAGCTTC-3’ for FAS. A. mRNA
levels by RT-PCR of Chang cell expressing mSREBP-1. B. mRNA levels by RT-PCR in HDFs
expressing mSREBP-1.
Lee, Dong-Hoon Hyun, Hae-Young Chung and Gyesoon Yoon
You-Mie Kim, Hyun-Taek Shin, Yong-Hak Seo, Hae-Ok Byun, Soo-Han Yoon, In-Kyu
Involved in Cell Senescence
doi: 10.1074/jbc.M110.120386 originally published online July 8, 2010 2010, 285:29069-29077.
J. Biol. Chem.
10.1074/jbc.M110.120386
Access the most updated version of this article at doi: Alerts:
When a correction for this article is posted
•
When this article is cited
•
to choose from all of JBC's e-mail alerts
Click here
Supplemental material:
http://www.jbc.org/content/suppl/2010/07/08/M110.120386.DC1.html http://www.jbc.org/content/285/38/29069.full.html#ref-list-1This article cites 44 references, 12 of which can be accessed free at
at Ewha Medical Library on October 24, 2016
http://www.jbc.org/