Korean Variant Archive (KOVA):
a reference database of genetic
variations in the Korean population
Sangmoon Lee
1, Jihae Seo
2, Jinman Park
3,4, Jae-Yong Nam
5,6, Ahyoung Choi
2,7, Jason S.
Ignatius
8, Robert D. Bjornson
9, Jong-Hee Chae
10, In-Jin Jang
11, Sanghyuk Lee
2,7, Woong-Yang
Park
5,6,12, Daehyun Baek
3,4,13& Murim Choi
1Despite efforts to interrogate human genome variation through large-scale databases, systematic preference toward populations of Caucasian descendants has resulted in unintended reduction of power in studying non-Caucasians. Here we report a compilation of coding variants from 1,055 healthy Korean individuals (KOVA; Korean Variant Archive). The samples were sequenced to a mean depth of 75x, yielding 101 singleton variants per individual. Population genetics analysis demonstrates that the Korean population is a distinct ethnic group comparable to other discrete ethnic groups in Africa and Europe, providing a rationale for such independent genomic datasets. Indeed, KOVA conferred 22.8% increased variant filtering power in addition to Exome Aggregation Consortium (ExAC) when used on Korean exomes. Functional assessment of nonsynonymous variant supported the presence of purifying selection in Koreans. Analysis of copy number variants detected 5.2 deletions and 10.3 amplifications per individual with an increased fraction of novel variants among smaller and rarer copy number variable segments. We also report a list of germline variants that are associated with increased tumor susceptibility. This catalog can function as a critical addition to the pre-existing variant databases in pursuing genetic studies of Korean individuals.
The recent population explosion and a limited purifying selection process during recent human evolutionary history caused an over-accumulation of rare variants of varying functionalities in the human genome, creating limitations in pursuing various disease genetic studies1, 2. To circumvent such limitations, large-scale databases
containing variants from normal healthy populations have been established to provide a ‘healthy genomic pro-file’, e.g., 1000 Genomes Project (1000GP), Exome Aggregation Consortium (ExAC), and UK10K3–6. However,
Caucasians comprise the majority of subjects in such databases, leaving ethnic Koreans with a world population of over 70 million underrepresented7. Although ~4,300 (7.1%) East Asian samples are included in ExAC, they are
mainly from Japan, China, and Southeast Asia. Two Japanese groups recently reported genomic profiles of the Japanese population through 1,070 whole genome sequencing (WGS) and 1,208 whole exome sequencing (WES)
1Department of Biomedical Sciences, Seoul National University College of Medicine, Seoul, 03080, Republic of Korea. 2Ewha Research Center for Systems Biology (ERCSB), Ewha Womans University, Seoul, 03760, Republic of Korea. 3Center for RNA Research, Institute for Basic Science, Seoul, 08826, Republic of Korea. 4School of Biological Sciences, Seoul National University, Seoul, 08826, Republic of Korea. 5Samsung Genome Institute, Samsung Medical Center, Seoul, 06351, Republic of Korea. 6Department of Health Sciences and Technology, Samsung Advanced Institute of Science and Heath Technology, Sungkyunkwan University, Seoul, 06351, Republic of Korea. 7Department of Bio-Information Science, Ewha Womans University, Seoul, 03760, Republic of Korea. 8Yale Center for Research Computing, Yale University, New Haven, CT, 06511, USA. 9Department of Computer Science and Yale Center for Research Computing, Yale University, New Haven, CT, 06511, USA. 10Department of Pediatrics, Seoul National University Children’s Hospital, Seoul National University College of Medicine, Seoul, 03080, Republic of Korea. 11Department of Clinical Pharmacology and Therapeutics, Seoul National University College of Medicine and Seoul National University Hospital, Seoul, 03080, Republic of Korea. 12Department of Molecular Cell Biology, Sungkyunkwan University School of Medicine, Suwon, 16419, Republic of Korea. 13Bioinformatics Institute, Seoul National University, Seoul, 08826, Republic of Korea. Sangmoon Lee, Jihae Seo, Jinman Park and Jae-Yong Nam contributed equally to this work. Correspondence and requests for materials should be addressed to D.B. (email:
baek@snu.ac.kr) or M.C. (email: murimchoi@snu.ac.kr) Received: 17 February 2017
Accepted: 17 May 2017 Published: xx xx xxxx
www.nature.com/scientificreports/
data, further characterizing the genetic architecture of the population8, 9. The lack of such a Korean database
remains as a major obstacle to genetic research and clinical diagnosis on Korean patients with genetic diseases10.
Although ambiguous, modern humans (Homo sapiens sapiens) are speculated to have first migrated into Northeast Asia approximately 40,000 years ago11. There are two proposed hypotheses explaining migration
routes to the Northeast Asia: solely through south-to-north migration from Southeast Asia, and a mixture of south-to-north migration and another through Central Asia12. Given that southern Chinese and Southeast
Asian harbor a relatively heavier enrichment of Denisovan components in their genome than northern Chinese, Northeast Asians seem to have separate origins from the Southeast Asians13. This would have also occurred about
40,000 years ago when modern humans first settled in the Korean Peninsula. The first settlers in the Japanese archipelago most likely arrived at Kyushu island, which is across the sea from the Korean Peninsula ~35,000– 38,000 years ago11, 14. Although there have been continuous migrations and international contacts among the
Northeast Asian countries, Korean, Chinese and Japanese populations have remained largely exclusive and existed as genetically distinct populations as indirectly reflected by their distinct languages and cultures15. Therefore,
elu-cidating the genetic similarity and differences among the populations in this region will be an invaluable task15.
Here we compiled high-quality coding variant data from 1,055 healthy Korean individuals by whole exome sequencing (KOVA; Korean Variant Archive). This variant archive will allow for an enhanced understanding of the Korean genome to assist with research and proper clinical treatment of Korean individuals through genome sequencing, and can advance our understanding of the East Asian genome profile and history.
Results
Quality control.
To establish a genetic database of healthy Korean individuals, WES data from normal tis-sues from cancer patients (675 samples; 472 blood and 203 adjacent normal tistis-sues) and blood samples from healthy individuals with no apparent clinical history (380 samples) were collected. Clinical characteristics of the participants are summarized in Supplementary Table S1. After removing duplicated samples and cryptic relatives, 1,055 individuals remained for further analysis. The mean coverage depth of the runs was 75x (Supplementary Table S1). In total, we have identified 293,049 variants after vigorous filtering, which constituted the Korean var-iant archive (KOVA).The variants were covered 41x on average and mean genotype quality was above 66 (Supplementary Fig. S1a and b), assuring good variant calling quality. As further quality control steps, we checked transition-to-transversion and hetero-to-homozygosity ratios of the variants (Supplementary Fig. S1c and d and Fig. S2), both of which were consistent with the previous report16. Since our data set is a collection from five
independent groups with different capture and sequencing platforms, careful exclusion of any systematic bias was necessary. Therefore, we checked for the presence of inter-group biases using several criteria. First, the number of called variants per each individual was approximately ~42 K on average and the distribution was almost similar except for individuals from one group with a slightly lower mean value of ~39 K (Supplementary Fig. S3a), which might be due to using different exome capture kits (Supplementary Table S1). Next, we examined the profile of singleton variants that were seen only once in the set. The number of singletons per each individual was 101 on average and its distribution was stable across different groups (Supplementary Fig. S3b).
Basic KOVA features and population genetics.
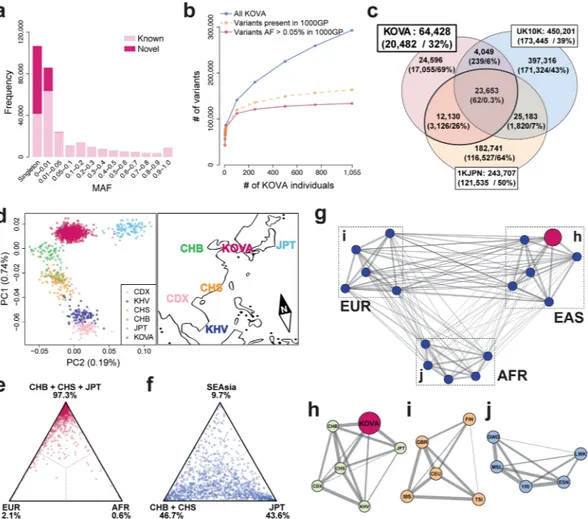
Identification of Korean-specific variations and cata-loging their frequencies are among the main purposes of the study. Comparison with the dbSNP database (build 147) showed that 205,002 (70.0%) variants were known and 88,047 (30.0%) variants were novel. Distribution of minor allele frequency (MAF) showed enrichment of novel variants in rare variants (45.6% of MAF ≦ 0.01) and the highest in the singletons (61.2%), consistent with previous reports (Fig. 1a, Supplementary Table S2)5, 6.Common variants of MAF > 0.05 were mostly known variants reported in dbSNP (99.8%). Simulation analysis demonstrates that the common variants reported in the 1000GP are rapidly saturated as the number of KOVA samples increases, suggesting that we are capturing almost all Korean common coding variants using this set, while rare or singleton variants accumulate with minimal overlaps as individual number increases (Fig. 1b). Therefore, KOVA can confer additional contributions to variant filtering in addition to the pre-existing databases when performing human genetics studies as confirmed by a simulation study using an independent Korean WES data set (22.8% additional reduction conferred to the ExAC-filtered variants; Supplementary Fig. S4).
To better understand the relationship of variant profiles between Korean and other populations, we com-pared the KOVA variants with those from other whole exome or genome sequencing based population studies. Comparison with the UK10K data would delineate the difference between Caucasian and Asian populations, and comparison with the Japanese whole genome sequencing (1KJPN) data is expected to contrast the subtle difference between Korean and Japanese populations6, 8. Only 36.7% of KOVA variants (23,653/64,428) were
commonly found in all three populations, indicating substantial differences by ethnic background (Fig. 1c and Supplementary Fig. S5). From this comparison, the number of UK10K-specific variants were the largest with 397,316 variants, which is expected given its large cohort size. As we applied strict variant filtering strategy, we noted that the number of KOVA-specific variants is markedly lower than that of the Japanese population. Principal component analysis (PCA) revealed that KOVA co-clustered with East Asians (Supplementary Fig. S6a) and located between Northern Chinese and Japanese (Fig. 1d). The PCA plot was in good agreement with the geographical locations of corresponding ethnic groups (Fig. 1d). As expected, fixation index (FST) analysis, a
parameter of population differentiation, revealed the closest relationship as Korean to Japanese and Chinese over African, European and Southeast Asian (Fig. 1e and f and Supplementary Fig. S6b and c). Having large genome-wide variant information, we asked how distinct is the Korean population compared to East Asian neigh-bors and to among the ethnic groups in African or European continents. Calculating FST among multiple
pop-ulation groups from 1000GP and KOVA reveals a close genetic relationship within each super-poppop-ulation and that KOVA is closely related to EAS in the 1000GP as expected (Fig. 1g). One of the critical questions that can be
addressed by this study is whether Korean population is genetically distinct from its neighboring populations, which will provide the rationale for constructing its own variant database. In this respect, we noted that the degree of closeness between KOVA and other East Asian populations, as scored by weighted FST, is comparable or
larger than those between African or European populations (Fig. 1g–j), demonstrating that the Korean popula-tion is a distinct ethnic group among EAS as those from other continents.
Functional analysis of coding variants.
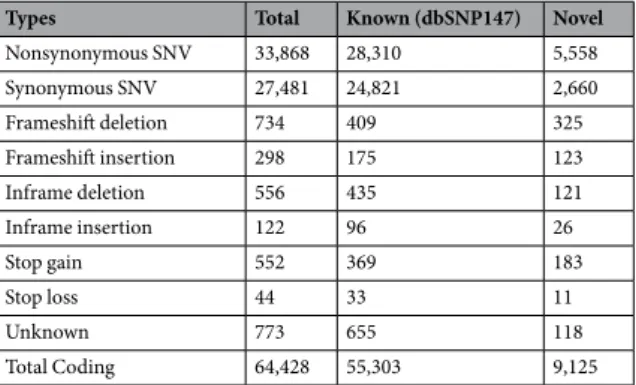
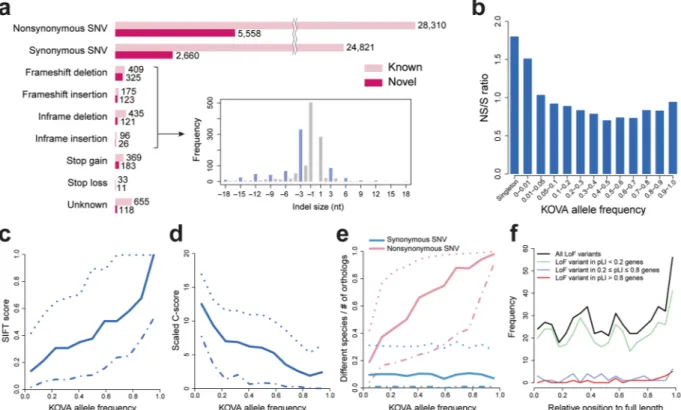
Next, we analyzed the functional impact of 64,428 coding var-iants in KOVA (Table 1). The portion of novel coding variants was 14.2% and most of the exonic variants were SNVs (95.2%). Short insertions and deletions (indels) are predominantly smaller than seven bases (93.8%), and coding indels are enriched in multiples of three bases, consistent with previous findings (Fig. 2a and Table 1). The novel-to-known ratio is relatively high in functionally significant variants such as frame-shift indels, stop gains and stop losses presumably due to purifying selection.Figure 1. Population profile of KOVA. (a) Distribution of variant minor allele frequencies (MAFs). (b) Variant
increment patterns as the number of the participants increases. (c) Venn diagram of coding variant comparisons among KOVA, Japanese population, and UK10K6, 8. Numbers and proportion of novel variants (i.e. not in
dbSNP build 142) in each area are shown in the parentheses. (d) Principal component analysis of KOVA and East Asian populations from 1000 Genomes Project (left panel) and corresponding geographical locations (right panel). The map image was modified from Openclipart with permission. (e and f) Gene-level FST between
KOVA and (e) East Asian, European, and African populations, and (f) Chinese, Japanese, and Southeast Asian populations. Each dot indicates a gene (see methods) and percentage values beneath population names denote proportion of dots that fell in each sector. (g) Network plot depicting pairwise fixation index (FST) of multiple
population groups including KOVA, which is represented as a red node. Thicker line indicates smaller FST,
indicating closer relationship. Positions of the nodes are arbitrarily arranged to roughly reflect the geographical location. Each subpopulation of (h) EAS including KOVA, (i) EUR, and (j) AFR was drawn separately. 1000GP; 1000 Genomes Project, AFR; African excluding Americans of African Ancestry in southwestern USA and African Caribbeans in Barbados, CDX; Chinese Dai in Xishuangbanna, China, CEU; Utah Residents (CEPH) with Northern and Western Ancestry, CHB; Han Chinese in Bejing, China, CHS; Southern Han Chinese, EAS; East Asian, ESN; Esan in Nigeria, EUR; European, FIN; Finnish in Finland, GBR; British in England and Scotland, GWD; Gambian in Western Divisions in the Gambia, IBS; Iberian Population in Spain, JPT; Japanese in Tokyo, KHV; Kinh in Ho Chi Minh City, Vietnam, LWK; Luhya in Webuye, Kenya, MSL; Mende in Sierra Leone, SEAsia; CDX and KHV, TSI; Toscani in Italia, YRI; Yoruba in Ibadan, Nigeria.
www.nature.com/scientificreports/
The nonsynonymous-to-synonymous SNVs (N/S) ratio was relatively high in rare variants (Fig. 2b). The nonsynonymous variants tend to display more damaging or pathogenic scores as variants become rarer in the population (i.e., reduced SIFT score, increased PolyPhen-2, scaled C-score (CADD score) and PhyloP scores) (Fig. 2c and d and Supplementary Fig. S7)17–20, again implying increased variant functionality as they become
relatively rare. One important parameter of nonsynonymous variant functionality is how an amino acid residue is conserved throughout evolution. Therefore, we counted the ratio of vertebrate species with different amino acids on orthologous proteins from human as a measurement of evolutionary conservation. The ratio increased (i.e., weaker conservation) for nonsynonymous variant residues as allele frequency increases, whereas the ratio remained consistently low (i.e., strong conservation) for synonymous ones (Fig. 2e). This result suggests that nonsynonymous variants, especially common ones, tend to occur in less well conserved residues, mostly escaped from functional restrictions conferred by amino acid changes. The mean of 117 heterozygous loss-of-function (LoF) variants were detected per individual. A majority of LoF variants are rare (85.3% of all LoF variants are MAF < 1%), and more than half of LoF are singletons (55.8%). Consistent with the observation from a nonsyn-onymous variant conservation pattern, the relative positions of stop gain variants on proteins were biased to the C-terminal end (Fig. 2f) and most of the stop gain variants were found in genes with tolerable pLI (probability of being LoF intolerant) values (<0.2)5. Although the participants of the study are healthy, we compared the KOVA
variants to the ClinVar list to test whether there are any carriers of reported pathogenic variants (Supplementary Fig. S8). A number of “pathogenic” variants that reach high allele frequencies were detected, supporting the rising concern that a certain portion of previously-tagged pathogenic variants may not be truly pathogenic (26 variants are MAF > 10% in both KOVA and ExAC, Supplementary Fig. S8).
Copy number variations in KOVA.
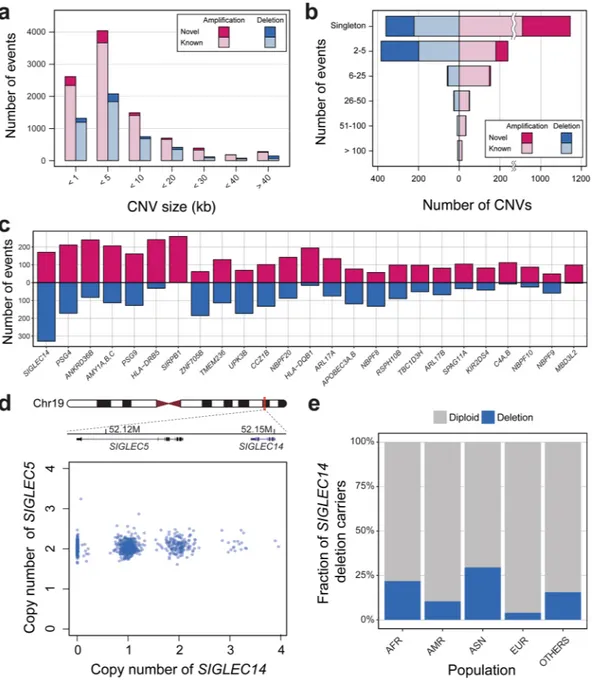
Although WES is not designed for copy number variation (CNV) detection, the large sample size and recent improvements of bioinformatics tools allow stable CNV detection and analysis5. After the initial QC filtering steps, 944 samples remained and were used for CNV analysis. Among the944 Korean individuals, we found a total of 14,600 putative CNV segments. The average number of CNVs per individual was 10.3 and 5.2 for the amplifications and deletions, respectively (Supplementary Table S3). Most of the called CNV segments were shorter than 10 kb (i.e. segments covering two or three exons), as larger CNVs tend to pose higher odds of conferring pathogenicity (Fig. 3a). We compared our CNV segments with control list of CNVs from the database of genomic variants (DGV) (see Materials and Methods). About 10% of all KOVA CNV segments were not found in DGV and were called as novel. These novel CNV calls tend to be smaller in size (78.1% smaller than 10 kb) and found in rare frequencies (Fig. 3a and b). Chromosome 19 was known to display the highest gene density among the human chromosomes21, and contained the highest numbers of CNV calls
after adjusting for size, consistent with other WES-based CNV studies (Supplementary Fig. S9)22. To find highly
copy number polymorphic genes in the Korean population, we counted the frequency of copy number changes by sorting genes by sum of amplification and deletion frequencies (Fig. 3c). The list includes well-known polymor-phic loci such as amylase and HLA genes, and SIGLEC14 was the most highly copy number polymorpolymor-phic locus while SIGLEC5, which is located just upstream of SIGLEC14 is mostly copy-neutral (Fig. 3d and Supplementary Figs S10 and S11). A previous study reported that deletion polymorphism of SIGLEC14 is higher in Asians com-pared with Africans and Europeans23. We also observed this Asian-specific high frequency of SIGLEC14 deletion
in DGV, although its functional implication remains elusive (Fig. 3e). Finally, a subset of KOVA subjects (n = 208) were also analyzed by SNP arrays and their CNV profiles are well-correlated with WES-based KOVA profiles (Correlation = 0.43, Supplementary Fig. S12).
Potential role of rare germline variants on tumor susceptibility.
Having tumor-paired normal sam-ples in our cohort provided an opportunity to explore the potential role of rare germline variants in cancer devel-opment. After selecting 54 and 72 rare variants for lung and stomach cancers (Supplementary Tables S4 and S5), that were enriched in “tumor-paired normals” compared to “healthy normals” (see Materials and Methods), we observed a similar difference of allele frequencies between the Cancer Genome Atlas (TCGA) and 1000GP normal datasets (P = 0.018 and P = 0.003 for lung and stomach adenocarcinomas, respectively; Fig. 4). Our results indicate that certain SNVs in our tumor-derived cohorts may potentially function as predisposing factors for tumorigenesis.Types Total Known (dbSNP147) Novel
Nonsynonymous SNV 33,868 28,310 5,558 Synonymous SNV 27,481 24,821 2,660 Frameshift deletion 734 409 325 Frameshift insertion 298 175 123 Inframe deletion 556 435 121 Inframe insertion 122 96 26 Stop gain 552 369 183 Stop loss 44 33 11 Unknown 773 655 118 Total Coding 64,428 55,303 9,125
Discussion
To our knowledge, a WES-based genomic variant catalog from Korean individuals of this size has never been pre-viously reported. We have demonstrated the rationale of constructing an independent Korean genomic database by showing that genetic distances between KOVA and other East Asian ethnic groups are comparable or even farther than those between the ethnic groups of Africa or Europe (Fig. 1g–j). In East Asia, one of the most genet-ically similar ethnic groups to Koreans is Japanese, which is well supported by historic evidence that people have colonized the Japanese archipelago through the Korean Peninsula about 40,000 years ago. The high-quality cod-ing variants that are predicted to change protein sequences followed signatures of purifycod-ing selection. Although we need to further investigate functional implications and multi-ethnic comparative profiling of Korean copy number variations, we called 14,600 CNVs and demonstrate that they also followed the restrictions posed by purifying selection. We also propose a group of rare functional variants that may regulate cancer susceptibility and validated their consistent behaviors using European-based TCGA and 1000GP databases. Further validation of these variants is required with larger independent cohorts and performing functional analyses.
There are limitations in this study, one of which is our strategy of applying stringent variant filtering crite-ria, which resulted in calling fewer variants compared to others. As the number of rare variants continued to increase as we added more samples (Fig. 1b), we are still limited in covering rare variants using this cohort size. Nevertheless, this study cataloged the largest healthy Korean cohorts and we found that most of the common coding variants were well covered by this set.
WES- or WGS-based sequencing efforts have become more commonplace over recent years and will con-tinue to do so in the near future, thus we anticipate that expanding KOVA with new participants will ensure that the archive remains a valuable database for pursuing disease-based, population or evolutionary genetic studies of Korean individuals.
Methods
Cohorts and sample preparation.
We collected WES data of Korean individuals from five independent research groups. All sequencing data were obtained from normal tissues or blood samples following standard protocols (Supplementary Table S1). This project was performed with approval of the Institutional Review Board of each group (Seoul National University, Ewha Womans University, Asan Medical Center, and Samsung Medical Center), in which all donors provided written informed consent. All the experiments were performed in de-iden-tified status and in accordance with relevant guidelines and regulations.Figure 2. Functional analysis of KOVA coding variants. (a) Numbers of novel and known variants categorized
by function. The overlaid plot shows size distribution of indels, with the blue bar indicating multiples of three bases. (b) Nonsynonymous to synonymous SNV (NS/S) ratio by variant allele frequencies. (c) SIFT score and (d) Scaled C-score (CADD) by allele frequencies. (e) Degree of amino acid conservation of variant residues by allele frequencies. Fraction of species numbers with different amino acid on orthologous proteins compared to human orthologs. (f) Relative position of loss-of-function (LoF) variants on protein. Solid, dotted, and dash-dot lines in c-e indicate median, upper, and lower quantiles, respectively.
www.nature.com/scientificreports/
Variant calling and filtering.
The raw sequencing data were analyzed with in-house pipeline (Supplementary Fig. S13) to combine data from different exome capture platforms. Briefly, BWA (version 0.7.5a) was used to map short reads to hg19. GATK (version 2.4–7) was used for local realignment and recalibration after duplicate marking with Picard (version 1.93)24. GATK UnifiedGenotyper was used to call variants across all samples simultaneouslyin the multi-sample calling mode, which allowed us to distinguish whether no variant calls indicated homozygous reference or missing calls due to low coverage. The quality score was further recalibrated using GATK’s VQSR model. To obtain a reliable list of variants suitable for population genetics studies, we applied extensive filtering steps as per the following: The minimum genotype quality and depth of coverage were set to 30 and 10, respectively. Then variants with missing genotypes in more than 30% of all individuals were excluded from further analyses. We also removed variants that violate Hardy-Weinberg equilibrium on allelic frequency (P < 10−6).
Power simulation of KOVA.
To simulate variant increment pattern as the number of KOVA individuals increases, we randomly selected 1, 2, 3, 4, 5, 6, 7, 8, 9, 10, 100, 250, 500 and 750 samples from KOVA to count variants of MAF > 0.05% in 1000GP and novel variants.Figure 3. Copy number variations in KOVA. (a) Distribution of KOVA CNV sizes. (b) Frequency of CNVs
by number of events in KOVA. (c) Highly polymorphic copy number genes in KOVA. Genes are sorted by frequency. (d) Copy number genotype profiles of SIGLEC14 and SIGLEC5. (e) Frequency of SIGLEC14 deletion allele in worldwide populations from DGV. AFR: African, AMR: Mexican, native American, North American, and South American, ASN: Asian, EUR: European.
Principal component and fixation index (F
ST) analyses.
Throughout the study, “African” indicatespopulations with a super-population code of AFR in the 1000GP phase 3, excluding ASW (Americans of African Ancestry in SW USA) and ACB (African Caribbeans in Barbados), and “South East Asian” includes CDX (Chinese Dai in Xishuangbanna, China) and KHV (Kinh in Ho Chi Minh City, Vietnam)4. Variants
intersect-ing 1000GP phase 3 and KOVA were merged to a VCF file usintersect-ing vcftools (version 0.1.15)25. For comparison of
KOVA and EAS (East Asian) in the 1000GP, merged VCF file was organized by sample names using ‘bcftools subset’ (version 1.3, https://github.com/samtools/BCFtools). These VCF files were independently filtered using the ‘bcftools view’ to retrieve common (MAF > 5%) variants and then used as inputs for principal component analysis (PCA) and FST. PCA was performed with SNPRelate R package (version 1.4.2)26. FST was estimated with
vcftools using–weir-fst-pop option25, 27. Variant level analysis was performed with a 0.5 million bp window size
(option:–fst-window-size 500000) and 0.5 million bp step size (option:–fst-window-step 500000). Windows con-taining less than three variants were excluded from the subsequent analyses. For gene level analysis, we estimated
FST for individual variants and then assigned them to each gene according to intervals annotated in the GTF file
of GENCODE 1928. Genes with over ten variants were included in the analysis. F
ST values were converted to
posi-tions representing relative distances to each ethnic group and visualized on a triangle plot. For network analysis using FST values, genome-wide weighted FST values were used as inputs to Cytoscape (version 3.4.0)29.
Functional annotation of nonsynonymous variants.
Functional annotation was performed by ANNOVAR (version 2014-11-13) with databases summarized in Supplementary Table S630. Multiple alignmentof orthologous protein was downloaded from the UCSC genome browser database.
Copy number variation analysis.
We called CNVs with CODEX software using default settings31. Toadjust for possible variations derived from different exome capture kits, we applied the algorithm to each group separately and then combined the results. Known CNVs were downloaded from the DGV (Database of genomic variants, http://dgv.tcag.ca) and calls from 2009 and onwards that were generated using WGS or SNP array plat-forms were selected for subsequent analyses. The overlap between the DGV variants and KOVA CNV segments were calculated with bedtools using −r 0.5 option (i.e., 50% overlap)32. Notable CNV segments were manually
checked using the Integrative Genomics Viewer (IGV). ExAC copy number data were downloaded from the ftp site (release 0.3.1, ftp://ftp.broadinstitute.org)5, 22, 33. DGV dataset ID:gssvL59302 was used for global SIGLEC14
copy number profile.
In order to validate the KOVA CNV from an independent platform, we performed CytoScan HD array scan-ning on 208 samples. Briefly, raw CEL files were processed by apt-copynumber-cyto (1.18.2) from Affymetrix Power Tools (APT). Details are described in APT manual ( http://media.affymetrix.com/support/developer/pow-ertools/changelog/apt-copynumber-cyto.html). Then the KOVA absolute copy number and array signal intensity were compared after exclusion of non-overlapping probes.
Assessing roles of rare germline variants on tumor susceptibility.
The SNVs from the tumor-paired normal individuals (“tumor-paired normal”, 364 and 76 samples for lung and stomach adenocarcinoma, respec-tively) and healthy normal individuals (“healthy normal”, 134 samples) were filtered from a single collective VCF file using the VCFtools–keep option25. MAF of the SNVs from tumor-paired normals was compared tothat of the SNVs from healthy normals. Protein-altering SNVs that exhibited MAF < 0.01 and 1.5 fold greater MAF in the tumor-paired normals than the heathy normals were selected for further analysis. These SNVs were annotated using ANNOVAR for four functional prediction parameters (SIFT, PolyPhen-2, MutationAssessor and GERP++)30, 34. The SNVs that were predicted to be deleterious in two out of the four prediction tools were
selected as potentially interesting candidates of tumor susceptibility.
For a validation test, the tumor-paired normal data of the lung (LUAD, n = 229) and stomach (STAD, n = 137) adenocarcinomas from TCGA was obtained after excluding non-whites using the analysis pipeline outlined in Supplementary Fig. S13. The SNV data from the 504 East Asian (EAS) and 503 European (EUR) individuals in 1000GP were obtained as independent healthy normal cohorts using VCFtools to compare with tumor-paired
Figure 4. Cancer susceptibility variant distributions in KOVA. Potentially deleterious SNV MAFs extracted
from (a) lung adenocarcinoma and (b) stomach adenocarcinoma tumor-paired normal sets or other public databases were plotted. LUAD: lung adenocarcinoma; STAD: stomach adenocarcinoma.
www.nature.com/scientificreports/
normals in KOVA and TCGA, respectively3, 4, 25. The selected SNVs from the discovery phase was compared with
those of EAS individuals in 1000GP and between those of TCGA and EUR individuals in 1000GP, and the signif-icance was assessed using Wilcoxon’s rank sum test.
References
1. Fu, W. et al. Analysis of 6,515 exomes reveals the recent origin of most human protein-coding variants. Nature 493, 216–220 (2013). 2. Tennessen, J. A. et al. Evolution and functional impact of rare coding variation from deep sequencing of human exomes. Science 337,
64–69 (2012).
3. 1000 Genomes Project Consortium et al. An integrated map of genetic variation from 1,092 human genomes. Nature 491, 56–65 (2012).
4. 1000 Genomes Project Consortium et al. A global reference for human genetic variation. Nature 526, 68–74 (2015). 5. Lek, M. et al. Analysis of protein-coding genetic variation in 60,706 humans. Nature 536, 285–291 (2016). 6. Huang, J. et al. The UK10K project identifies rare variants in health and disease. Nature 526, 82–90 (2015).
7. Population Division, Department of Economic and Social Affairs, United Nations. World Population Prospects: The 2015 Revision, Key Findings and Advance Tables. Available from: https://esa.un.org/unpd/wpp/publications/files/key_findings_wpp_2015.pdf (2015). 8. Nagasaki, M. et al. Rare variant discovery by deep whole-genome sequencing of 1,070 Japanese individuals. Nat Commun 6, 8018
(2015).
9. Higasa, K. et al. Human genetic variation database, a reference database of genetic variations in the Japanese population. J Hum Genet 61, 547–553 (2016).
10. Petrovski, S. & Goldstein, D. B. Unequal representation of genetic variation across ancestry groups creates healthcare inequality in the application of precision medicine. Genome Biol 17, 489 (2016).
11. Stanyon, R., Sazzini, M. & Luiselli, D. Timing the first human migration into eastern Asia. J. Biol. 8, 18 (2009).
12. Jin, H.-J., Tyler-Smith, C. & Kim, W. The peopling of Korea revealed by analyses of mitochondrial DNA and Y-chromosomal markers. PLoS ONE 4, e4210 (2009).
13. Skoglund, P. & Jakobsson, M. Archaic human ancestry in East Asia. Proc. Natl. Acad. Sci. USA 108, 18301–18306 (2011). 14. Takashi, T. MIS3 edge-ground axes and the arrival of the first Homo sapiens in the Japanese archipelago. Quat Int 248, 70–78 (2012). 15. Tian, C. et al. Analysis of East Asia genetic substructure using genome-wide SNP arrays. PLoS ONE 3, e3862 (2008).
16. Wang, J., Raskin, L., Samuels, D. C., Shyr, Y. & Guo, Y. Genome measures used for quality control are dependent on gene function and ancestry. Bioinformatics 31, 318–323 (2015).
17. Adzhubei, I. A. et al. A method and server for predicting damaging missense mutations. Nat. Methods 7, 248–249 (2010). 18. Kircher, M. et al. A general framework for estimating the relative pathogenicity of human genetic variants. Nat. Genet. 46, 310–315
(2014).
19. Kumar, P., Henikoff, S. & Ng, P. C. Predicting the effects of coding non-synonymous variants on protein function using the SIFT algorithm. Nat Protoc 4, 1073–1081 (2009).
20. Cooper, G. M. et al. Distribution and intensity of constraint in mammalian genomic sequence. Genome Res 15, 901–913 (2005). 21. Grimwood, J. et al. The DNA sequence and biology of human chromosome 19. Nature 428, 529–535 (2004).
22. Ruderfer, D. M. et al. Patterns of genic intolerance of rare copy number variation in 59,898 human exomes. Nat. Genet. 48, 1107–1111 (2016).
23. Yamanaka, M., Kato, Y., Angata, T. & Narimatsu, H. Deletion polymorphism of SIGLEC14 and its functional implications. Glycobiology 19, 841–846 (2009).
24. McKenna, A. et al. The Genome Analysis Toolkit: a MapReduce framework for analyzing next-generation DNA sequencing data. Genome Res 20, 1297–1303 (2010).
25. Danecek, P. et al. The variant call format and VCFtools. Bioinformatics 27, 2156–2158 (2011).
26. Zheng, X. et al. A high-performance computing toolset for relatedness and principal component analysis of SNP data. Bioinformatics
28, 3326–3328 (2012).
27. Weir, B. S. & Cockerham, C. C. Estimating F-statistics for the analysis of population structure. evolution 38, 1358–1370 (1984). 28. Harrow, J. et al. GENCODE: the reference human genome annotation for The ENCODE Project. Genome Res 22, 1760–1774 (2012). 29. Shannon, P. et al. Cytoscape: a software environment for integrated models of biomolecular interaction networks. Genome Res 13,
2498–2504 (2003).
30. Wang, K., Li, M. & Hakonarson, H. ANNOVAR: functional annotation of genetic variants from high-throughput sequencing data. Nucleic Acids Res. 38, e164–e164 (2010).
31. Jiang, Y., Oldridge, D. A., Diskin, S. J. & Zhang, N. R. CODEX: a normalization and copy number variation detection method for whole exome sequencing. Nucleic Acids Res. 43, e39 (2015).
32. Quinlan, A. R. & Hall, I. M. BEDTools: a flexible suite of utilities for comparing genomic features. Bioinformatics 26, 841–842 (2010). 33. Thorvaldsdóttir, H., Robinson, J. T. & Mesirov, J. P. Integrative Genomics Viewer (IGV): high-performance genomics data
visualization and exploration. Brief Bioinformatics 14, 178–192 (2013).
34. Liu, X., Jian, X. & Boerwinkle, E. dbNSFP v2.0: a database of human non-synonymous SNVs and their functional predictions and annotations. Hum Mutat 34, E2393–2402 (2013).
Acknowledgements
This work was supported by the Technology Innovation Program funded by the Ministry of Trade, Industry & Energy, Republic of Korea (Grant no. 10050154; to S.L.), by a grant from Ministry of Food and Drug Safety, Republic of Korea, in 2016 (Grant no. 16173MFDS004; to W.-Y.P.), by the Institute for Basic Science (Grant no. IBS-R008-D1; to D.B.), and by Post-Genome Program of the National Research Foundation funded by the Ministry of Science, ICT & Future Planning, Republic of Korea (Grant no. NRF-2014M3C9A2064686; to M.C. and Grant no. NRF-2014M3C9A3063541; to D.B.). KOVA data are publically available at http://kobic.re.kr/kova/. This research was supported by the KRIBB Research Initiative Program.
Author Contributions
Sanghyuk L., W.-Y.P., D.B. and M.C. planned and designed this study. J.-H.C., I.-J.J., Sanghyuk L., W.-Y.P., D.B. and M.C. contributed to recruitment of cohort for whole exome sequencing. J.S.I., R.D.B., Sangmoon L., J.S., J.P., J.-Y.N. and A.C. processed the sequencing data and all authors contributed to the analysis and interpretation of the data. Sanghyuk L., W.-Y.P., D.B. and M.C. drafted the manuscript. All authors commented on the manuscript and approved the final version to be submitted.
Additional Information
Supplementary information accompanies this paper at doi:10.1038/s41598-017-04642-4 Competing Interests: The authors declare that they have no competing interests.
Publisher's note: Springer Nature remains neutral with regard to jurisdictional claims in published maps and
institutional affiliations.
Open Access This article is licensed under a Creative Commons Attribution 4.0 International
License, which permits use, sharing, adaptation, distribution and reproduction in any medium or format, as long as you give appropriate credit to the original author(s) and the source, provide a link to the Cre-ative Commons license, and indicate if changes were made. The images or other third party material in this article are included in the article’s Creative Commons license, unless indicated otherwise in a credit line to the material. If material is not included in the article’s Creative Commons license and your intended use is not per-mitted by statutory regulation or exceeds the perper-mitted use, you will need to obtain permission directly from the copyright holder. To view a copy of this license, visit http://creativecommons.org/licenses/by/4.0/.