S H O R T R E P O R T
Open Access
Genomic GPS: using genetic distance from
individuals to public data for genomic
analysis without disclosing personal
genomes
Kunhee Kim
1,3†, Hyungryul Baik
2†, Chloe Soohyun Jang
3, Jin Kyung Roh
4, Eleazer Eskin
5,6and Buhm Han
3*Abstract
Genomic global positioning system (GPS) applies the multilateration technique commonly used in the GPS to genomic data. In the framework we present here, investigators calculate genetic distances from their samples to reference samples, which are from data held in the public domain, and share this information with others. This sharing enables certain types of genomic analysis, such as identifying sample overlaps and close relatives, decomposing ancestry, and mapping of geographical origin without disclosing personal genomes. Thus, our method can be seen as a balance between open data sharing and privacy protection.
Keywords: Multilateration, Genetic distance, Personal genome, Data sharing, Privacy protection
Main text
It is crucial to balance privacy protection and data shar-ing in genomics [1–3]. Full disclosure of genomic data benefits the research community through productive data reuse but increases the chances of privacy breaches. Full closure, by contrast, ensures privacy but discourages collaborative science.
Here we present a method called genomic GPS that aims to achieve a balance between data sharing and privacy protection. It allows sharing of information to a degree sufficient for approximating relative genetic distance of an individual from either another individual or a group. Iden-tification of closer relatives and population genomic ana-lyses, such as ancestry decomposition and geographical origin mapping, are possible. Importantly, though, the shared information conceals individual genotypes, making it extremely difficult to reconstruct the personal genomes.
Our method builds upon multilateration, a localization technique for wireless sensor networks in which spatial coordinates of a node with an unknown position are
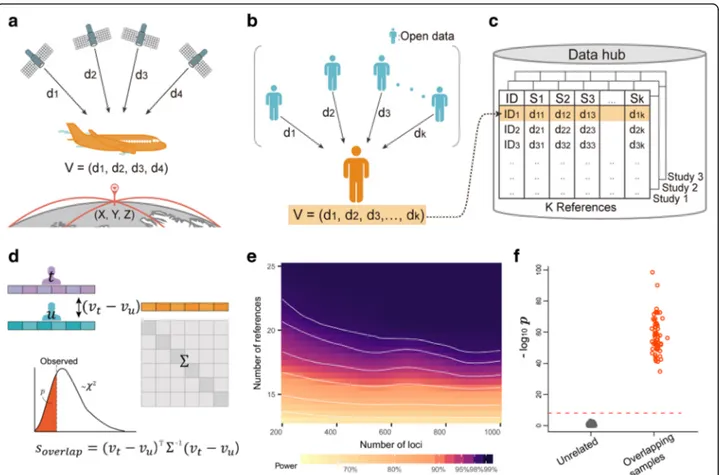
inferred by measuring the distances from the node to sev-eral reference nodes at known positions [4]. For example, in the GPS navigation system of an aircraft, the distances from the aircraft to satellites are calculated from time lags in transmitted radio signals. These distances are then used to calculate the aircraft’s position (Fig.1a).
To apply multilateration in a genomic context, we first evaluated this technique’s characteristics in a multidimen-sional space. We derived a mathematical proof showing that in N-dimensional space, and with K reference nodes with known positions, an unknown node’s coordinates can be unequivocally identified if K > N (Additional file1: Sup-plementary Note). Perhaps more importantly, we derived another proof showing that an unknown node’s coordinates can never be exactly specified if K < N− 1 (Additional file1: Supplementary Note). This was encouraging because it sug-gested that the distances to known nodes convey limited in-formation under this condition and can be safely shared without disclosing the actual location.
Encouraged by this proof, we applied multilateration to genomic data. We considered an individual’s genotype data to be a node in N-dimensional space where each coordinate represents each of N polymorphic loci. In this space, the pairwise Euclidean distance between nodes represents the genetic distance between individuals © The Author(s). 2019 Open Access This article is distributed under the terms of the Creative Commons Attribution 4.0
International License (http://creativecommons.org/licenses/by/4.0/), which permits unrestricted use, distribution, and reproduction in any medium, provided you give appropriate credit to the original author(s) and the source, provide a link to the Creative Commons license, and indicate if changes were made. The Creative Commons Public Domain Dedication waiver (http://creativecommons.org/publicdomain/zero/1.0/) applies to the data made available in this article, unless otherwise stated. * Correspondence:buhm.han@snu.ac.kr
†Kunhee Kim and Hyungryul Baik contributed equally to this work. 3Department of Medical Sciences, Seoul National University College of Medicine, Seoul, South Korea
Full list of author information is available at the end of the article
Kim et al. Genome Biology (2019) 20:175 https://doi.org/10.1186/s13059-019-1792-2
(Fig. 1b). We then measured genetic distances from that individual to K reference individuals in open datasets
such as 1000Genomes [5]; these datasets are analogous
to satellites with known positions. We call the length-K vector of distances the “distance vector”. The core idea of our approach is to share a distance vector that would allow certain types of genomic analysis without disclos-ing the personal genome data (Fig.1c).
If we imagined that genotypes were real numbers, it is theoretically impossible to reconstruct the genotypes as
long as N≫ K, as shown by our proof. Unfortunately,
genotype data resides in a very restricted space, {0, 1, 2}N. Nevertheless, the search space is still large enough to pre-vent data reconstruction in practice. We designed a greedy algorithm that tries to reconstruct the genotype data given a distance vector and reference data (Additional file 1: Supplementary Note) and applied it to simulated data. To avoid local optima, we allowed multiple restarts of the al-gorithm to find the best possible solution. The predicted genotypes were not much better than a coarse prediction
based on allele frequency (Additional file 1: Figure S1). These empirical simulations showed that it was impracti-cal to reconstruct genotypes from a distance vector.
Sharing of distance vectors facilitates several applica-tions. First, we can use the similarity of two distance vectors to find sample overlaps or close relatives. Intui-tively, if genomes from two individuals resemble each other, their distance vectors will also be similar. To sys-tematically interpret the similarity in distance vectors, we designed the following statistic. Let Xt, n∈ {0, 1, 2} be
the reference allele count of individual t at SNP n. The squared Euclidean distance between individuals t and u is Dt; u ¼PNn¼1ðXt; n−Xu; nÞ2. Let Dt, k be the distance
between t and reference individual k. Given K reference individuals, the distance vector of individual t is vt= (Dt, 1, Dt, 2…, Dt, K). Then, we define a statistic that compares
two distance vectors, vtand vu:
soverlap¼ ðvt−vuÞTΣ−1ðvt−vuÞ
Fig. 1 Genomic GPS and its application to sample overlap detection. a The concept of conventional GPS. Distances to satellites are used to compute an aircraft’s location. b The concept of genomic GPS. The genetic distances of an individual to reference individuals in public datasets are calculated to create a distance vector. c Distance vectors can be shared, for example, by using a public data hub. d Sample overlap detection using distance vectors. The distance vectors of two individuals are compared using a statistic that follows aχ2distribution. e The power of the sample overlap detection
method as a function of the number of loci and the number of reference individuals used to calculate the genetic distances. fP values of the sample overlap detection method for overlapping pairs and unrelated pairs in the simulations using the WTCCC data
where Σ is the covariance matrix of vt− vu. We showed (Additional file 1: Supplementary Note) that the (i, j)th element ofΣ is Σij¼ XN n¼1 24p4n−48p3nþ 20p2nþ 4pn ði¼ jÞ XN n¼1 −8p4 nþ 16p3n−12p2nþ 4pn ð Þi≠j 8 > > > > < > > > > :
where pn is the population allele frequency of SNP n. The statistic soverlap follows aχ2distribution with K de-grees of freedom if t and u are unrelated (Fig.1d); thus, we can test whether two individuals are related by calcu-lating a P value from the lower tail. The false positive rate was well controlled (Additional file 1: Table S1 and Figure S2), and high power was achievable for reason-able numbers of N and K (Fig. 1e). This statistic can be useful if researchers at different institutions want to check whether there are overlapping individuals in their samples, because sample overlaps can contaminate the result of aggregate studies such as meta-analyses. Instead of the squared Euclidean distance, one can also use gen-etic relatedness metric as the measure of gengen-etic
dis-tance. Given the standardized allele count
Xt;n ¼ ðXt;n−2pnÞ=pffiffiffiffiffiffiffiffiffiffiffiffiffiffiffiffiffiffiffiffiffi2pnð1−pnÞ, the genetic relatedness between individuals t and u is Gt;u¼ 1
N PN
n¼1Xt;nXu;n [6]. Using genetic relatedness, the results were similar (Add-itional file1: Supplementary Note and Figure S3). We per-formed real data-based analysis using the Wellcome Trust Case Control Consortium (WTCCC) data [7] by designing studies with overlapping samples (Additional file1: Sup-plementary Note). Our method could detect overlapping samples with perfect sensitivity and specificity (Fig. 1f), when using the 1000Genomes data [5] as reference.
We then examined whether close relatives were also distinguishable using our statistic. We simulated differ-ent degrees of relatives and predicted the true relation-ship for a given pair using our statistic. Among first-degree relatives, 79% were correctly predicted as first de-gree (Additional file 1: Figure S4 and S5). Relatives be-yond the first degree were less distinguishable, where 39% and 21% of second- and third-degree relatives were correctly predicted, respectively. In sum, distance vectors contain sufficient information to determine overlapping samples and to give clues for close relatives, which can be useful for certain types of analyses. However, such a disclosure could be considered a leak of information in some situations. In those situations, alternatives such as secure hashing [3] can be considered for detecting sam-ple overlaps.
The second application for sharing a distance vector is population genomic analyses. The distance vector con-tains information that can infer the genetic spatial
structure of individuals. Recent studies showed that gen-etic data enabled the geographical origin of an individual
to be located on a two-dimensional (2D) map [8, 9].
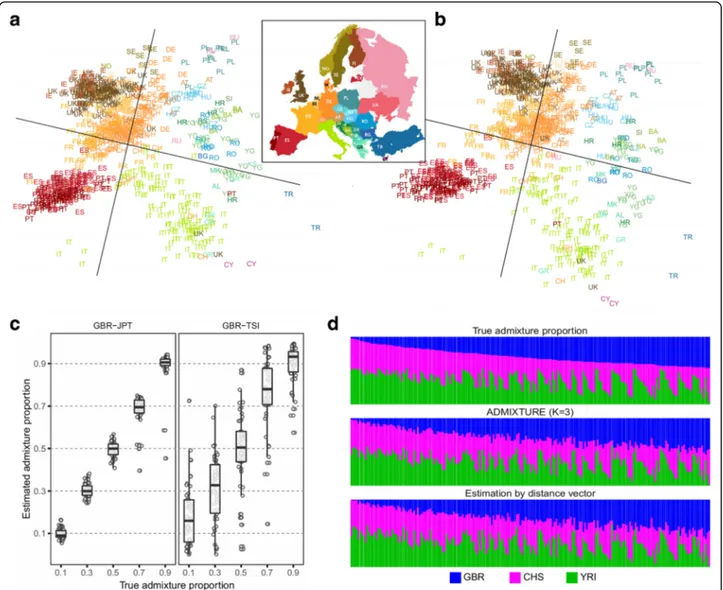
Novembre et al. [8] applied principal component analysis (PCA) to the genomic data of 3192 Europeans from 36 countries (the POPRES dataset [10]), where the two main principal components (PC) matched the geographical map of Europe with great accuracy. We designed a procedure that converts a distance vector into an approximate pos-ition in the PC space (Addpos-itional file 1: Supplementary Note). Consider that we have K reference individuals. We first apply eigendecomposition to their genetic relatedness matrix (GRM) to obtain the top two eigenvectors (PCs) in a 2D space, P. Given a target individual, we want to ap-proximate its position inP. Suppose that we have the tar-get’s distance vector to K references based on the genetic relatedness metric. Then, we can construct the GRM of the K + 1 individuals (the references and the target) by appending the distance vector to the GRM. We decom-pose this (K + 1) × (K + 1) GRM to obtain a PC map of K+ 1 individuals in a new 2D space, P0. The positions of the K references in P0 are not identical to their positions
inP, because adding one more datapoint in PCA can
dis-tort the positions of the other points (Additional file 1: Figure S6). Because of this subtle difference, in order to project the target’s point from P0 to P, we apply another layer of“multilateration”. Using the map in P0, we calcu-late the 2D Euclidean distances between the target and the references to create a distance vector. Using the stand-ard multilateration technique, this distance vector can be used to map the target’s position in P by the least-square minimization [4]. After repeating this procedure for each target, the approximated PC map of all target individuals is obtained by removing reference datapoints fromP.
To evaluate the performance of our method, we used the POPRES data [10] (Additional file1: Table S2) using 60% of the individuals as samples and 40% as references (Additional file1: Supplementary Note). The mapping of
the origins of the samples using our method (Fig. 2a)
closely resembled the PC mapping based on actual geno-type data (Fig.2b). The output image resembled the geo-graphic map of Europe, with geogeo-graphically adjacent populations found near to each other and geographically distant populations found far apart. We then tried to map the POPRES data using the 1000Genomes samples [5] as reference data. Overall, the approximate locations of the populations were similar to the European map (Additional file 1: Figure S7). However, the distinction between the Eastern/Russian populations and the Cen-tral European populations was unclear, possibly because there is sparse data from these populations in this refer-ence dataset [5].
Another application for sharing distance vectors in population genomics is the inference of an individual’s
ethnic admixture proportions. We designed a procedure to estimate the admixture proportion of an individual only using the distance vector (Additional file1: Supple-mentary Note). The idea is to approximate the location of a target individual in the PC map of the multiple ref-erence populations. We measure the Euclidean distance of the individual to the centroid of each candidate popu-lation and estimate the ancestry proportions as being in-versely proportional to these distances. Using the 1000Genomes data, we simulated admixed individuals from two populations, gradually varying the proportions. When the two populations were genetically distant (European and Asian), the estimated proportion was close to the true proportion (r2= 0.98, Fig. 2c). When
the two populations were genetically close (two Euro-pean countries), the estimation was less accurate but
showed high correlation to the true proportion (r2=
0.86, Fig. 2c). We then combined data for three popula-tions (European, Asian, and African) in varying propor-tions. For comparison, we applied an existing method,
ADMIXTURE [11], which uses actual genotype data
(Additional file 1: Supplementary Note). Both
ADMIX-TURE and our method gave estimations that were highly concordant with the true proportions (Fig.2d).
We have presented a novel technique that applies mul-tilateration to genomic data. Our method allows sharing distance vectors with other investigators or institutions, enabling certain types of genomic analysis while making
Fig. 2 Population genomic applications of distance vectors. a Two-dimensional mapping of the Europeans in the POPRES data using only distance vectors. We mapped a subset (60%) of the POPRES individuals and used the rest of the individuals (40%) as references. See Additional file1: Table S2 for the abbreviated population names. b Mapping result of the same individuals using actual genomic data (the top two PCs). c Estimation of admixture proportion using distance vectors. We simulated admixed individuals from two distant populations (GBR: British in England and Scotland and JPT: Japanese in Tokyo, Japan) and two close populations (GBR and TSI: Toscani in Italia) using the 1000Genomes data. d Admixture of three populations (GBR, CHS: Southern Han Chinese, and YRI: Yoruba in Ibadan, Nigeria). The proportions were estimated using distance vectors and ADMIXTURE
it difficult to reconstruct the personal genomes. We ex-pect that our approach will find interesting applications in the future in addition to those described herein.
Methods
See Additional file1: Supplementary Note for additional methods not described above.
Additional file
Additional file 1:Supplementary Note, Tables S1, S2 and Figures. S1-S12. (PDF 3657 kb)
Authors’ contributions
BH devised the project. KK and CSJ performed the analysis. CSJ developed the software package. HB derived mathematical proofs. KK, HB, JKR, EE, and BH wrote the manuscript. BH and EE supervised the project. All authors read and approved the final manuscript.
Funding
This research was supported by the National Research Foundation of Korea (NRF) grant (grant number 2019R1A2C2002608) and the Bio & Medical Technology Development Program of the NRF (grant number
2017M3A9B6061852) funded by the Korean government, Ministry of Science and ICT. E.E. was supported by National Science Foundation grants 0513612, 0731455, 0729049, 0916676, 1065276, 1302448, 1320589, 1331176, and 1815624, and National Institutes of Health grants K25-HL080079, U01-DA024417, P01-HL30568, P01-HL28481, GM083198, ES021801, R01-MH101782, and R01-ES022282. E.E. was supported in part by the NIH BD2K award, U54EB020403. We acknowledge the support of the NINDS Informatics Center for Neurogenetics and Neurogenomics (P30 NS062691).
Availability of data and materials
The Genomic GPS is available athttps://github.com/hanlab-SNU/ GenomicGPS[12] under the MIT license (Software DOI:https://doi.org/10.52 81/zenodo.3255141[13]). Genotype data for 1000Genomes Phase 1 was downloaded fromhttp://www.cog-genomics.org/plink/1.9/resources. Imputed haplotype data of 1000Genomes Phase 3 was downloaded from ftp://ftp.1000genomes.ebi.ac.uk/vol1/ftp/release/20130502/[5]. WTCCC data used for sample overlap simulation can be accessible via EGA accession number EGAD00000000001 for 1958 British Birth Cohort and
EGAD00000000008 for Type 1 Diabetes (T1D) samples (https://www.ebi.ac.uk/ ega/datasets) [7]. POPRES data used for PC map analysis is accessible via dbGaP Study accession number phs000145.v4.p2 (https://www.ncbi.nlm.nih. gov/projects/gap/cgi-bin/study.cgi?study_id=phs000145.v4.p2) [10]. Detailed description of datasets used in this research can be found in
Additional file1: Supplementary Note.
Ethics approval and consent to participate Not applicable.
Consent for publication Not applicable. Competing interests
The authors declare that they have no competing interests. Author details
1Department of Biomedical Sciences, Asan Medical Center, AMIST, University of Ulsan College of Medicine, Seoul, South Korea.2Department of Mathematical Science, KAIST, Daejeon, South Korea.3Department of Medical Sciences, Seoul National University College of Medicine, Seoul, South Korea. 4Department of Convergence Medicine, University of Ulsan College of Medicine, Asan Medical Center, Seoul, South Korea.5Department of Computer Science and Human Genetics, University of California Los Angeles, Los Angeles, CA, USA.6Department of Computational Medicine, University of California Los Angeles, Los Angeles, CA, USA.
Received: 31 October 2018 Accepted: 13 August 2019
References
1. Erlich Y, Narayanan A. Routes for breaching and protecting genetic privacy. Nat Rev Genet. 2014;15(6):409–21.
2. Gymrek M, McGuire AL, Golan D, Halperin E, Erlich Y. Identifying personal genomes by surname inference. Science. 2013;339(6117):321.
3. He D, Furlotte NA, Hormozdiari F, Joo JWJ, Wadia A, Ostrovsky R, et al. Identifying genetic relatives without compromising privacy. Genome Res. 2014;24(4):664–72.
4. Mantilla-Gaviria I, Leonardi M, Galati G, Balbastre J. Localization algorithms for multilateration (MLAT) systems in airport surface surveillance. SIViP. 2014;9:1–10. 5. The 1000 Genomes Project Consortium. A global reference for human
genetic variation. Nature. 2015;526:68–74.
6. Yang J, Lee SH, Goddard ME, Visscher PM. GCTA: a tool for genome-wide complex trait analysis. Am J Hum Genet. 2011;88(1):76–82.
7. The Wellcome Trust Case Control Consortium. Genome-wide association study of 14,000 cases of seven common diseases and 3,000 shared controls. Nature. 2007;447:661–78.
8. Novembre J, Johnson T, Bryc K, Kutalik Z, Boyko AR, Auton A, et al. Genes mirror geography within Europe. Nature. 2008;456(7218):98–101. 9. Yang W-Y, Novembre J, Eskin E, Halperin E. A model-based approach for
analysis of spatial structure in genetic data. Nat Genet. 2012;44(6):725–31. 10. Nelson MR, Bryc K, King KS, Indap A, Boyko AR, Novembre J, et al. The
population reference sample, POPRES: a resource for population, disease, and pharmacological genetics research. Am J Hum Genet. 2008;83(3):347–58. 11. Alexander DH, Novembre J, Lange K. Fast model-based estimation of
ancestry in unrelated individuals. Genome Res. 2009;19(9):1655–64. 12. Kim K, Baik H, Jang CS, Roh JK, Eskin E, Han B. Genomic GPS: using genetic
distance from individuals to public data for genomic analysis without disclosing personal genomes. Github. 2019; Available from:https://github. com/hanlab-SNU/GenomicGPS. Accessed 30 July 2019.
13. Kim K, Baik H, Jang CS, Roh JK, Eskin E, Han B. Genomic GPS: using genetic distance from individuals to public data for genomic analysis without disclosing personal genomes. Zenodo. 2019;https://doi.org/10.5281/ zenodo.3354656.
Publisher’s Note
Springer Nature remains neutral with regard to jurisdictional claims in published maps and institutional affiliations.