Optical clearing based cellular-level 3D
visualization of intact lymph node cortex
Eunjoo Song, Howon Seo, Kibaek Choe, Yoonha Hwang, Jinhyo Ahn, Soyeon Ahn, and Pilhan Kim*
Graduate School of Nanoscience and Technology, Korea Advanced Institute of Science and Technology (KAIST), Daejeon, 305-701, South Korea
*pilhan.kim@kaist.ac.kr
Abstract: Lymph node (LN) is an important immune organ that controls
adaptive immune responses against foreign pathogens and abnormal cells. To facilitate efficient immune function, LN has highly organized 3D cellular structures, vascular and lymphatic system. Unfortunately, conventional histological analysis relying on thin-sliced tissue has limitations in 3D cellular analysis due to structural disruption and tissue loss in the processes of fixation and tissue slicing. Optical sectioning confocal microscopy has been utilized to analyze 3D structure of intact LN tissue without physical tissue slicing. However, light scattering within biological tissues limits the imaging depth only to superficial portion of LN cortex. Recently, optical clearing techniques have shown enhancement of imaging depth in various biological tissues, but their efficacy for LN are remained to be investigated. In this work, we established optical clearing procedure for LN and achieved 3D volumetric visualization of the whole cortex of LN. More than 4 times improvement in imaging depth was confirmed by using LN obtained from H2B-GFP/actin-DsRed double reporter transgenic mouse. With adoptive transfer of GFP expressing B cells and DsRed expressing T cells and fluorescent vascular labeling by CD31 and anti-LYVE-1 antibody conjugates, we successfully visualized major cellular-level structures such as T-cell zone, B-cell follicle and germinal center. Further, we visualized the GFP expressing metastatic melanoma cell colony, vasculature and lymphatic vessels in the LN cortex.
©2015 Optical Society of America
OCIS codes: (170.3880) Medical and biological imaging; (170.1790) Confocal microscopy;
(170.3660) Light propagation in tissues; (170.6935) Tissue characterization.
References and links
1. A. Iwasaki and R. Medzhitov, “Regulation of adaptive immunity by the innate immune system,” Science
327(5963), 291–295 (2010).
2. J. Lian and A. D. Luster, “Chemokine-guided cell positioning in the lymph node orchestrates the generation of adaptive immune responses,” Curr. Opin. Cell Biol. 36, 1–6 (2015).
3. K. A. Soderberg, G. W. Payne, A. Sato, R. Medzhitov, S. S. Segal, and A. Iwasaki, “Innate control of adaptive immunity via remodeling of lymph node feed arteriole,” Proc. Natl. Acad. Sci. U.S.A. 102(45), 16315–16320 (2005).
4. E. Segura, J. Valladeau-Guilemond, M. H. Donnadieu, X. Sastre-Garau, V. Soumelis, and S. Amigorena, “Characterization of resident and migratory dendritic cells in human lymph nodes,” J. Exp. Med. 209(4), 653– 660 (2012).
5. H. Qi, J. G. Egen, A. Y. Huang, and R. N. Germain, “Extrafollicular activation of lymph node B cells by antigen-bearing dendritic cells,” Science 312(5780), 1672–1676 (2006).
6. T. G. Phan, I. Grigorova, T. Okada, and J. G. Cyster, “Subcapsular encounter and complement-dependent transport of immune complexes by lymph node B cells,” Nat. Immunol. 8(9), 992–1000 (2007).
7. R. P. Kataru, H. Kim, C. Jang, D. K. Choi, B. I. Koh, M. Kim, S. Gollamudi, Y. K. Kim, S. H. Lee, and G. Y. Koh, “T lymphocytes negatively regulate lymph node lymphatic vessel formation,” Immunity 34(1), 96–107 (2011).
Trends Immunol. 33(6), 271–280 (2012).
9. M. Zeng, A. T. Haase, and T. W. Schacker, “Lymphoid tissue structure and HIV-1 infection: life or death for T cells,” Trends Immunol. 33(6), 306–314 (2012).
10. K. W. Tan, K. P. Yeo, F. H. Wong, H. Y. Lim, K. L. Khoo, J. P. Abastado, and V. Angeli, “Expansion of cortical and medullary sinuses restrains lymph node hypertrophy during prolonged inflammation,” J. Immunol. 188(8), 4065–4080 (2012).
11. H. L. Robinson and R. R. Amara, “Protective immunity from a germinal center sanctuary,” Nat. Med. 18(11), 1614–1616 (2012).
12. S. Das, E. Sarrou, S. Podgrabinska, M. Cassella, S. K. Mungamuri, N. Feirt, R. Gordon, C. S. Nagi, Y. Wang, D. Entenberg, J. Condeelis, and M. Skobe, “Tumor cell entry into the lymph node is controlled by CCL1 chemokine expressed by lymph node lymphatic sinuses,” J. Exp. Med. 210(8), 1509–1528 (2013).
13. Y. Herishanu, P. Pérez-Galán, D. Liu, A. Biancotto, S. Pittaluga, B. Vire, F. Gibellini, N. Njuguna, E. Lee, L. Stennett, N. Raghavachari, P. Liu, J. P. McCoy, M. Raffeld, M. Stetler-Stevenson, C. Yuan, R. Sherry, D. C. Arthur, I. Maric, T. White, G. E. Marti, P. Munson, W. H. Wilson, and A. Wiestner, “The lymph node microenvironment promotes B-cell receptor signaling, NF-kappaB activation, and tumor proliferation in chronic lymphocytic leukemia,” Blood 117(2), 563–574 (2011).
14. M. Nakagawa, R. Schmitz, W. Xiao, C. K. Goldman, W. Xu, Y. Yang, X. Yu, T. A. Waldmann, and L. M. Staudt, “Gain-of-function CCR4 mutations in adult T cell leukemia/lymphoma,” J. Exp. Med. 211(13), 2497– 2505 (2014).
15. S. Kwon, G. D. Agollah, G. Wu, W. Chan, and E. M. Sevick-Muraca, “Direct visualization of changes of lymphatic function and drainage pathways in lymph node metastasis of B16F10 melanoma using near-infrared fluorescence imaging,” Biomed. Opt. Express 4(6), 967–977 (2013).
16. S. Y. Lee, Q. Chao-Nan, O. A. Seng, C. Peiyi, W. H. Bernice, M. S. Swe, W. J. Chii, H. S. Jacqueline, and S. K. Chee, “Changes in specialized blood vessels in lymph nodes and their role in cancer metastasis,” J. Transl. Med.
10(1), 206 (2012).
17. K. Kawada and M. M. Taketo, “Significance and mechanism of lymph node metastasis in cancer progression,” Cancer Res. 71(4), 1214–1218 (2011).
18. M. I. Harrell, B. M. Iritani, and A. Ruddell, “Tumor-induced sentinel lymph node lymphangiogenesis and increased lymph flow precede melanoma metastasis,” Am. J. Pathol. 170(2), 774–786 (2007).
19. S. Hirakawa, L. F. Brown, S. Kodama, K. Paavonen, K. Alitalo, and M. Detmar, “VEGF-C-induced lymphangiogenesis in sentinel lymph nodes promotes tumor metastasis to distant sites,” Blood 109(3), 1010– 1017 (2006).
20. M. J. Miller, S. H. Wei, I. Parker, and M. D. Cahalan, “Two-photon imaging of lymphocyte motility and antigen response in intact lymph node,” Science 296(5574), 1869–1873 (2002).
21. D. S. Richardson and J. W. Lichtman, “Clarifying Tissue Clearing,” Cell 162(2), 246–257 (2015).
22. E. A. Susaki, K. Tainaka, D. Perrin, F. Kishino, T. Tawara, T. M. Watanabe, C. Yokoyama, H. Onoe, M. Eguchi, S. Yamaguchi, T. Abe, H. Kiyonari, Y. Shimizu, A. Miyawaki, H. Yokota, and H. R. Ueda, “Whole-brain imaging with single-cell resolution using chemical cocktails and computational analysis,” Cell 157(3), 726–739 (2014).
23. H. U. Dodt, U. Leischner, A. Schierloh, N. Jährling, C. P. Mauch, K. Deininger, J. M. Deussing, M. Eder, W. Zieglgänsberger, and K. Becker, “Ultramicroscopy: three-dimensional visualization of neuronal networks in the whole mouse brain,” Nat. Methods 4(4), 331–336 (2007).
24. K. Becker, N. Jährling, S. Saghafi, R. Weiler, and H.-U. Dodt, “Chemical clearing and dehydration of GFP expressing mouse brains,” PLoS One 7(3), e33916 (2012).
25. L. Silvestri, A. Bria, L. Sacconi, G. Iannello, and F. S. Pavone, “Confocal light sheet microscopy: micron-scale neuroanatomy of the entire mouse brain,” Opt. Express 20(18), 20582–20598 (2012).
26. A. J. Moy, M. P. Wiersma, and B. Choi, “Optical histology: a method to visualize microvasculature in thick tissue sections of mouse brain,” PLoS One 8(1), e53753 (2013).
27. X. Guo, Z. Guo, H. Wei, H. Yang, Y. He, S. Xie, G. Wu, X. Deng, Q. Zhao, and L. Li, “In vivo comparison of the optical clearing efficacy of optical clearing agents in human skin by quantifying permeability using optical coherence tomography,” Photochem. Photobiol. 87(3), 734–740 (2011).
28. Y. Ding, J. Wang, Z. Fan, D. Wei, R. Shi, Q. Luo, D. Zhu, and X. Wei, “Signal and depth enhancement for in vivo flow cytometer measurement of ear skin by optical clearing agents,” Biomed. Opt. Express 4(11), 2518– 2526 (2013).
29. C. Yeo, H. Kang, Y. Bae, J. Park, J. S. Nelson, K. J. Lee, and B. Jung, “Development of an Optical Tissue Clearing Laser Probe System,” J. Opt. Soc. Korea 17(4), 289–295 (2013).
30. Y. Y. Fu, C. H. Lu, C. W. Lin, J. H. Juang, G. Enikolopov, E. Sibley, A. S. Chiang, and S. C. Tang, “Three-dimensional optical method for integrated visualization of mouse islet microstructure and vascular network with subcellular-level resolution,” J. Biomed. Opt. 15(4), 046018 (2010).
31. Y. Y. Fu, C. W. Lin, G. Enikolopov, E. Sibley, A. S. Chiang, and S. C. Tang, “Microtome-free 3-dimensional confocal imaging method for visualization of mouse intestine with subcellular-level resolution,”
Gastroenterology 137(2), 453–465 (2009).
32. A. J. Moy, P. C. Lo, and B. Choi, “High-resolution visualization of mouse cardiac microvasculature using optical histology,” Biomed. Opt. Express 5(1), 69–77 (2014).
organization in intact myocardial wall,” Microsc. Res. Tech. 71(7), 510–516 (2008).
34. C. Leahy, H. Radhakrishnan, and V. J. Srinivasan, “Volumetric imaging and quantification of cytoarchitecture and myeloarchitecture with intrinsic scattering contrast,” Biomed. Opt. Express 4(10), 1978–1990 (2013). 35. C. A. Murray, W. L. Leong, D. R. McCready, and D. M. Ghazarian, “Histopathological patterns of melanoma
metastases in sentinel lymph nodes,” J. Clin. Pathol. 57(1), 64–67 (2004).
36. J. L. Hood, R. S. San, and S. A. Wickline, “Exosomes released by melanoma cells prepare sentinel lymph nodes for tumor metastasis,” Cancer Res. 71(11), 3792–3801 (2011).
37. H. Peinado, M. Alečković, S. Lavotshkin, I. Matei, B. Costa-Silva, G. Moreno-Bueno, M. Hergueta-Redondo, C. Williams, G. García-Santos, C. Ghajar, A. Nitadori-Hoshino, C. Hoffman, K. Badal, B. A. Garcia, M. K. Callahan, J. Yuan, V. R. Martins, J. Skog, R. N. Kaplan, M. S. Brady, J. D. Wolchok, P. B. Chapman, Y. Kang, J. Bromberg, and D. Lyden, “Melanoma exosomes educate bone marrow progenitor cells toward a pro-metastatic phenotype through MET,” Nat. Med. 18(6), 883–891 (2012).
38. C. N. Qian, B. Berghuis, G. Tsarfaty, M. Bruch, E. J. Kort, J. Ditlev, I. Tsarfaty, E. Hudson, D. G. Jackson, D. Petillo, J. Chen, J. H. Resau, and B. T. Teh, “Preparing the “soil”: the primary tumor induces vasculature reorganization in the sentinel lymph node before the arrival of metastatic cancer cells,” Cancer Res. 66(21), 10365–10376 (2006).
39. H. Seo, Y. Hwang, K. Choe, and P. Kim, “In vivo quantitation of injected circulating tumor cells from great saphenous vein based on video-rate confocal microscopy,” Biomed. Opt. Express 6(6), 2158–2167 (2015). 40. Y. Hwang, J. Ahn, J. Mun, S. Bae, Y. U. Jeong, N. A. Vinokurov, and P. Kim, “In vivo analysis of THz wave
irradiation induced acute inflammatory response in skin by laser-scanning confocal microscopy,” Opt. Express
22(10), 11465–11475 (2014).
41. K. Choe, Y. Hwang, H. Seo, and P. Kim, “In vivo high spatiotemporal resolution visualization of circulating T lymphocytes in high endothelial venules of lymph nodes,” J. Biomed. Opt. 18(3), 036005 (2013).
1. Introduction
Lymph node (LN) is an important immune organ where foreign pathogens are recognized and adaptive immune responses are initiated [1–3]. To achieve prompt and efficient immune function, LN has highly organized complex 3D cellular-level structures composed of many subtypes of immune cells such as T/B lymphocytes, macrophages, dendritic cells and other stromal cells as well as the specialized vascular and lymphatic system [4–8]. After an immunogenic exposure to potential pathogen, LN undergoes intensive remodeling, which is revealed as increased lymph and blood flow, increased level of adhesion molecules at high endothelial venule, angiogenesis and lymphangiogenesis, lymphocytes accumulation and germinal center formation [9–11]. In addition, cancer cell metastasis to the LN via lymphatic system also induces dramatic remodeling of LN [12–15], which is shown to be correlated with distant organ metastasis [16–19].
There have been significant efforts to analyze the cellular-level 3D remodeling process of both immune/stromal cell distribution and lymphatic/vascular network in LN. Unfortunately, conventional histological analysis relying on thin-sliced tissue has critical limitations for 3D cellular-level analysis due to tissue damage/loss and structural disruption in the processes of fixation and tissue slicing. Imaging techniques capable of noninvasive optical sectioning such as laser-scanning confocal and two-photon microscopy have been utilized to analyze 3D structure of “intact” LN. Multiple sectioning images obtained by confocal microscopy can be used to reconstruct 3D structures of lymph node such as vascular/lymphatic network and immune cell distributions within the tissues. However, multiple light scattering within biological samples limits the maximum achievable imaging depth only to superficial portion of the LN cortex [20]. There exist significant needs to establish deeply penetrable 3D visualization technique to analyze the complicated 3D structures within the whole LN cortex.
For the last decade, optical clearing technique to improve the imaging depth has been actively investigated [21–34]. As the mismatch in refractive index (RI) between cellular components in tissue is the major cause of light scattering, selective removal of cellular components with relatively low or high refractive index can reduce the light scattering and make the tissue more optically transparent. The most frequently used approach is replacing interstitial fluids (RI~1.33) in inter- and intra-cellular space with optical clearing agents (OCAs) which have refractive indices of ~1.46, matched to the average refractive index of most biological samples. It has been demonstrated that several OCAs such as glycerol [26–
29], FocusClear [30–32] and BABB [33] can enhance imaging depth in various organs such as brain [22–26], skin [27–29], pancreas [30], colon [31] and heart [32–34]. However, optical clearing effect of OCAs on LN has not yet been clearly demonstrated.
In this work, we established an optical clearing procedure for LN and successfully visualized complex cellular-level structures, vascular/lymphatic networks, and metastasized cancer cells deep inside the whole cortex of intact LN in 3D by using a custom-built laser-scanning confocal microscopy system. By using optimized clearing condition, we visualized lymphocytes distributed as T-cell zone, B-cell follicle and germinal center in adoptive transfer model. We could also observed GFP+ microvesicle/exosome [35–38] and colony of GFP+
melanoma cells in LN metastasis model.
2. Experimental methods and materials 2.1 Lymph node sample
To examine the clearing effects of OCAs, subcutaneous lymph nodes dissected from a transgenic reporter mouse which universally expressed green fluorescence protein (GFP) in nuclei and red fluorescence protein (DsRed) in cytoplasm were used. This mouse was newly generated by crossbreeding H2B-EGFP mice (Stock number; 006069, Jackson Laboratory) with actin-DsRed mice (kindly provided by Dr. Koh, KAIST). To identify immune cellular-level structures in lymph node, we adoptively transferred B and T cells expressing fluorescent protein to a wildtype C57BL/6 recipient mouse. B and T cells were purified from spleen of an actin-GFP mouse (kindly provided by Dr. Koh, KAIST) and an actin-DsRed mouse by using negative isolation MACS kits (114.13D, Invitrogen, MAGM204, R&D system), respectively. 6 LNs (2 popliteal LNs, 2 inguinal LNs and 2 axillary LNs as shown in Fig. 1(a)) were harvested from the recipient mouse at 12 hours after the adoptive transfer to ensure sufficient time for transferred lymphocytes homing to LN. To label vascular or lymphatic network in LN, anti-CD31 (553708, BD Biosciences) or anti-LYVE1 (MAB2125, R&D systems) antibody conjugated with either Alexa Flour 555 (A20009, Invitrogen) or Alexa Flour 647 (A20006, Invitrogen) were administrated via intravenous and subcutaneous injection, respectively. Lymph node cancer metastasis model was established by injecting 1 million of B16F10-GFP melanoma cells into a footpad of three wildtype C57BL/6 mice, one for the examination at day 10 and two for the examination at day 14. At 10 and 14 days after the inoculation, ipsilateral popliteal LN was imaged as tumor-metastasized LN, while contralateral popliteal LN of the same mouse was imaged as a control for comparison.
2.2 Optical clearing procedure
Mouse was deeply anaesthetized with a mixture of Zoletil (30 mg/kg) and xylazine (10 mg/kg), then transcardially perfused with ice-cold phosphate buffered saline (PBS), followed by 4% wt/vol paraformaldehyde (PFA, diluted in PBS). To ensure GFP signal preservation, PBS and PFA were adjusted to pH 7.4. After the perfusion, subcutaneous inguinal, axillary and popliteal lymph nodes were dissected and further fixed by 4% PFA for 5-10 minutes as illustrated in Fig. 1(a). Then, lymph nodes were immersed into optical clearing agents (OCAs), 75% glycerol (diluted in distilled water; DW) for 30 minutes or FocusClear (CelExplorer) for 12 hours. Lymph node immersed in PBS for the same time duration was prepared as a control. Representative results were shown in Fig. 1(b).
Fig. 1. (a) Illustration of optical clearing procedure for LN; Transcardial perfusion with ice-cold PBS and 4% PFA, LN dissection, Fixation and Immersion to optical clearing agents (75% glycerol, Gly; FocusClear, FC). (b) Photograph of lymph node immersed in PBS or FocusClear for 12 hours.
2.3 Imaging system
Custom-built high-power laser-scanning confocal microscope which has been modified from previously constructed one by our group [39–41] was utilized to visualize the whole cortex of optically cleared intact lymph node. Three CW lasers at 488 nm (MLD488, Cobolt), 561 nm (Jive, Cobolt) and 640 nm (MLD640, Cobolt) were utilized as excitation source; 488 nm laser for GFP excitation, 561 nm for DsRed and Alexa Fluor 555, and 640 nm for Alexa Fluor 647. To implement 2D laser beam scanning, fast-rotating polygonal mirror (MC-5, aluminum coated, Lincoln Laser) and galvanometer driven scanning mirror (6230H, Cambridge Technology) were used. High-sensitive photomultiplier tubes (R9110, Hamamatsu) were employed to detect three-color fluorescence signals simultaneously. Band-pass filters were used as emission filter for each PMTs; (FF02-525/50, Semrock) for GFP fluorescence detection, (FF01-600/37, Semrock) for DsRed and Alexa Fluor 555, and (FF01-685/40, Semrock) for Alexa Fluor 647. To precisely adjust sample position, motorized XYZ translational stage (3DMS, Sutter Instrument) which has 1 μm resolution and 25 mm travel
was used. After acquired from the imaging system, images were then either mosaicked by Photoshop (Adobe), or reconstructed in 3D or XZ axis by ImageJ software (NIH).
3. Results
In this work, we applied optical clearing technique to intact lymph node and visualized 3D cellular-level structures, vascular/lymphatic network in the whole cortex of lymph node by using laser-scanning confocal microscopy. First, LN obtained from a transgenic reporter mouse expressing H2B-GFP in nuclei and actin-DsRed in cytoplasm was used to examine the clearing effect of OCAs, glycerol and FocusClear. Although there exists some variance in the degree of expression level between different types of cell, every cell in the lymph node express both of H2B-GFP and actin-DsRed. Therefore it could be a useful LN sample to demonstrate the imaging depth enhancement by comparing the images obtained at various depths. Optimal treatment condition for LN with each OCA was determined by comparing the clearing effect with different concentration (glycerol) and immersion duration (glycerol and FocusClear). Each condition was repeatedly tested by using three LN samples. Clearing efficacy of glycerol solution with concentration of 30%, 50%, 75% and 100% (vol% in DW) were examined with varying immersion duration of 15, 30, 60 and 90 minutes. Higher glycerol concentration resulted in more effective optical clearing. However, severe tissue damage was observed when 100% glycerol was used. Also immersion duration longer than 30 minutes resulted in reduced H2B-GFP and actin-DsRed intensity. By comparing imaging depth enhancement in LNs immersed with 30%, 50% and 75% glycerol solutions, we could determine that immersing samples in 75% glycerol solution for 30 minutes was the most effective condition as shown in Fig. 2. Also clearing efficacy of FocusClear with different immersion duration of 2, 4, 8, 12 and 24 hours was examined. Longer immersion duration with FocusClear resulted in more effective optical clearing. However, immersion duration longer than 12 hours induced increased autofluorescence with little improvement in imaging depth. By comparing imaging depth enhancement in LNs after the immersion for each durations, we could determine that immersion in FocusClear for 12 hours was most effective in terms of imaging depth enhancement.
Fig. 2. Comparison of clearing efficacy of glycerol solution with different (a) concentration and (b) immersion duration. Lymph node dissected from transgenic mouse expressing H2B-GFP (green) in nuclei and actin-DsRed (red) in cytoplasm was imaged. Scale bar, 50 μm.
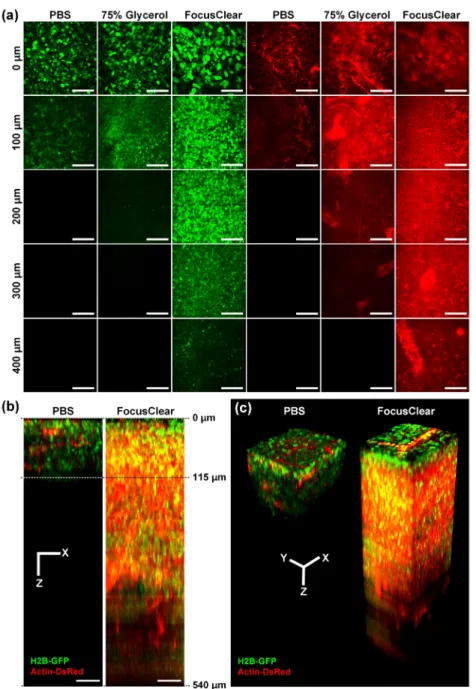
Figure 3(a) shows representative images obtained from LNs immersed in PBS, 75% glycerol, or FocusClear at various depths from the surface. We can distinguish individual H2B-GFP expressing nucleus in LNs immersed in FocusClear up to 400 μm as shown in Fig. 3(a). Because H2B-GFP fluorescence signal intensity varies with cell types, at deep depth of 400 μm to 500 μm, only brightly H2B-GFP expressing nuclei were distinguishable.
Fig. 3. Visualization of intact popliteal lymph node dissected from transgenic mouse expressing H2B-GFP (green) in nuclei and actin-DsRed (red) in cytoplasm. (a) Clearing effect of 75% glycerol and FocusClear. Images were taken at same depth from the surface. Scale bar, 50 μm. (b) XZ projection and (c) 3-Dimensional reconstruction of LN immersed in PBS or FocusClear generated from Z-stack imaging data (Visualization 1 and Visualization 2). Scale bars, 50 μm.
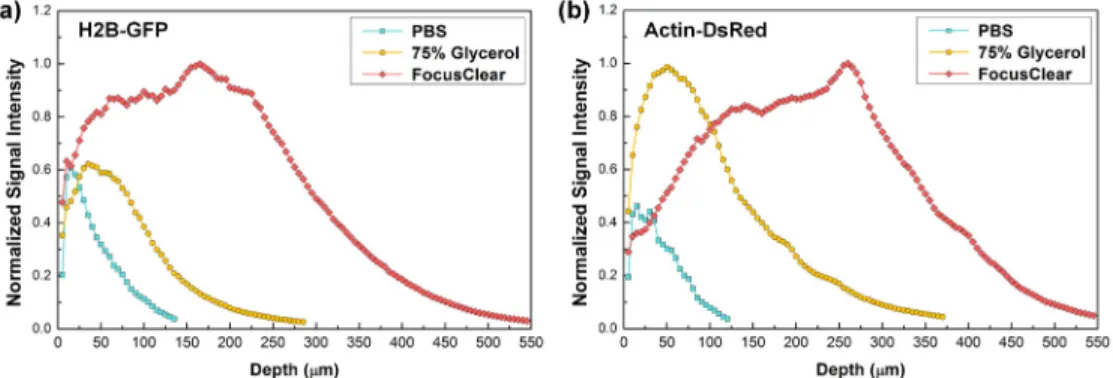
Figure 3(b) and 3(c) show x-z projection and 3D rendered image of lymph node treated by PBS or FocusClear, which is generated from Z-stack imaging data obtained with 5 μm step size (Visualization 1 and Visualization 2). To compare the maximum achievable imaging depth with each OCAs, the same laser excitation power and detector sensitivity were used to acquire the image from each treated LN. Figure 4 shows normalized signal intensity of H2B-GFP and actin-DsRed from the images obtained at each depth, which is derived from the Z-stack imaging data. Actin-DsRed signal could be detected at deeper depth than H2B-GFP signal, due to its longer excitation and emission wavelength with less light scattering. Maximum imaging depth was determined at which depth the detected signal intensity became lower than 1.5 times of noise background (0.05 at normalized scale). Imaging depth of control sample immersed in PBS was 115 μm for actin-DsRed signal. In comparison, the imaging depth of lymph node was enhanced up to 360 μm and 540 μm for actin-DsRed signal when treated with 75% glycerol and FocusClear, respectively. It clearly shows that more than 4 times enhancement in imaging depth can be achieved from the optically cleared LN by FocusClear.
Fig. 4. Normalized signal intensity of (a) H2B-GFP and (b) actin-DsRed at each depth.
To visualize the immune cell distributions within LN, we adoptively transferred GFP expressing B cells and DsRed expressing T cells to wildtype recipient mouse. Figure 5 is the result of visualization of immune cellular-level structures in optically cleared inguinal lymph node showing adoptively transferred B cells (green), and T cells (red). Figure 5(a) shows the representative images at various depths from the Z-stack imaging data obtained with 5 μm step size (Visualization 3). Immune cell distributions such as B cell follicle (arrowhead) tightly packed with GFP expressing B cells at the cortex, germinal center (arrow) revealed as dark area devoid of B cells at the center of B cell follicle, T cell zone (asterisk) holding numerous DsRed expressing T cells could be clearly identified. Figure 5(b, c) shows mosaic image of whole lymph node at different depths. Multiple B cell follicles with germinal center and sparsely distributed T cells in between them were clearly identified as shown in Fig. 5(b). At higher magnification, individual cells consisting B cell follicle and small number of cortical T cells were identified. At deeper depth, we observed a large reservoir of T cells occupying the most of the paracortex space, which corresponds to T cell zone. In the upper magnified image, only sparsely distributed B cells were visible. In the lower magnified image, transverse plane distribution of B cell follicle with developed germinal center at the cortex and T cell zone at the paracortex could be identified in detail.
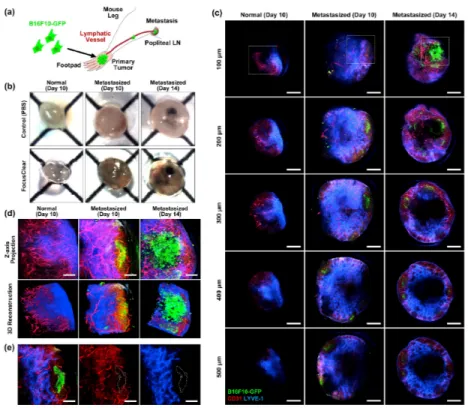
Finally, cancer-metastasized popliteal LN obtained from B16F10-GFP melanoma mouse model was visualized after optical clearing. Figure 6(a) illustrates the metastasis model for popliteal LN. Primary tumor was established by injecting 1 million B16F10-GFP melanoma cells into a footpad of wildtype C57BL/6 mouse. At 10 and 14 days after the injection, popliteal LN on the leg bearing the primary tumor was harvested. At the same time, as a control sample for the comparison, popliteal LN at the other leg of the same mouse was also
harvested. Before the dissection, we intravenously injected anti-CD31 antibody conjugated with Alexa Fluor 555 to systemically label blood vessels in LN. In addition, we subcutaneously injected anti-LYVE-1 antibody conjugated with Alexa Fluor 647 to footpad, which was delivered to LN and specifically label lymphatic sinus to be clearly distinguishable from blood vessels. Figure 6(b) is the photograph of melanoma-metastasized lymph node harvested at 10 or 14 days after the melanoma inoculation to footpad. Compared to translucent non-metastasized LN after optical clearing, melanoma-metastasized lymph nodes
Fig. 5. Visualization of immune cellular-level structures in inguinal LN showing adoptively transferred lymphocytes; B cells (green), and T cells (red). (a) Representative images of Z-stack imaging data (Visualization 3). Cellular-level structures such as B cell follicle (arrowhead), germinal center (arrow) and T cell zone (asterisk) are distinguishable. (b-c) Mosaic images showing whole inguinal lymph node structure at depth of (b) 65 μm, and (c) 160 μm from the surface. Dashed boxes marked the magnified area. Scale bars, (a) 200 μm, (b-c) 500 μm (mosaic image), 100 μm (magnified image).
were significantly enlarged and have brownish color due to hemorrhage. Black-colored small colony of melanoma metastasized to LN was clearly identifiable after 14 days. Figure 6(c) shows mosaic images showing whole LN obtained at various depths up to 500 μm. Additionally, to observe in more detail, Z-stack imaging data were also obtained at the area marked as dashed square (Visualization 4, Visualization 5, and Visualization 6). Figure 6(d) shows projection images and 3D-reconstructed images those are generated by using the Z-stack imaging data. Distribution of metastasized B16F10-GFP melanoma cells, CD31+ blood
vessels and LYVE-1+ lymphatic vessels were identifiable. At 10 days, several small-sized
colonies of GFP expressing cell bodies were visible. Figure 6(e) shows the vasculature and lymphatic network around the small-sized colony. The small-sized colonies were comprised of mostly small-sized GFP+ cell debris rather than intact GFP+ melanoma cell
(Visualization 5). These particles are apoptotic bodies, microvesicle or exosome drained from the primary tumor via lymphatic vessels and then localized near subcapsular area [35]. A larger colony was observed at 14 days after the inoculation. Different from the small-sized colony, it included numerous intact GFP+ melanoma cells (Visualization 6).
Notably, we could also observe numerous GFP+ cell debris near the colony, suggesting
active immune response potentially by Natural Killer cell or delivery of microvesicle/ exosome from primary tumor [36–38]. Moreover, there were many isolated GFP+
melanoma cells near the large colony, suggesting a dissemination of melanoma cell from the colony and invasion into lymph node stroma.
Fig. 6. Visualization of cancer-metastasized LN. (a) Illustration of popliteal LN metastasis model using B16F10-GFP melanoma cells. (b) Photograph of LN with melanoma metastasis immersed in PBS or FocusClear for 12 hours. (c) Serial depth images with 100 μm interval. Distribution of metastasized B16F10-GFP melanoma cells (green), blood vessels (CD31, red) and lymphatic vessels (LYVE-1, blue) are identifiable. (d) Projection and 3D reconstructed images generated by using Z-stack imaging data (Visualization 4, Visualization 5, and
Visualization 6) obtained at the area marked as dashed square in Fig. 6(c). (e) Vasculature/lymphatic network around the small-sized colony of GFP expressing cell bodies. Scale bars; (c) 500 μm, (d-e) 100 μm.
4. Conclusion
In this work, we applied an immersion-type optical clearing technique for lymph node and 3D visualized complex immune cell distributions, vascular/lymphatic networks, and metastasized cancer cells in the whole cortex of intact LN by using a custom-built confocal microscopy system. By imaging LNs obtained from a transgenic mouse expressing both H2B-GFP and actin-DsRed, we demonstrated more than 4 times enhancement in imaging depth. With adoptive transfer of GFP expressing B cells / DsRed expressing T cells and antibody based fluorescent labeling, we successfully achieved 3D visualization of major cellular-level structures in LN such as T-cell zone, B-cell follicle and germinal center more than 300 μm in depth. Finally, we visualized cancer-metastasized LNs dissected from cancer mouse model bearing B16F10-GFP melanoma more than 400 μm in depth. Interestingly, we could observe numerous GFP positive particles accumulated near the subcapsular space at preceding the establishment of large metastasized cell colony, which might include apoptotic bodies, microvesicle or even exosome promptly drained from the primary tumor through lymphatic vessels. At later time point, a well-established large colony comprising numerous GFP+
melanoma cells was clearly visualized. Collectively, these results demonstrate the usefulness of optical clearing technique combined with sectioning optical microscopy for the investigation of complex 3D immune/stromal cellular-level structures as well as lymphatic/vascular network in LN.
Acknowledgment
This work was supported by the World Class Institute program (WCI 2011-001), the Engineering Research Center program (NRF-2009-0083512), the Global Frontier Project (NRF-M1AXA002-2012M3A6A4054261) of National Research Foundation of Korea and the Converging Research Center Program (2011K000864) funded by the Ministry of Science, ICT and Future Planning, Republic of Korea and the Korea Healthcare Technology R&D Project funded by Ministry of Health and Welfare, Republic of Korea (HN12C0063, HI13C2181).