Machine Learning-Based
Techniques of Anomaly
Detection
- As Applied to Health and Welfare Data
Miae Oh ․ Ah-Yeon Park ․Jaehyun Jin
Machine Learning-Based Techniques of Anomaly Detection: As Applied to Health and
Welfare Data
ⓒ 2019
Korea Institute for Health and Social Affairs
All rights reserved. No Part of this book may be reproduced in any form without permission in writing from the publisher
Korea Institute for Health and Social Affairs Building D, 370 Sicheong-daero, Sejong city 30147 KOREA
http://www.kihasa.re.kr
ISBN: 978-89-6827-595-1 93510
【Principal Researcher】
Miae Oh Research Fellow, Korea institute for Health and
Social Affairs
【Publications】
A study on the Micro data linkages to promote the production and utilization of health and welfare statistics, Korea institute for Health and Social Affairs (KIHASA), 2014 (author)
Machine Learning-Based Models for Big Data Analysis and Prediction - Social Security Applications, Korea institute for Health and Social Affairs (KIHASA), 2018 (author)
【Co-Researchers】
Ah-Yeon Park Research Fellow, Korea institute for Health
and Social Affairs
Jaehyun Jin Senior Research, Korea institute for Health and
Contents
Ⅰ. Introduction ···1
Ⅱ. Conceptualization ···7
1. Anomaly Detection: Definition and Conceptualization ···9
2. Factors of Anomaly Detection ···11
Ⅲ. Exploratory Analysis of Anomaly Detection in
Health Data ···15
1. Anomaly Detection in FDG-PET Data for Early Diagnosis of Alzheimer’s Disease ···17
2. Analysis Overview ···18
3. Analysis Outcomes ···20
4. Implications ···24
Ⅳ. Exploratory Analysis of Anomaly Detection in
Welfare Data ···27
1. Data Overview ···31
2. Defining Anomalies ···32
3. Exploratory Data Analysis ···33
Ⅴ. Conclusion ···45
References ···51
Korea Institute for Health and Social Affairs
List of Tables
〈Table 3-1〉 Health Analysis Conceptual Map ···18 〈Table 3-2〉 Analysis of the Classifications of Patients Predicted to
Progress to Alzheimer’s Disease ···21 〈Table 4-1〉 Welfare Analysis Conceptual Map ···29 〈Table 4-2〉 Definition of Anomalies in Welfare Data ···33 〈Table 4-3〉 Percentages of Seniors with Abuse Experiences in Clusters
Defined by the Mixture Model ···35 〈Table 4-4〉 Cross Tabulation of the Four Groups and Clusters of
Seniors ···35 〈Table 4-5〉 Cross Tabulation of Clusters with the 100 Greatest LOFs
and the Two Groups of Seniors Who Have Not Experienced Abuse ···36 〈Table 4-6〉 Cross Tabulation of Clusters with the 100 Greatest LOFs
and the Two Groups of Seniors Who Have Experienced Abuse ···37
List of Figures
〔Figure 2-1〕 Classification vs. Anomaly Detection ···9 〔Figure 2-2〕 Examples of Anomalies in Two-Dimensional Data ···10 〔Figure 3-1〕 ROC Curves of the Predictive Classification of Patients
Diagnosed with Alzheimer’s Disease ···23 〔Figure 3-2〕 Predicted Conversion Probabilities ···24
〔Figure 4-1〕 t-SNE Analysis of Seniors Who Have Not Experienced Abuse (Classification Results) ···38 〔Figure 4-2〕 t-SNE Analysis of Seniors Who Have Not Experienced
Abuse (DBSCAN Results) ···39 〔Figure 4-3〕 t-SNE Analysis of Seniors Who Have Experienced Abuse
(Classification Results) ···40 〔Figure 4-4〕 t-SNE Analysis of Seniors Who Have Experienced Abuse
Machine learning is a subfield of the growing research on ar-tificial intelligence (AI). Specifically, it focuses on the develop-ment of algorithms and technology that enable computers to learn independently using data. Machine learning, widely re-garded as instrumental in advancements in image processing, video and voice recognition, and Internet searches, has proven to be quite effective as a tool for anomaly prediction and detection.
Anomaly detection refers to the process by which one finds instances or data, out of a given pool, that diverge from ex-pected patterns. The targets of such detection process are var-iably and interchangeably known as anomalies, outliers, dis-cordant observations, exceptions, aberrations, surprises, pecu-liarities, and contaminants. The scope of the technology’s ap-plication has been consistently widening, coming to include fraud detection, invasion detection, safety-critical systems, and military surveillance.
Events caused by malicious intent, such as credit card fraud, cyberattacks, and acts of terrorism, as well as system break-downs and other abnormal situations, can have far-reaching and profoundly detrimental effects on people’s daily lives. It
<<
4 Machine Learning-Based Techniques of Anomaly Detection: As Applied to Health and Welfare Data
has therefore become crucial for governments, public organ-izations, and businesses to detect and prevent these anomalies in order to contain or minimize related losses.
When applied to health and social policies, anomaly de-tection can be used to find clients in serious need of policy support as well as clients making fraudulent and illegal claims for government benefits. One example of the former involves finding at-risk children by entering definitional criteria of dren being abused and comparing and analyzing at-risk chil-dren to chilchil-dren without exposure to such risks. As for the lat-ter, anomaly detection techniques can be applied to support various government departments’ systems for handling reports of claimants, and preventing claimants from, fraudulently re-ceiving National Basic Livelihood Security Program (NBLSP) benefits, daycare subsidies, disability benefits, and unemploy-ment benefits. While Korean ministries have sought to increase the detection of these wrongdoings by sharing and merging their administrative data, anomaly detection can still be used to conduct in-depth analyses that go beyond the identification of simple and general patterns.
Numerous anomaly detection techniques have been devel-oped to solve these policy problems. There is an almost infinite number of types of anomaly detection techniques, as there is a wide variety of different policy tasks to which they can be tailored. The purpose of this study is thus to provide a
system-Ⅰ. Introduction 5
atic and comprehensive overview of anomaly detection re-search so far. We examine various studies on anomaly de-tection, and explore the implications for improving techniques for detecting and solving health and social policy issues.
In this study, we first define the concept of anomaly de-tection, after which we apply the anomaly detection method-ology to the given sets of health and welfare policy data to per-form an exploratory analysis. Finally, we discuss the issues in-volved in the application of anomaly detection and summarize the policy implications. The data subjected to our analysis in-clude the fludeoxyglucose positron emission tomography (FDG-PET) data from the Alzheimer’s Disease Neuroimaging Initiative (ADNI), regarding health, and the results of the Elderly Survey 2017: Findings and Implications conducted by the Korea Institute for Health and Social Affairs (KIHASA) and the Ministry of Health and Welfare (MOHW), concerning welfare. We apply the anomaly detection methodology to these data using R (programming language) and Matlab.
Ⅱ
Conceptualization
1. Anomaly Detection: Definition and Conceptualization
1. Anomaly Detection: Definition and Conceptualization
1)As the concept of an anomaly is the opposite of “normalcy,” we first need to define what is normal in order to define what is abnormal. The definition of normalcy can vary widely from dis-cipline to disdis-cipline and problem to problem, and, accordingly, so can the definition of an anomaly.
The anomaly detection methodology we apply in this study involves conceptualizing an anomaly and basing the analysis models accordingly as opposites of the definition of normalcy given for each discipline or problem.
〔Figure 2-1〕 Classification vs. Anomaly Detection
Source: Jeong, J. (2017). Novelty Detection: Overview. Retrieved from https://jayhey.github.io/novelty%20detection/2017/10/18/Novelty_detection _overview/ in November 2018.
1) The examples and characteristics of anomaly detection cited herein were drawn largely from those presented in Chandola et al. (2009).
<<
10 Machine Learning-Based Techniques of Anomaly Detection: As Applied to Health and Welfare Data
If classification can be defined as the process of finding the border along which two or more categories can be dis-tinguished, anomaly detection can be understood as delimitat-ing the sectors of data of multiple categories that do not pres-ent anomalies.
Anomalies refer to instances, within the given pool of data, that do not conform to clearly defined normal patterns. Figure 2-2 illustrates anomalies in two-dimensional data. The two sec-tors, N1 and N2, are sectors of normal data that encompass most of the displayed points. Points O1 and O2, which are situ-ated far from these normal sectors, and the points in sector O3 are anomalies.
〔Figure 2-2〕 Examples of Anomalies in Two-Dimensional Data
Source: Chandola, V., Banerjee, A., and Kumar, V. (2009). Anomaly detection: A survey. ACM computing surveys (CSUR), 41(3), 15. p. 2.
Ⅱ. Conceptualization 11
Noise removal (Teng et al., 1990) and adjustment (outlier de-tection) (Rousseeuw and Leroy, 1987) are closely related to anomaly detection, but cannot be equated with it. Noise is not a subject of interest for analysts; it is simply an obstacle to analysis that analysts seek to eliminate. Noise removal, in other words, involves eliminating unnecessary instances or components in the pre-analysis phase. Outlier detection involves minimizing the impacts of outliers on statistical estimates (Huber, 2011).
2. Factors of Anomaly Detection
A. Characteristics of Input Data
Input Data are a pool of instances subjected to the given analysis (Tan et al., 2005), with each instance being an ex-pression of one or more attributes or variables. Specific techni-ques of anomaly detection to apply vary depending on the characteristics of the attributes or variables of the given data. For example, the majority of statistical models can be used with only continuous or categorial types of data. k-NN-based tech-niques require additional definitions of the distances between instances. Most statistical techniques cannot be applied to data presented in the form of distance matrices or similarity ma-trices, rather than specific values of the data themselves. Input
12 Machine Learning-Based Techniques of Anomaly Detection: As Applied to Health and Welfare Data
data can also be categorized depending on whether the in-stances presented together bear correlations to one another (Tan et al., 2005). Most methodologies are for record or point data that are believed to bear little correlation to one another. However, studies have been conducted concerning data with mutually correlated instances, such as sequential data, spatial data, and graph data.
B. Types of Anomalies
1) Point Anomalies
Point anomalies are single instances that are determined to be abnormal in relation to the rest of the instances making up the given pool of data. See points O1 and O2 and sector O3 in Figure 2-2 for an example.
2) Contextual Anomalies
Contextual anomalies are instances within the given pool of data that can be regarded as abnormal in certain contexts. These contexts are defined using the contextual and behavioral attributes outlined below:
Contextual attributes or variables are those that define a given context or its neighborhood. Examples include the longitudes and latitudes of spatial data and hours of time data.
Ⅱ. Conceptualization 13
indicate non-contextual characteristics. Examples include the amount of precipitation at each location in average precipitation data.
Anomalies can be determined in reference to the values or scores of behavioral variables under the given context. Contextual anomalies are most commonly detected in time da-ta (Weigend et al., 1995; Salvador and Chan, 2003) and spatial data (Kou et al., 2006; Shekhar et al., 2001). An outside temper-ature of 35ºF (1.7ºC) would not be abnormal during winter, but would be quite abnormal during summer.
Analysts decide whether to apply the contextual anomaly de-tection techniques depending on how meaningful the textual anomalies are and how easy it is to identify the con-textual attributes, with respect to the given data or subject matter.
C. Data Labels
Labels indicate whether the given instances of data are abnormal. It takes immense effort and cost to assign labels to all anomalies detected in the training data. It is even more dif-ficult to classify and label all possible types of anomalies. When anomalies occur only very rarely or anomalies of un-precedented types are detected, it is nearly impossible to
14 Machine Learning-Based Techniques of Anomaly Detection: As Applied to Health and Welfare Data
match such anomalies with other instances of similar types. In practice, analysts are often required to handle data in the ab-sence of label information. Depending on the degree of such absence, anomaly detection can be categorized into three areas: supervised anomaly detection, semi-supervised anomaly detection, and unsupervised anomaly detection.
D. Outputs of Anomaly Detection Models
The output value or score of a given anomaly detection mod-el is used to determine whether each instance in the data is abnormal. To this end, one may either calculate the outlier score or anomaly score for each instance when instances are ordered by size or assign the normal or abnormal label to each instance. Before using an outlier score, the analyst must set the specific border along which normal and abnormal are to be distinguished. In assigning labels, by contrast, the analyst can switch the normalcy-anomaly border by readjusting the param-eters or hyper-paramparam-eters of the given model.
Ⅲ
Exploratory Analysis of
Anomaly Detection in
Health Data
1. Anomaly Detection in FDG-PET Data for Early Diagnosis of Alzheimer’s Disease
2. Analysis Overview 3. Analysis Outcomes 4. Implications
1. Anomaly Detection in FDG-PET Data for Early
Diagnosis of Alzheimer’s Disease
In this section, let us apply anomaly detection techniques to the given sets of health and welfare policy data and explore the applicability of anomaly detection for policymaking purposes. With the Korean population now aging at an accelerated rate, the Korean government will be forced to expand the range of policy support for seniors in the coming years. A growing eld-erly population significantly increases the need for care serv-ices, including those for the elderly suffering from senile de-mentia and those that protect seniors from abuse. We thus fo-cus our attention on seniors in this analysis and use the FDT-PET data from the ADNI for the early diagnosis of Alzheimer’s disease.
The data, concept of an anomaly, analysis process, and sig-nificance of the outcomes concerning the Alzheimer’s disease neuroimaging data are summarized in Table 3-1 below.
<<
Exploratory Analysis of
Anomaly Detection in
Health Data
18 Machine Learning-Based Techniques of Anomaly Detection: As Applied to Health and Welfare Data
〈Table 3-1〉 Health Analysis Conceptual Map
Subject Type Description
Data Used data ADNI’s FDG-PET imaging data (converted into images) and scalar data
Concepts
Anomaly Patient whose status has change from having MCI to having Alzheimer’s disease Normalcy
Patient whose status has not changed from having MCI to having Alzheimer’s disease Process Identifying data attributes to determine type of anomaly detection techniques to apply
Data characteristics: scalar and image Anomaly type: point anomaly
Data label: supervised anomaly detection Model output: normal/abnormal label assigned
Anomaly detection techniques used
1. Spectral anomaly detection: PCA 2. Classification-based anomaly detection: Lasso Analysis outcomes Accuracy Sensitivity Specificity AUC Significance Applicability
Analyzing imaging data together with scalar data can enhance the capacity for the prediction and early diagnosis of Alzheimer’s disease. This signifies the importance of analyzing informal as well as formal data using anomaly detection techniques.
2. Analysis Overview
We apply the FDG-PET imaging data from the ADNI to our analysis and predict and classify patients who experience mild cognitive impairment (MCI) and are diagnosed with Alzheimer’s disease within three years.
Ⅲ. Exploratory Analysis of Anomaly Detection in Health Data 19
The FDG-PET of each instance used to predict whether the instance will be diagnosed with Alzheimer’s disease in three years is a three-dimensional image. These images are pre-processed and converted into numeric data that are 126x126x96 in size. These preprocessed data can be downloaded from the ADNI’s online database at http://adni.loni.usc.edu/da-ta-samples/. The smallest unit of three-dimensional image data is known as a voxel.2) There are thus 1,524,096 (126x126x96) voxels making up the FDG-PET image of each instance in our analysis. For our purposes, we limited our focus to the lower portion of the brain in these three-dimensional brain images, where the posterior cingulate cortex (PCC) is located. Therefore, of the available 3D data, we exclusively used Axial Slice No. 60.3) The total number of voxels used in our analysis is thus 15,876 (126x126).
The response variable we used, indicating whether each pa-tient has converted into an Alzheimer’s disease papa-tient, is a bi-nary variable indicated as either one (1; converted) or zero (0; unconverted). The conversion of each patient is assessed in re-lation to a point in time three years after he or she was sub-jected to the FDG-PET scan. Other factors correlated to the on-set of Alzheimer’s disease, such as sex, age, genotypes, and Mini-Mental State Examination (MMSE) scores, were also
in-2) That is, a three-dimensional analog of a pixel.
20 Machine Learning-Based Techniques of Anomaly Detection: As Applied to Health and Welfare Data
cluded in our analysis as control variables.
In our analysis, we define patients who progressed from hav-ing MCI to havhav-ing Alzheimer’s disease in three years as abnor-mal, and patients who did not progress from having MCI to having Alzheimer’s disease as normal. Alzheimer’s disease causes extensive damage to brain cells, making patients’ brains “abnormal” relative to people without the disease.
3. Analysis Outcomes
Our analysis involved a total of 398 instances, 120 of which were patients whose status changed from having MCI to having Alzheimer’s disease in three years, while the remaining 278 pa-tients did not experience such conversion. The annual con-version rate is roughly 10 percent of instances. In categorizing patients according to their conversion status, we also compare the classification accuracy of models using both image and scalar data and models using only either type of data. This is to determine the significance and usefulness of subjecting brain imaging data to analysis in the early diagnosis of Alzheimer’s disease.
Ⅲ. Exploratory Analysis of Anomaly Detection in Health Data 21
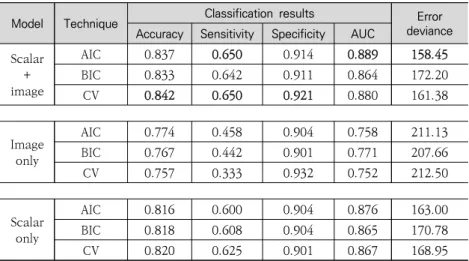
〈Table 3-2〉 Analysis of the Classifications of Patients Predicted to Progress to Alzheimer’s Disease
Model Technique Classification results devianceError Accuracy Sensitivity Specificity AUC
Scalar + image AIC 0.837 0.650 0.914 0.889 158.45 BIC 0.833 0.642 0.911 0.864 172.20 CV 0.842 0.650 0.921 0.880 161.38 Image only AIC 0.774 0.458 0.904 0.758 211.13 BIC 0.767 0.442 0.901 0.771 207.66 CV 0.757 0.333 0.932 0.752 212.50 Scalar only AIC 0.816 0.600 0.904 0.876 163.00 BIC 0.818 0.608 0.904 0.865 170.78 CV 0.820 0.625 0.901 0.867 168.95
Table 3-2 shows the outcomes of our analysis predicting whether MCI patients would be converted into Alzheimer’s dis-ease patients in three years using the 10-fold cross-validation (CV) technique. We attempted to predict the conversion using different instances for determining the fit of the model and making the prediction. The discrimination threshold used to estimate the accuracy, sensitivity, and specificity of the classi-fication results in Table 3-2 was 0.5.
Let us compare the AIC models in terms of sensitivity first. The scalar-only model4) has a sensitivity score of 0.6, while the model using both the scalar and FDG-PET image data has a
4) The scalar variables are age, education (number of years), sex, genotype (ApoE4), and MMSE scores.
22 Machine Learning-Based Techniques of Anomaly Detection: As Applied to Health and Welfare Data
score of 0.65. For every 1,000 MCI patients who are converted into Alzheimer’s disease patients in three years, the scalar-only model can predict 600 of them, while adding the image data can raise that result to 650, affording more timely intervention for 50 more patients.
In terms of accuracy, the scalar-only model’s Akaike in-formation criterion (AIC) score is 0.816, while the model using both scalar and image data has an AIC score of 0.837. This means that the latter model can classify 21 more patients accu-rately than the former model from among 1,000 patients whose status changed.5)
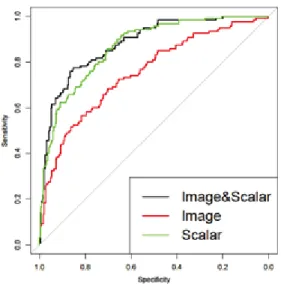
Figure 3-1 shows ROC curves that visualize the changes in the sensitivity and specificity of predictive analyses when the discrimination threshold is raised from zero to one. The closer the curve is to the upper left corner, the more predictive the model is. At most thresholds, the model using both image and scalar data has stronger predictive power than the models us-ing only either type of data.
5) Based on the ratios of actual conversions to conversion classifications and actual non-conversions to non-conversion classifications.
Ⅲ. Exploratory Analysis of Anomaly Detection in Health Data 23
〔Figure 3-1〕 ROC Curves of the Predictive Classification of Patients Diagnosed with Alzheimer’s Disease
Figure 3-2 visualizes the probabilities of Alzheimer’s disease conversion predicted with respect to each instance. All models tend to over-predict the actual numbers of patients who prog-ress from having MCI to having Alzheimer’s disease (coded as one and indicated as gray points). The conversion probabilities, in other words, tend to exceed the non-conversion proba-bilities (coded as zero and indicated as black points). The mod-el using both image and scalar data, however, appears to be better at classifying the converted and non-converted patients than the other two models. The model shows that the con-version probability of actually converted instances is closer to one, and the conversion probability of actually non-converted instances is closer to zero.
24 Machine Learning-Based Techniques of Anomaly Detection: As Applied to Health and Welfare Data
〔Figure 3-2〕 Predicted Conversion Probabilities
a. Image + scalar b. Image only c. Scalar only
4. Implications
In our analysis of early diagnoses of Alzheimer’s disease, we defined patients whose status changed from having MCI to hav-ing Alzheimer’s disease as anomalies, and patients whose status did not change as normal.
For our analysis, we translated three-dimensional video data into two-dimensional images and also made use of scalar data as variables. Our analysis amounted to a supervised anomaly detection of point-type anomalies. Applying the wavelet
trans-Ⅲ. Exploratory Analysis of Anomaly Detection in Health Data 25
formation and penalty methods, we analyzed the data in terms of its accuracy, sensitivity, specificity, and AUC.
Our analysis demonstrates that prediction of the onset of Alzheimer’s disease in patients with MCI is more accurate when demographic (scalar) factors and image data are considered together. In other words, it affirms the greater benefit that can be achieved by using both formal and informal types of data simultaneously.
Nevertheless, some limits must be acknowledged. The power of the predictive model, for instance, can vary depending on which anomaly detection method is used. The outcome of the analysis may also differ depending on which features of video data are used for its conversion into image data. Recognition of these limitations and possibilities is essential in further advanc-ing research in this area.
Ⅳ
Exploratory Analysis of
Anomaly Detection in
Welfare Data
1. Data Overview 2. Defining Anomalies 3. Exploratory Data Analysis 4. Implications
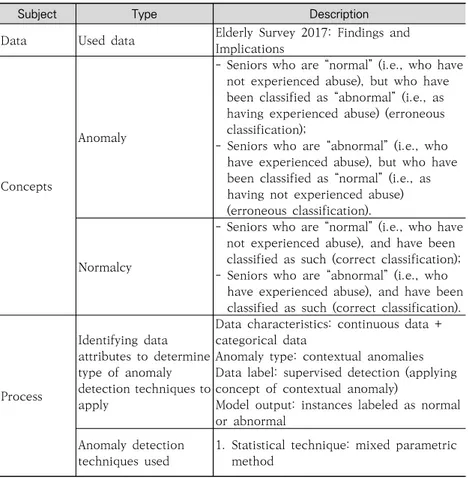
Subject Type Description Data Used data Elderly Survey 2017: Findings and
Implications
Concepts
Anomaly
- Seniors who are “normal” (i.e., who have not experienced abuse), but who have been classified as “abnormal” (i.e., as having experienced abuse) (erroneous classification);
- Seniors who are “abnormal” (i.e., who have experienced abuse), but who have been classified as “normal” (i.e., as having not experienced abuse) (erroneous classification).
Normalcy
- Seniors who are “normal” (i.e., who have not experienced abuse), and have been classified as such (correct classification); - Seniors who are “abnormal” (i.e., who
have experienced abuse), and have been classified as such (correct classification).
Process Identifying data attributes to determine type of anomaly detection techniques to apply
Data characteristics: continuous data + categorical data
Anomaly type: contextual anomalies Data label: supervised detection (applying concept of contextual anomaly)
Model output: instances labeled as normal or abnormal
Anomaly detection techniques used
1. Statistical technique: mixed parametric method
Table 4-1 summarizes the type of data, concept of an anom-aly, analytical process, and outcomes of the exploratory analy-sis of seniors’ exposure to abuse.
〈Table 4-1〉 Welfare Analysis Conceptual Map
<<
Exploratory Analysis of
Anomaly Detection in
Welfare Data
30 Machine Learning-Based Techniques of Anomaly Detection: As Applied to Health and Welfare Data
Subject Type Description
2. Nearest neighbor (NN)-based technique: LOF
3. Spectral technique: t-SNE
4. Clustering technique: DBSCAN algorithm
Analysis outcomes
1. Instances are divided into four classes to determine in which class(es) anomalies are detected.
2. 100 instances with top anomaly scores among seniors who have not
experienced abuse and 100 instances with top anomaly scores among seniors who have experienced abuse are plotted and analyzed in terms of attributes. 3. Plots are labeled as anomalies and
analyzed.
4. Clustering results are indicated with respect to plots and analyzed.
Significance Applicability
- Depending on the method of analysis, it may be possible to define the given data in terms of categories, intermediate categories, and subcategories. - Categories can be defined using
techniques 1 through 4 in a top-down manner.
- Subcategories can be defined using techniques 4 through 1 in a bottom-up manner.
- This implies that it is appropriate to apply different anomaly detection techniques at different stages in order to classify given data into categories or more specific groups.
Ⅳ. Exploratory Analysis of Anomaly Detection in Welfare Data 31
1. Data Overview
6)The Elderly Survey 2017: Findings and Implications is a major source of the data and information required to devise policy measures for improving the quality of life of seniors and man-aging Korea’s rapidly man-aging population. The accelerated pace at which the Korean population is aging and rapid increase in the number of seniors as well as their diversity have been rais-ing the demand for more diversified and specifically tailored policy measures. The 2017 survey explores the changes in se-niors’ characteristics and lifestyles, against the backdrop of greater social, economic, cultural, and policy trends, across a time series, with a view to elucidating the depth of diversity in the Korean elderly population.
The 2017 survey also contained questions on seniors’ experi-ences of abuse. In this section, we shall analyze the 2017 survey data on seniors’ experiences of abuse (y-value) in order to un-derstand the diverse characteristics of at-risk seniors. The causes of elder abuse can be roughly divided into: factors per-taining to seniors’ dependency on the help of others, including factors of seniors’ sociodemographic, economic, medical, and psychosocial functions; factors related to family circumstances; factors related to social relations; and sociocultural factors 6) Excerpted from Chung, K., Oh, Y., Kang, E., Kim, G., Lee, Y., Oh, M., Hwang, N., Kim, S., Lee, S., Lee, S., and Hong, S. (2017). Elderly Survey 2017: Findings and Implications. MOHW-KIHASA.
32 Machine Learning-Based Techniques of Anomaly Detection: As Applied to Health and Welfare Data
(Chung, 2017).
Our objective in this report is not to determine the exact cause(s) of elder abuse. Rather, we aim to define and detect “anomalies” in the 2017 survey data and conduct diverse analy-ses through the application of machine learning-based anom-aly detection techniques.
2. Defining Anomalies
Regarding the definition and conceptualization of anomaly points and values, we take an approach different from the one discussed in Section III regarding our health data analysis. Recall that, in Section III, we defined patients whose diagnoses had changed from mild cognitive impairment (MCI) to Alzheimer’s disease as anomalies. In a similar vein, we could define seniors who have experienced abuse as anomalies in this section. Instead, however, we take the approach of con-textual anomalies to our data on the elderly and define anoma-lies in light of the given contexts. Our model, in other words, is designed to predict the behavior of instances in relation to the given specific circumstances based on the data it has learned. A significant difference between the predicted value and ob-served value would then constitute an anomaly value. Applying contextual attributes to the prediction of behavioral attributes,
Ⅳ. Exploratory Analysis of Anomaly Detection in Welfare Data 33
we apply our predictive model to arrive at predicted values, af-ter which we define the instances in which the predicted values differ significantly from the observed ones as anomalies.
The predicted and observed values of response variables can be expressed as a binary classification matrix like the one shown in Table 4-2. Here, the concept of an anomaly includes both seniors who are “normal” (i.e., who have not experienced abuse) but are classified as “abnormal” (i.e., as having experi-enced abuse) (), and seniors who are “abnormal” (i.e., who have experienced abuse) but are classified as “normal” (i.e., as having not experienced abuse) ().
〈Table 4-2〉 Definition of Anomalies in Welfare Data
Predicted
Normal Abnormal (abused) Classification result
(“True”)
Normal
Abnormal (abused)
3. Exploratory Data Analysis
Let us apply anomaly detection techniques to the contextual anomalies in the elderly data we have defined and attempt an exploratory analysis. Here, we apply a total of four techniques: the mixed parametric method for statistical anomaly detection, local outlier factor (LOF) analysis for NN-based anomaly de-tection, t-distributed stochastic neighborhood embedding
34 Machine Learning-Based Techniques of Anomaly Detection: As Applied to Health and Welfare Data
(t-SNE) analysis for spectral anomaly detection, and den-sity-based spectral clustering of applications with noise (DBSCAN) analysis for clustering. We subject only the planatory variable information, without the information on ex-periences of abuse (), to analysis using these techniques, and compare the prediction results to the characteristics of the four groups of seniors.
A. Mixed Parametric Method
First, we apply the mixed parametric method to cluster the seniors into four classes. Class 1 consists of women exclusively, many of whom live alone without spouses or families, tend to have less education, experience limitations in terms of their health and everyday functions, and receive little in public transfers of income. Class 2 consists of men exclusively, many of whom are healthy and receive much in public transfers of income. Class 3 consists of seniors of both sexes who tend to experience more conflicts with grown children than do other seniors and also tend to have experienced abuse more than other seniors. Class 4 consists of seniors, many of whom live alone, receive much in private transfers of income, and policy support for the minimum cost of living.
Ⅳ. Exploratory Analysis of Anomaly Detection in Welfare Data 35
Variable Class 1 mean Class 2 mean Class 3 mean Class 4 mean
Experienced abuse .08 .07 .15 .10
〈Table 4-3〉 Percentages of Seniors with Abuse Experiences in Clusters Defined by the Mixture Model
〈Table 4-4〉 Cross Tabulation of the Four Groups and Clusters of Seniors
(Units: number of people, percentage) Clusters Groups Cluster class Total 1 2 3 4 Four groups 3676 (43.84%) 2469 (29.45%) 1937 (23.10%) 303 (3.61%) 8385 (100%) (6.06%)43 (1.27%)9 (85.19%))604 (7.48%)53 (100%)709 (46.37%)319 (25.73%)177 (23.40%)161 (4.51%)31 (100%)688 (3.65%)11 (0.33%)1 (92.69%)279 (3.32%)10 (100%)301
Cross tabulation of the four groups and clusters of seniors, de-fined using a contextual anomaly approach, shows that the and groups tend to overlap with Cluster 1, while the and groups tend to overlap with Cluster 3. This suggests sim-ilarities in characteristics between seniors who have not experi-enced abuse and are predicted as such () and seniors who have experienced abuse but are predicted not as such (). It al-so suggests the same similarities between seniors who have not experienced abuse but are predicted not as such () and seniors who have experienced abuse and are predicted as such ().
36 Machine Learning-Based Techniques of Anomaly Detection: As Applied to Health and Welfare Data
B. LOF Method
For the LOF analysis, we divide seniors into two datasets: those who have not experienced abuse and others who have experienced abuse. We then detect anomalies with respect to 100 seniors of each cluster with the greatest LOF values.
〈Table 4-5〉 Cross Tabulation of Clusters with the 100 Greatest LOFs and the Two Groups of Seniors Who Have Not Experienced Abuse
(Units: number of people, percentage) Clusters Groups Cluster class Total 1 2 3 4 Two groups 22 38 21 10 91 2 1 4 2 9 Total 24 39 25 12 100
A comparison of the groups and clusters with the greatest 100 LOFs shows that the vast majority (91 out of 100) of seniors who have not experienced abuse belong to the group predicted as such (). In this group, seniors receiving high levels of public income transfers―a continuous variable in our LOF analysis―are regarded as anomalies and reflect the character-istics of Cluster Class 2. Seniors who have not experienced abuse and are predicted as such (), on the other hand, are concentrated in Cluster Class 3. This result is similar to that of the exploratory analysis using the mixed parametric method.
We then analyze the LOFs of seniors who have experienced abuse. Specifically, we single out seniors with the greatest LOFs.
Ⅳ. Exploratory Analysis of Anomaly Detection in Welfare Data 37 Clusters Groups Cluster class Total 1 2 3 4 Two groups 20 20 19 8 67 1 0 31 1 33 Total 24 21 20 50 9
〈Table 4-6〉 Cross Tabulation of Clusters with the 100 Greatest LOFs and the Two Groups of Seniors Who Have Experienced Abuse
(Units: number of people, percentage)
The cross tabulation shows that, of the 100 seniors with the greatest LOFs, 67 are the instances of contextual anomalies that we have defined. In other words, the majority of seniors who have experienced abuse belong to the group of seniors predicted not to have experienced abuse (), while the ma-jority of seniors who have experienced abuse and are predicted as such () belong to Cluster 3.
This is an a-posteriori analysis of seniors with the 100 great-est LOFs conducted by cross-tabulating the two groups of se-niors defined earlier with clusters of sese-niors. Increasing the number of instances with significant LOFs included in the anal-ysis would yield results similar to the earlier analanal-ysis based on the mixed parametric model.
C. t-SNE and DBSCAN Methods
t-SNE, which is used to visualize and reduce the dimensions of data, estimates projected data of low dimensions by mini-mizing the Kullback-Leibler (KL) divergence between the
dis-38 Machine Learning-Based Techniques of Anomaly Detection: As Applied to Health and Welfare Data
tribution of raw data and distribution of data in a projected space. t-SNE applies non-parametric algorithms and is favored as a tool for analyzing high-dimension data. We apply a t-SNE model to seniors, divided between those who have not experi-enced abuse and those who have experiexperi-enced abuse, for fur-ther exploratory analysis. We also apply a DBSCAN algorithm, assuming that normalcies are concentrated in one or more clusters and anomalies do not belong to any of the clusters, to cluster seniors based on the outcome of the t-SNE analysis and explore their detailed characteristics.
〔Figure 4-1〕 t-SNE Analysis of Seniors Who Have Not Experienced Abuse (Classification Results)
Ⅳ. Exploratory Analysis of Anomaly Detection in Welfare Data 39
Coloring seniors who have not experienced abuse and are predicted as such () and seniors who have not experienced abuse but are predicted not as such () makes the difference apparent. The latter group, colored in dark blue, is clustered together here and there.
〔Figure 4-2〕 t-SNE Analysis of Seniors Who Have Not Experienced Abuse (DBSCAN Results)
Overlapping the DBSCAN results with the t-SNE results re-veals 152 clusters. We should analyze the purity of the () group (seniors who have not experienced abuse but are
pre-40 Machine Learning-Based Techniques of Anomaly Detection: As Applied to Health and Welfare Data
dicted not as such) among these clusters and examine clusters with high purity scores. The purity scores indicate the degrees to which the instances of a given category are detected in the given clusters.
〔Figure 4-3〕 t-SNE Analysis of Seniors Who Have Experienced Abuse (Classification Results)
The group of seniors who have experienced abuse but are predicted not as such (), colored in dark blue, is scattered across the map.
Ⅳ. Exploratory Analysis of Anomaly Detection in Welfare Data 41
〔Figure 4-4〕 t-SNE Analysis of Seniors Who Have Experienced Abuse (DBSCAN Results)
Overlapping the DBSCAN results with the t-SNE results re-veals 65 clusters. We calculate the purity scores of the se-niors (who have experienced abuse, but are predicted not as such) in these clusters and examine the clusters with high pu-rity scores.
42 Machine Learning-Based Techniques of Anomaly Detection: As Applied to Health and Welfare Data
hand, three clusters have purity scores of zero. This indicates that seniors who have experienced abuse but are predicted not as such are dispersed across multiple clusters.
4. Implications
Having defined contextual anomalies to detect seniors at risk of abuse, we applied mixed parametric, NN-based LOF, spec-tral t-SNE, and DBSCAN clustering techniques to the given data to conduct an exploratory analysis. First, we applied the mixed parametric method for the statistical detection of anomalies and examined anomalies found in the four classes using cross tabulation. Next, we divided seniors into those who have expe-rienced abuse and others who have not, and applied the NN-based LOF method to determine whether the seniors with the 100 greatest LOFs included the contextual anomalies of our definition. We also applied the t-SNE method to seniors de-pending on their experiences of abuse and visualized the cases that form the contextual anomalies of our definition. We then applied the DBSCAN method to examine the specific charac-teristics of the t-SNE-screened cases that formed contextual anomalies.
We can apply the mixed parametric model to determine the larger categories of the data; the LOF method to determine in-termediate categories in two stages; and the DBSCAN method
Ⅳ. Exploratory Analysis of Anomaly Detection in Welfare Data 43
to determine subcategories and their characteristics. In other words, when working with data from top down starting with main categories, we can start by applying the mixture model and then proceed to the LOF model and DBSCAN model, in that order. When working with data from bottom up starting with subcategories, we can begin by applying DBSCAN and then proceed to the LOF and mixture models, in that order. In de-ciding which techniques to use, we must consider the strengths and weakness of each.
Anomaly detection centrally involves the development of an analytical model capable of detecting instances in data, based on machine learning, that diverge from the majority of instances. Specifically, it is used when the overwhelming ma-jority of instances in a given data set can be classified as nor-mal, and only extremely few can be classified as abnormal. In reality, however, the number of instances classified as abnor-mal may be far more than just a few, and the concept of an anomaly can also be variably defined in light of the given prob-lem or purpose. As our exploratory analyses of anomaly de-tection in health and welfare data show, using not only formal data, but also informal data, such as images and videos, can go a long way toward enhancing the accuracy of anomaly de-tection results. Furthermore, more than one anomaly dede-tection technique can be applied to categorize data across multiple stages or levels, thereby refining the accuracy of the overall de-tection results.
Machine learning-based anomaly detection and related re-search can help increase the efficiency of public administration by helping policymakers find and implement effective policy measures. For instance, machine learning-based anomaly
de-<<
48 Machine Learning-Based Techniques of Anomaly Detection: As Applied to Health and Welfare Data
tection techniques can be applied to big data on the long-term absence and physical examination records of children to detect risks of child abuse. As child abuse cases suggest, it is difficult to detect children at risk of abuse by taking the conventional classification approach when only one or two children out of a thousand experience abuse. Anomaly detection can provide a useful solution to problems involving such grossly imbalanced data.
The health and social policymaking issue to which anomaly detection can be applied most fruitfully is the detection of wrongful claims of government benefits. Wrongful claims of government benefits result in the waste of fiscal resources for welfare, with the parties involved either falsifying their eligi-bility status or increasing the numbers of their clients in an at-tempt to claim greater welfare benefits, subsidies, grants, etc. from the government for services, welfare facilities, and medi-cal institutions.7) To detect and prevent this behavior, it is im-portant to classify such wrongful claims into types, identify their patterns over time, and analyze them in comparison to other related data.
Anomaly detection can also help strengthen the protection of personal information. As much of personal information is of a sensitive nature, privacy and personal information protection are important in health and social policymaking. Techniques 7) Bokjiro website (https://www.bokjiro.go.kr/wrsd/guide1.do).
Ⅴ. Conclusion 49
for protecting such sensitive information require statistical masking or other equivalent treatments of the given in-formation so that it cannot be linked to specific individuals. Anomaly detection can be used to identify specific individuals using such masked information. As the demand for data grows, statistical techniques for protecting personal information con-tinue to evolve. Anomaly detection techniques, too, will see growing demand in the coming years.
It is important to develop diverse methodologies for applying anomaly detection techniques to different policy ends. It is equally important to disseminate examples of the actual appli-cation of such techniques to policy ends among policymakers and researchers. Open disclosure of the data and analysis tech-niques used is critical to accelerate the pace of such dissemination.
In this era of big data, data holds immense value. Cutting-edge machine learning-based anomaly detection can make a significant contribution to enhancing the efficiency of policy and budget execution, making it possible for policy-makers to devise and implement predictable and well-tailored welfare measures.
Government of the Republic of Korea (Interdepartmental, 2017). Counteraction Plan for the Fourth Industrial Revolution.
MOHW (October 31, 2018). Retrieved from
http://bokjiro.go.kr/wrsd/guide1.do.
Chung, K., Oh, Y., Kang, E., Kim, G., Lee, Y., Oh, M., Hwang, N., Kim, S., Lee, S., Lee, S., and Hong, S. (2017). Elderly Survey 2017: Findings and Implications. MOHW-KIHASA.
Jeong, J. (2017). Novelty Detection: Overview. Retrieved from https://jayhey.github.io/novelty%20detection/2017/10/18/Novel ty_detection_overview/ (November 28, 2018).
Chandola, V., Banerjee, A., and Kumar, V. (2009). Anomaly detection:
A survey. ACM Computing Surveys (CSUR), 41(3), 15.