A Comprehensive Analysis of
Social Service Security in Korea
A Comprehensive Analysis of Social Service Security in Korea ⓒ 2019
Korea Institute for Health and Social Affairs All rights reserved. No Part of this book may be reproduced in any form without permission in writing from the publisher
Korea Institute for Health and Social Affairs Building D, 370 Sicheong-daero, Sejong city 30147 KOREA
http://www.kihasa.re.kr
ISBN: 978-89-6827-591-3 93330
【Publications】
Evaluation of the Community Investment Social Service Project in 2018, Ministry of Health and
Welfare(MOHW)‧Korea Institute for Health and Social Affairs (KIHASA), 2018(co-author)
Social welfare delivery system for optimizing public service use(II): A focus on the local governance for welfare services, Korea Institute for Health and Social Affairs (KIHASA), 2018(co-author)
Ⅰ. Introduction ···1
Ⅱ. Literature Survey ···7
Ⅲ. Research Method ···17
Ⅳ. Findings ···25
1. Security of Social Services from the Policy Perspective ·· 27
2. Security of Social Services from the User’s Perspective ·· 37
Ⅴ. Conclusion and Policy Implications ···43
〈Table 1〉 Social Service Programs of the National Government and
Its Agencies ···27
〈Table 2〉 Distribution of Social Service Programs by Target Population Age ···29
〈Table 3〉 Distribution of Social Service Programs by Criteria ···31
〈Table 4〉 Distribution of Social Service Programs by Function ···32
〈Table 5〉 Distribution of Households and Use of Social Services ···39
〈Table 6〉 Household Types and the Inclusiveness of Social Service Programs ···40
〈Table 7〉 Household Income Levels and the Inclusiveness of Social Service Programs ···41
〈Table 8〉 Single-Person Households and the Inclusiveness of Social Service Programs ···42
List of Figures 〔Figure 1〕 Distribution of Social Service Programs by Function and Age Group ···33
〔Figure 2〕 Average Breadths and Depths of Social Service Programs by Function ···37
Since the Korean Government in the mid-1990s launched its policy commitment to social services under the banner of so-cial investment, a decade has passed, and new policy tasks have emerged. Social services have been promoted as a sol-ution to a variety of “new” social problems, such as the declin-ing birth rates, population agdeclin-ing, growdeclin-ing poverty among the working class, and collapse of families, which the conventional welfare paradigm (social insurances, public assistance for the poor, etc.) was ill-fitted to address.
The changes that these social services have wrought in Korean society over the past decade indeed merit much attention. Elderly care and activity support for people with dis-abilities, for instance, have been at the forefront of the move-ment to “socialize” the function of care that families tradition-ally handled. A system of universal services, going above and beyond simply guaranteeing a minimum income for the poor, has been established and expanded. The introduction of “electronic vouchers” for social services in 2007 has trans-formed the service infrastructure, including the structure of service providers and their personnel. Furthermore, they have increased the choices for service users and heralded the devel-opment of user-centered social services. Social services also
harbor great potential for job creation, particularly for the low-income class and minorities, who have been traditionally excluded from the job market. By creating jobs to help improve the lives of the working class, these vouchers have come to form a key mechanism for an active approach to welfare.
In the meantime, the demand for social services has been growing and diversifying over the last decade, and will likely continue to do so in the future. The growing demographic im-balance―plummeting birth rates on the one hand and the rapid aging of the population on the other―has intensified the prob-lem of care. The diversification of household types―with the increasing numbers of single-person, unmarried/cohabitating, and immigrant households―has been giving rise to new service needs. Continuing recessions and the transformation of in-dustrial structures have greatly increased the unpredictability of job prospects, particularly for young people, generating a variety of unemployment-related problems, such as housing and physical/mental health issues. There is also a growing need to find innovative solutions to a set of social problems that had been largely overlooked until recently, such as violence, abuse, and air pollution. In other words, Korean society is witnessing a constant rise in the diversity of policy problems that require social services as solutions. This implies the necessity for a na-tionwide and integrated system of social service security.
by articulating its commitment to establishing such a system under the Governmentwide Social Service Plan, an inter-departmental joint report that was submitted to the Social Security Committee (SSC) in February 2018. The plan espouses two main objectives, i.e., reinforcing the availability of social services for all age groups and shifting the paradigm of the sys-tem for the supply and use of social services. The six specific goals it adopted include expanding social services for different needs and age groups, ensuring the balanced growth of social services across regions, increasing and improving the quality of social service jobs, enhancing the publicness and control of so-cial services, establishing an integrated system for the provision of social services, and designing social services in such a way that they ensure Koreans’ social rights (Government of the Republic of Korea, 2018). T he plan suggests that the growing awareness of the shortage of social services among Korean pol-icymakers, regional disparities, and lack of public control and integration in the system of social service provision and use all stand in the way of improving the quality of life for all Koreans through social services.
The absence of a comprehensive perspective on policy-making has the potential to engender diverse problems regard-ing investment in and the supply and use of social services. As for investment, overlapping investments of resources for cer-tain needs or in cercer-tain groups may occur due to the lack of a
comprehensive understanding of how well different needs are being addressed. As for supply, the lack of consensus among different agencies and departments on the scope and levels of social services to be provided can lead to significant increases in similar and overlapping services as well as shortages of other necessary services, intensifying the problem of equity. Regarding service use, the lack of in-depth consideration of the accessi-bility, integrity, and continuity of different services can lead to interruptions in the provision of user-tailored services.
In acknowledgement of these concerns, this study is in-tended, first and foremost, to render a comprehensive assess-ment of the wide range of social services provided by different governmental bodies. As the main emphasis of social services in Korea is to provide active and universal policy interventions for various risks to which all Koreans are prone at different stages in their lives, it is important to assess whether those in need of services are receiving appropriate and sufficient re-sources in a timely manner. In other words, our focus is on gaining a comprehensive understanding of the security of the social services being provided in relation to different service needs and age groups. Based on such assessment, we shall also explore policy implications regarding the establishment of a more effective and comprehensive governmentwide system of services.
Policy measures necessary to strengthen the security of social services is a topic that has received little attention in the over-all discourse on social service policy in Korea. Over the last decade, Korean policymakers have emphasized the need to foster a social service market and increase social services so as to create more jobs. However, little research has been done re-garding how to improve the security of services for the sake of users. Furthermore, the absence of a widely accepted definition or concept of social services has made systematic discourse difficult. Before discussing the security of social services, we first need to establish a shared understanding of what specifi-cally constitutes social services. The conceptual confusion and disputes over the exact scope of social services, however, has prevented such understanding from arising in both academia and policymaking circles. Even the statutes providing for social services adopt quite divergent definitions. These definitions are found in the Framework Act on Social Security (FASS), Social Enterprise Promotion Act (SEPA), and Act on the Use of Social Services and the Management of Vouchers (AUSS). Of these, the first two adopt a broader view of the concept of social services, while the last limits social services to welfare and medicine only.
when it comes to distinguishing between multiple areas of so-cial services as subjects of policymaking. The FASS, for in-stance, defines social services as constituting an area of social security that is distinct from social insurances and public assis-tance for the poor. Given that income support and services form the two main pillars of social security in many states worldwide, services provided under social insurances or as part of public assistance may also be considered social services. The stated policy objectives of social services are “to guarantee hu-mane living conditions” and “to improve quality of life,” which are abstract and can be said to be the guiding principles of so-cial security in general. By contrast, soso-cial insurances have the clear objective of “securing the health and income of all Koreans,” while public assistance also aspires to “guarantee a minimum standard of living and provide support for the self-sufficiency of the poor” (Kang et al., 2018).
The concept of “security” has indeed been used mostly in dis-courses on social insurances and public assistance (e.g., the se-curity of the National Pension, sese-curity of the National Health Insurance, and reinforcement of income security). Koreans have typically used the concept in emphasizing the need to eliminate the blind spots of these policy schemes. Although the specific applications of the concept differ from policy to poli-cy, it has generally guided discussions on the scope of program coverage and the levels of benefits to be provided (Ku and
Baek, 2008; Shin, 2009; Kim, 2013; and Roh, 2016). The con-cept of “blind spots” in the scope of coverage refers to both citizens who are legally alienated from existing social security programs and others who are eligible for the programs but ef-fectively excluded from them. “Blind spots” created by short-ages of provided benefits refer to experiences of citizens who are eligible for and receive benefits under the given programs but still struggle to make ends meet due to the insufficiency of the benefits provided.
The discourse on security has had better luck in relation to social relations and public assistance than social services, ow-ing mainly to the differences in the purposes and types of peo-ple the programs serve. Social insurances and public assistance are designed to serve certain groups of people, whether based on income or other criteria. It is therefore relatively easy to de-termine the sizes of populations not benefitting from those programs. Furthermore, because these programs either provide cash benefits (such as the National Pension and National Basic Livelihood Security Program (NBLSP)) or reduce the amounts of co-payments individuals are required to pay for the services they receive in light of their income levels (e.g., National Health Insurance), consistent sets of criteria can be applied to determine the quantities of benefits eligible persons are to receive. Social services, on the other hand, encompass quite a wide range of diverse population groups. The benefits they
provide are also diverse (cash, in-kind, and services) and apply to both the providers and users of services. In other words, it is difficult to apply a consistent set of criteria for determining how much these services provide and how wide their reach is. Also complicating the situation is the dearth of official statistics on the security of social services.
Despite these limitations, we can appropriate the concept of “blind spots” featured in the discourse on social security in general and better understand the security of social services by asking the question, “To whom, and to what extent, should so-cial services be provided and guaranteed?”
First, we can refer to the provisions on social services in the FASS and identify how securely the service policy has been designed. The question of for whom social services are to be guaranteed has to do with the beneficiaries and scopes of so-cial services. The FASS defines soso-cial service beneficiaries as “all Koreans in need of help from national and local govern-ments as well as the private sector.” The law also requires the establishment of a lifelong social security network for all Koreans that reflects “the basic universal needs that arise in all stages of the lifecycle and the particular needs that arise in re-lation to specific risks.” That social services are to cater to the “universal basic needs” of all Koreans indicates that universal-ism is the central principle of social services. It is thus essential to uphold everyone’s basic right and access to social services.
Moreover, that services are also to be provided for “particular needs” associated with specific risks emphasizes the im-portance of designing selective and professional services tail-ored to address the vulnerabilities of certain groups.
Social services are not confined to welfare and income sup-port; rather, they encompass a variety of areas essential to overall quality of life, such as health and medicine, education, housing, culture, and the environment. The proviso that they be provided for people “in need,” however, puts the burden on policymakers to devise the criteria for measuring and satisfying such needs. The availability of fiscal resources also necessarily affects the extent to which such services can be provided. This structure of social services reflects the application of selective or residual principles within the larger universal framework (Thompson and Hoggett, 1996).
Second, we need to ask and answer the question as to how much of social services (quantities or levels) are being provided. Any answer to this question would have to reflect the ultimate objectives of social services, i.e., guaranteeing humane living conditions and improving the quality of life for all. Humane liv-ing implies that social services are needed to guarantee more than bare existence. The appropriate standard of living, how-ever, is abstract, while needs associated with maintaining it vary from time to time and place to place. How much of social services are needed to ensure such standard of living thus
in-volves some arbitrary decision-making. Unsurprisingly, there are no fixed rules regarding how much of social services are to be provided. Neither is it possible to measure and determine, with clarity and objectivity, the needs to which such services are to be tailored.
Perhaps it is due to these difficulties that research on the se-curity of social services has been so limited. Some, nonetheless, sought to address the problems of universalism and blind spots in social services. Roh (2016) drew upon the raw data of the 2013 Survey of Social Service Demand and Supply and analyzed the blind spots of social services in terms of the compre-hensiveness of the scope (target beneficiaries) and sufficiency of the benefits provided. Roh’s study sought to measure the comprehensiveness of services based on the demand-to-use ratio and the sufficiency of the benefits provided based on the disparity between the actual numbers of hours of services used and the desired hours. The author concludes that there are sig-nificant gaps in social services concerning health and medicine and employment support that need to be closed. Kim and Kwon (2013) focused their attention on elderly care services, which are the most systematic of all social services provided today, and assessed how universal they were in terms of policy design, enforcement, and outcomes. Upon closer examination, we can see that the authors’ conclusion overlaps to a sig-nificant extent with Roh’s conclusion on blind spots. Kim and
Kwon evaluate whether the current services are designed to en-sure and protect all eligible persons’ basic right or entitlement to services. The answer to this question depends upon how in-clusively the target beneficiaries of the given service have been defined. Furthermore, the authors rank the services designed in such a way that administrative discretion plays a role in their enforcement, i.e., in deciding whether a person can receive such services or not, low on the universality scale. Yun et al. (2010) examined care services for children, people with dis-abilities, seniors, and women and families with the goals of identifying the types of services needed by these groups and determining the minimum quantities of services to be provided. They specified the actual extents to which services are pro-vided (in terms of both target beneficiaries and types of serv-ices) and the minimum amounts of individual services that should be provided.
The existing literature on the security of social services none-theless fails to account for the breadth and diversity of the serv-ices provided. The authors also forego general summations of the social services available in Korea and discussion on the means by which they assessed the processes. This tendency has prevented the discourse on social service security from expanding beyond care services. To promote a more productive and effective dis-course on social services and policy, we first need to survey the overall status of the social services currently being provided.
Based on the foregoing survey of the existing discourse, we shall examine the security of social services in Korea in terms of the target beneficiaries, scope of application, and suffi-ciency of benefits. We should also assess each of these factors from the perspectives of both policy and the user.
We can assess the security of social services by examining their policy designs and outcomes. Policy design assessment in-volves examining whether the social services provided by cen-tral government agencies cater to all age groups with service needs. It also involves determining how inclusive the scopes of target beneficiaries are. As for outcome assessment, we can ex-amine the number of people who actually benefit from services and the amounts of funds allocated to those services. This process is based on the assessment methodology of the Social Protection Indicator (SPI), which was developed by the Asian Development Bank (ADB). As a measure of the effectiveness of social protection policies, the SPI is used to examine the effec-tiveness of each nation’s social programs and conduct interna-tional comparisons (ADB, 2016). Equation 1 below shows how the SPI is calculated. As the gross domestic product (GDP) per capita serves as the denominator, the equation allows us to compare the effectiveness of a society’s social protection
pro-grams to the wealth of that society. The SPI also helps us con-duct time series analysis on whether government spending on social programs in a given society increases or decreases in proportion to the society’s economic growth (ADB, 2016).
Equation 1)
∑
∑
÷
The SPI can also be disaggregated into the breadth and depth of coverage of social protection programs. Equations 2) and 3) below measure the breadth and depth, respectively, while mul-tiplying the two yields the SPI score.
Equation 2) ∑ ∑ Equation 3) ∑ ∑ ÷ Equation 4) ×
The SPI is mainly used to analyze the effects of social in-surance, public assistance, and active labor market policies. It may be applied to social services for which the necessary in-formation is available, namely the number of beneficiaries, tar-get beneficiaries, and budtar-gets. The process by which the SPI was applied to our analysis is described in detail in Section IV,
along with the results. The security of Korea’s social services is analyzed herein not in terms of individual service programs, but in terms of lifecycle-specific programs or service functions, with the objective of evaluating the effectiveness of social serv-ices in protecting common target beneficiaries.
To determine whether social services in Korea satisfy the ac-tual needs of target beneficiaries, we should also assess the in-clusiveness of the scopes of the target beneficiaries they serve by dividing the number of actual user households by the num-ber of households in need.
Two different types of data are used in our analysis. First, our analysis of the security of social services in policy design draws upon the data of the interdepartmental social service admin-istration survey of 2018. The adminadmin-istration survey was con-ducted, with the assistance of the Social Service Policy Division of the Ministry of Health and Welfare (MOHW), from April 18 to June 20, 2018, involving officials in charge of social services at 18 agencies of the Korean national government. For this analy-sis, we define social services, pursuant to the FASS, as those that provide counseling, rehabilitation, care, information, fa-cilities, capability development support, and social partic-ipation support for users in the areas of welfare, health and medicine, education, employment, housing, culture, and the environment. Specifically, income-security programs, technical programs (for the expansion/renovation of facilities, etc.),
re-search and development programs, and infrastructure develop-ment programs have been excluded from the range of social security programs considered. On the other hand, policy pro-grams that provide services directly to individuals and house-holds, enable target beneficiaries to access and use the avail-able services, and subsidize private-sector or nongovernmental service suppliers were included in the analysis. To determine the list of government programs to be analyzed, we also exam-ine the details of expenditures, budgets, and financial manage-ment plans that form the Tax Revenue and Expenditure Budgets for 2017/2018. Based on this survey and consultations with researchers and experts, a total of 313 government pro-grams were chosen for analysis. Following the advice of public officials in charge of social services and the coordination of some of these programs, 269 of these programs were finally in-cluded in the analysis. Research was conducted on these pro-grams in terms of their stated objectives and functions, target beneficiaries (based on age, income, or other factors), types of benefits provided, and scales of the budgets involved.
Second, our analysis of the security of social services from the perspective of the user draws upon the raw data of the 2015 Survey of Social Service Demand and Supply. The survey, which has been conducted every two years since 2009, is the only source of comprehensive information on the use of di-verse social services and the dynamics of their supply structure.
Because the survey has been designed specifically to match the scope and target beneficiaries of the Korean government’s so-cial service policy, the data can be easily used in our frame-work of analysis. The 2015 survey data include 4,078 house-holds as potential users of social services, and the survey pro-vides data on 10 categories or areas of social services, i.e., counseling, rehabilitation, adult care, child care, health and medicine, education and information, employment, housing, culture, and the environment. Given the fact that many envi-ronmental services overlap with those of housing, we merge housing and the environment together into a single category. Our analysis of the inclusiveness of the target beneficiaries of services acknowledges the limited nature of the existing liter-ature, which is focused on only certain age groups and neglects the changing needs of diverse households. We therefore examine services provided for different types of households in detail.1)
1) As the survey is conducted every two years, we may also rely on the raw data concerning 2017. The original plan was to compare the data from 2015 and 2017, as the surveys conducted in those two years are based on much the same sample and questionnaire, and examine the changes in the security of services from the user’s perspective. However, given the problem of representativeness in the 2017 data (e.g., the excessively small percentage of single-person households included in the sample compared to the target population), we decided to use the 2015 data only.
Ⅳ
1. Security of Social Services from the Policy Perspective
2. Security of Social Services from the User’s Perspective
1. Security of Social Services from the Policy
Perspective
As of the end of 2017, 18 agencies of the Korean government were operating 269 service programs, with a total budget of KRW 15.7 trillion. The MOHW operated 88 (32.7 percent); the Ministry of Gender Equality and Family (MOGEF), 45 (16.7 per-cent); and the Ministry of Employment and Labor (MOEL), 38 (14.1 percent). These three ministries, in other words, together operated 63.5 percent of all the surveyed programs. The MOHW also had the largest budget (KRW 6.9 trillion), followed by the Ministry of Education (MOE; KRW 4 trillion) and the MOEL (KRW 2.3 trillion).
〈Table 1〉 Social Service Programs of the National Government and Its Agencies
Agency
Number of
programs Budget
N %
Overall 269 100.0 15,714,361,342,000 National Policy Agency (NPA) 1 0.4 24,082,000,000 Ministry of Employment and Labor (MOEL) 38 14.1 2,349,658,000,000 Ministry of Science and ICT (MSIT) 4 1.5 12,808,000,000 Ministry of Education (MOE) 13 4.8 3,962,974,080,000 Ministry of Patriots and Veterans Affairs (MPVA) 16 5.9 658,254,000,000 Ministry of Economy and Finance (MOEF) 1 0.4 20,468,000,000
Note: The apparently service-centered programs of the Ministry of Land, Infrastructure and Transportation (MOLIT) and Ministry of SMEs and Startups (MSS) mostly involve providing finance and loans for housing projects and entrepreneurship. As they depart from other service programs in terms of orientation, these programs were excluded from the analysis.
Source: MOHW-Korea Institute for Health and Social Affairs (KIHASA) (2018).
Governmentwide Social Service Administration Survey 2018 (raw data).
A. Policy Design: Inclusiveness of Target Populations and
Program Scopes
Let us first examine how universal and inclusive the target populations and scopes of the analyzed service programs are. To this end, we can divide the programs according to the age of the clients they are meant to benefit, i.e., young children (under the age of seven), children and youth (aged 7 to 24), adults (aged 15 or older), and seniors (aged 60 or older). Programs serving more than one age group can be divided on the basis of
Agency
Number of
programs Budget
N %
Ministry of Agriculture, Food and Rural Affairs (MAFRA) 10 3.7 567,599,000,000 Ministry of Culture, Sports and Tourism (MCST) 17 6.3 323,651,000,000 Korea Communications Commission (KCC) 1 0.4 2,858,000,000 Ministry of Justice (MOJ) 9 3.3 94,317,000,000 Ministry of Health and Welfare (MOHW) 88 32.7 6,873,464,781,000 Korea Forest Service 3 1.1 50,222,000,000 Ministry of Trade, Industry and Energy (MOTIE) 7 2.6 190,264,000,000 Ministry of Gender Equality and Family (MOGEF) 45 16.7 524,735,281,000 Ministry of National Unification (MNU) 7 2.6 28,569,200,000 Ministry of Oceans and Fisheries (MOF) 5 1.9 19,401,000,000 Ministry of Public Administration and Safety (MOPAS) 1 0.4 216,000,000 Ministry of Environment (ME) 3 1.1 10,820,000,000
the main age group they serve. Programs for adults were cate-gorized according to the definition of the working age pop-ulation (15 or older), as they are mostly related to employment.
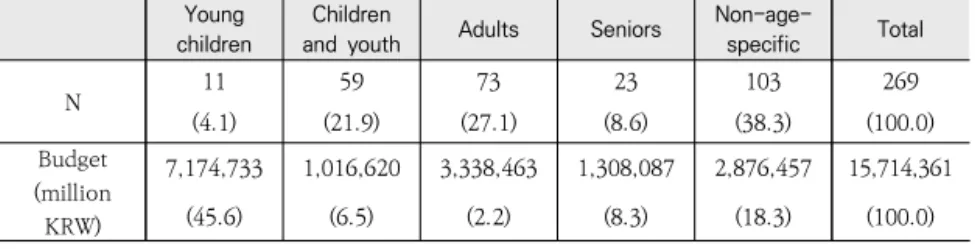
Programs that do not serve particular age groups made up the largest proportion (38.3 percent), followed by those serving adults (27.1 percent), children and youth (21.9 percent), seniors (8.6 percent), and young children (4.1 percent). In terms of budget, however, programs for young children occupied the greatest proportion (46 percent, or KRW 7.2 trillion), followed by non-age-specific programs (18.3 percent), programs for se-niors (8.3 percent), those for children and youth (6.5 percent), and adults (2.2 percent). In other words, young children are the main focus of Korean social service policy and investment.
〈Table 2〉 Distribution of Social Service Programs by Target Population Age
Young children
Children
and youth Adults Seniors
Non-age-specific Total N 11 59 73 23 103 269 (4.1) (21.9) (27.1) (8.6) (38.3) (100.0) Budget (million KRW) 7,174,733 1,016,620 3,338,463 1,308,087 2,876,457 15,714,361 (45.6) (6.5) (2.2) (8.3) (18.3) (100.0) Source: MOHW-KIHASA (2018).
Table 3 shows the distribution of social service programs by target population type, defined in terms of age and particular needs. It shows how universal or selective the given category of service programs are. The income requirement varies from program to program. Included in the analysis are programs that
explicitly limit beneficiaries’ eligibility on the basis of income, such as those for the NBLSP and near-poverty groups and oth-ers for households earning less than 120 percent, 140 percent, or 160 percent of the median income. Overall, the majority of programs (74.3 percent) impose no such income criterion. There are, however, some differences across the age categories of programs. Programs for seniors, in particular, impose fewer income restrictions than programs serving other age groups.
Programs that serve populations with specific needs aside from income restrictions, such as people with disabilities, vet-erans, immigrants and foreigners, single parents, women, and people who sustained work-related injuries, are also selective in their design. Note that programs for young children are not such selective programs. The percentages of selective programs noticeably increase among programs serving adults and non-age-specific programs. The percentage of programs that are free of both income and particular-needs restrictions tends to decline as the age of the target population rises. Universal programs make up 40 percent or so of programs intended for adults and seniors.
〈Table 3〉 Distribution of Social Service Programs by Criteria Criterion Young children Children and youth
Adults Seniors Non-age -specific Total Income restrictions Applied 4 (36.4) 18 (30.5) 11 (15.1) 11 (47.8) 25 (24.3) 69 (25.7) N/A 7 (63.6) 41 (69.5) 62 (84.9) 12 (52.2) 78 (75.7) 200 (74.3) Particular needs Applied 0 (0.0) 12 (20.3) 34 (46.6) 6 (26.1) 37 (35.9) 89 (33.1) N/A 11 (100.0) 47 (79.7) 39 (53.4) 17 (73.9) 66 (64.1) 180 (66.9) Income and/or particular needs At least one applied 4 (36.4) 24 (40.7) 42 (57.5) 14 (60.9) 54 (52.4) 138 (51.3) Neither applied 7 (63.6) 35 (59.3) 31 (42.5) 9 (39.1) 49 (47.6) 131 (48.7) Source: MOHW-KIHASA (2018).
Do the existing social service programs in Korea cover all the areas of services needed? To answer this question, we can again categorize programs on the basis of nine functions, i.e., care, education/training, physical health, mental health, safety and rights protection, housing, employment, culture and lei-sure, and integrated service support. Care programs made up the largest number (18.2 percent), followed by those for phys-ical health (16.7 percent), safety and rights protection (15.2 percent), and employment (also 15.2 percent). Care programs also occupied the largest portion of the social service budget, at KRW 9.6 trillion. For the rest, there was no such match be-tween the number of programs and their budgets. Programs for safety and rights protection, for instance, are numerous, but receive very little fiscal support.
〈Table 4〉 Distribution of Social Service Programs by Function Function Number of programs Budget N % Overall 269 100.0 15,714,361,342,000 Care (for children and adults and including
assistance for daily activities) 49 18.2 9,590,653,000,000 Education/training 13 4.8 68,706,080,000 Physical health 45 16.7 1,412,646,781,000 Mental health 21 7.8 223,117,000,000 Safety and rights protection 41 15.2 282,483,560,000 Housing 14 5.2 703,562,145,000 Employment 41 15.2 2,415,523,200,000 Culture and leisure 26 9.7 380,186,000,000 Integrated service support (including support
for using services and family support) 19 7.1 637,483,576,000
Source: MOHW-KIHASA (2018).
Programs are concentrated on functions needed to help spe-cific age groups combat likely risks or satisfy needs. For exam-ple, programs for young children, children and youth, and se-niors focus mostly on providing care, while those for adults fo-cus on providing employment and related support.
A problem arises when there are age groups who have par-ticular needs and for whom no services are provided, or when existing programs target populations so narrowly defined that people in need are denied services. Consider the fact that the needs for employment and education/training are growing rap-idly among seniors because of the dramatic increase in average lifespan and growing unpredictability of the labor market. Figure 1, however, shows that there are few programs
specifi-cally providing employment and education for seniors. Non- age-specific programs should be redesigned to provide the necessary services for these groups.
〔Figure 1〕 Distribution of Social Service Programs by Function and Age Group
Source: MOHW-KIHASA (2018).
B. Policy Outcome: Breadth and Depth of Services
We now need to examine the breadth (i.e., percentages of actual beneficiaries of programs in the target populations) and depth (i.e., amount of each program’s budget spent on each beneficiary) of social service programs in Korea.
The number of beneficiaries and budget for each program, as indicated in the administration survey, were entered into our analysis. The potential number of users or the target pop-ulation size of each program was estimated using the data of
Statistics Korea according to the program’s eligibility criteria (demographic, financial, household, disability, and other par-ticular-need variables). For example, the target population of the Emergency Safety Alarm Service for seniors living alone and people with severe disabilities would be the sum of seniors aged 65 or older living alone and people with disabilities of Grades 1 through 3. The target population size for a universal program, such as the Hope Welfare Support Group’s Integrated Case Management Program, would be equal to the resi-dent-registered population in the given age group that the pro-gram is meant to serve.
In using this method, we must be aware of the possibility of either overestimating or underestimating the number of beneficiaries. Overestimation may occur with respect to pro-grams on which available statistics are limited, and whose actual target population sizes cannot therefore be estimated with rea-sonable accuracy. For example, the At-Risk Family Support Program should serve families at risk, but it is impossible to get a good estimate of how many such families there are in Korea. The target population size for such a program is therefore based upon the resident-registered population. Underestimation, on the other hand, may occur with respect to programs that leave a significant portion of their target populations unattended, de-spite their needs, due to their narrow eligibility criteria. An ex-ample would be a program providing activity support for
peo-ple with disabilities. Although all peopeo-ple with disabilities may need such service, the program is meant to benefit only people with severe disabilities. Accordingly, the target population esti-mate used in our analysis is based on the number of people with severe disabilities. A total of 212 service programs (roughly 80 percent of the surveyed programs) were subjected to the SPI analysis. This is because it was necessary to exclude programs whose numbers of actual beneficiaries are unknown and whose actual beneficiaries outnumbered the target populations (because they keep track of usage based on the number of services pro-vided rather than the number of people using such services) from the analysis.
The results of the SPI analysis are the breadths and depths of the programs analyzed. Because the purpose of this study has nothing to do with either international or time-series compar-ison of the social services provided, we need not apply the GDP per capita variable to estimating the depths of services. As di-viding programs by target population age runs the risk of shift-ing the focus of analysis to comparison of the security of pro-grams by age, we need, instead, to divide propro-grams by function. Equations 5) and 6) are used to estimate the average breadth and depth of programs serving each function.
Equation 5)
∑
Equation 6)
∑
The average breadths of the programs, divided by function, were generally low, ranging from 3.5 percent (safety and rights protection) to 21.4 percent (integrated services). The disparities between the programs by function were also significant. Whereas programs for integrated services, physical health, and cul-ture/leisure offered relatively high degrees of breadths, safety and rights protection and mental health programs offered quite low degrees of breadths at below five percent. Housing pro-grams far outperform the other propro-grams in terms of average depth per capita, because housing programs largely involve providing financial support for repairing housing and living environments. Physical health and culture programs were note-worthy for their relatively high average breadths and low aver-age depths. Safety and rights protection and mental health pro-grams, on the other hand, performed poorly in terms of both breadth and depth.
〔Figure 2〕 Average Breadths and Depths of Social Service Programs by Function
Source: MOHW-KIHASA (2018).
2. Security of Social Services from the User’s
Perspective
The security of social services from the user’s perspective can be analyzed using the raw data of the Social Service Demand and Supply Survey (2015). Table 5 shows the dis-tribution of households by demographic variable and experi-ence with using social services. As for the age makeup of social service users, households with seniors (aged 65 or older) made up the largest proportion (21.9 percent), followed by house-holds with or without grownup children (21.2 percent), un-married households (either living alone or with parents/sib-lings; 20.7 percent), households with children aged 7 to 18 (18.5 percent), and households with young children (under age seven; 8.9 percent), and married households that have not yet
borne children (8.8 percent). As for income distribution, house-holds earning 51 to 100 percent of the national monthly me-dian household income made up the greatest proportion (40 percent), followed by households earning 101 to 150 percent of the median income (32.3 percent), and households earning 50 percent or less of the median income (11.6 percent). Single- person households made up 27.1 percent of all households. Of these, 37.5 percent were young (aged 19 to 39); 34.5 percent, middle-aged (aged 40 to 64); and 28.0 percent, elderly (aged 65 or older).
Of all the households surveyed, 49.8 percent had used at least one of the surveyed social services. Households with young children, households with children aged 7 to 18, and house-holds that have not yet borne children were especially well- represented among service users over the past year (67.2 per-cent, 58.2 perper-cent, and 53.2 perper-cent, respectively). Elderly and unmarried households, on the other hand, used social services relatively less. Households with low income (50 percent or less of median income) were the least likely to have used social services. Single-person households, too, had relatively little ex-perience with receiving social services. Among single-person households, however, young and middle-aged ones used social services more than elderly households.
〈Table 5〉 Distribution of Households and Use of Social Services
Household type N % Service use rate (%) Composition (n=4,078)
Unmarried 777 (20.7) 45.1 Married, pre-childbirth 260 (8.8) 58.2 With young children 344 (8.9) 67.2 With children and teenagers 845 (18.5) 53.2 Living with/without grownup children 925 (21.2) 49.2 Elderly 927 (21.9) 41.4 Income (n=4,078)
50% or less of median income 501 (11.6) 45.7 51 to 100% 1,688 (40.0) 51.6 101 to 150% 1,302 (32.3) 49.8 Over 150% 587 (16.1) 48.0 Single-person households (n=1,046) Young 444 (37.5) 44.9 Middle-aged 291 (34.5) 44.4 Elderly 311 (28.0) 36.9
Source: MOHW (2015). Social Service Demand and Supply Survey 2015 (data files;
internal data re-analyzed).
Next, we need to examine how inclusive the programs for each function are, in light of the characteristics of households. Here, inclusiveness refers to the percentage of households that have actually used services among all households in need of such services. It can be operationalized as the need satisfaction rate.
The need satisfaction rates of unmarried and married house-holds that have not yet borne children were relatively high compared to all households, particularly with respect to serv-ices for health and medicine, employment and related support, and culture. Relative to households with young children, households with older children had low need satisfaction rates in general, except for employment-related services. The need
satisfaction rate of households with older children with respect to child care services, in particular, was only two-thirds that of households with young children, suggesting the need to expand social services for schoolchildren. The need satisfaction rates of elderly households were generally higher compared to all households, particularly with respect to services for rehabilitation, health and medicine, and employment and related support. Nevertheless, with a need satisfaction rate of only 12.1 percent, elderly households definitely had far less care services available to them than households with children. It is thus necessary to enact policy changes to make more care services available to seniors.
〈Table 6〉 Household Types and the Inclusiveness of Social Service Programs
(Unit: percentage)
Function/household type Unmarried Married, pre-chil dbirth Young children Older children With/without grownup children Elderly Overall Counseling 6.5 11.9 8.8 8.3 30.4 17.1 14.6 Rehabilitation 25.3 17.3 31.3 31.0 24.3 30.6 27.6 Adult care 15.3 6.7 7.0 8.2 2.9 12.1 10.6
Child care n/a n/a 68.6 42.8 n/a n/a 44.3
Health and medicine 35.8 40.8 37.8 34.1 37.7 46.9 39.9
Education/training/in
formation 12.8 5.6 33.7 14.5 17.3 14.3 18.1 Employment and support 38.1 48.5 9.6 20.0 27.9 37.2 30.7
Housing and environment 15.1 44.7 32.4 20.6 30.8 19.6 24.2
Culture 84.8 82.6 79.1 81.6 89.0 67.8 82.0 Source: MOHW (2015).
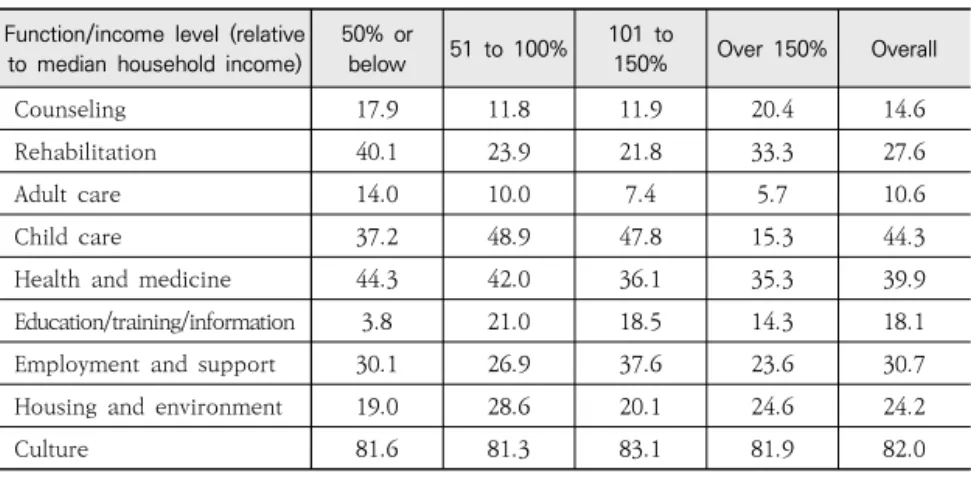
Table 7 shows the need satisfaction rates by household income. No consistent patterns are apparent. Interestingly, households earning more than 150 percent of the median income were the ones with the lowest need satisfaction rates across the board, whether concerning services for care, health and medicine, or employment. The care need satisfaction rates of these house-holds, in particular, fell below 50 percent of the rates of other households. This suggests that Korean social services, despite their growing universalist aspirations, have failed to serve households above the median income line.
〈Table 7〉 Household Income Levels and the Inclusiveness of Social Service Programs
(Unit: percentage)
Function/income level (relative to median household income)
50% or below 51 to 100% 101 to 150% Over 150% Overall Counseling 17.9 11.8 11.9 20.4 14.6 Rehabilitation 40.1 23.9 21.8 33.3 27.6 Adult care 14.0 10.0 7.4 5.7 10.6 Child care 37.2 48.9 47.8 15.3 44.3 Health and medicine 44.3 42.0 36.1 35.3 39.9 Education/training/information 3.8 21.0 18.5 14.3 18.1 Employment and support 30.1 26.9 37.6 23.6 30.7 Housing and environment 19.0 28.6 20.1 24.6 24.2 Culture 81.6 81.3 83.1 81.9 82.0
Source: MOHW (2015).
Among single-person households, young households had low need satisfaction rates with respect to services for care, health and medicine, and housing and environment; middle-aged
households, with respect to services for rehabilitation and em-ployment and related support; and elderly households, with re-spect to education/training, information, and culture. Middle-aged single-person households lagged far behind the average need satisfaction rates with respect to all service programs, except for care, employment, and related support. This suggests the need to develop and introduce new services specifically tail-ored to the needs of middle-aged single-person households.
〈Table 8〉 Single-Person Households and the Inclusiveness of Social Service Programs
(Unit: percentage) Function/
single-person household type Young Middle-aged Elderly Overall
Counseling - 9.5 24.2 14.6
Rehabilitation 44.6 13.9 38.4 27.6
Adult care 11.4 14.5 17.1 10.6
Child care 28.4 37.9 45.0 39.9
Health and medicine 11.1 15.2 8.2 18.1
Education/training/information 43.8 31.4 51.3 30.7
Employment and support 5.0 20.9 13.8 24.2
Housing and environment 91.6 77.0 48.1 82.0
Ⅴ
Conclusion and Policy
Implications
Our analysis affirms the disparities in the security of social services among different age groups and needs. Care services, by far the most important among social services, have grown dramatically in recent years, particularly thanks to increases in support for households with young children. Yet social services serving different age groups in Korea focus on only one or a few particular needs dominant in the given age group (care for children and seniors, employment support for adults, etc.) and fail to satisfy all the diverse needs that can be found in each age group. Furthermore, the need satisfaction rates remain low across service programs for all functions. Certain households have difficulty accessing and receiving social services to satisfy their core needs.
The policy implications of these findings can be summarized as follows. There are three main questions to answer: for what needs social services are to be increased and made more se-cure, for whom the services should be strengthened, and how the services are to be strengthened.
The first question pertains to the areas of social services. The FASS states that social services are to be provided to satisfy “basic universal needs across age groups” as well as “particular needs in relation to specific risks.” The social services that have
been introduced thus far have aspired to meet common needs concerning welfare, health and medicine, education and train-ing, employment, culture, and living environments. The needs surrounding social services can be divided into unmet needs and unidentified needs. Social service programs in Korea have evolved largely in response to the former. Our analysis of the current status of these programs, however, reveals that the rates of needs actually satisfied by the services still remain quite low. To strengthen the security of social services in order to serve more unmet needs, policymakers need to establish a standard for guiding their decisions on which areas of services are to receive increased investment, and prioritize investment needs accordingly. The Korean government may base its deci-sion to increase investment on the critical nature of the needs, urgency of the required response, and estimated returns on investment. Consider the example of cultural support services. The needs for these services do not involve risks and are there-fore uncritical. Nevertheless, there is a universal need for these services, which will likely generate higher returns on investment. Safety and rights protection and mental health services, by contrast, involve highly critical needs but relatively small de-mand and are therefore unlikely to generate returns on investment. When faced with the choice of which of these two contrasting types of services are to receive greater investment for greater security, the state may decide to prioritize the latter over the
former. To justify such decision, however, policymakers should gain a good grasp of the relative security of existing social service programs on the basis of objective data.
On the other hand, it is also important to search for un-identified needs more actively, and to start building a societal consensus on serving these needs as well. The needs of young and middle-aged single-person households and cohabitating (unmarried) couples―traditionally insignificant in, or alienated by, the social security system―are growing increasingly im-portant as deserving of social services given the changes in Korea’s demographic and industrial structures and Koreans’ value systems. There is also an emerging societal consensus on the validity of spending public resources on providing support for these households. Discovering unidentified needs is crucial in strengthening and innovating social services.
The second question asks the state to decide for whom it should strengthen social services. This question pertains to the two main aspirations of social services, i.e., publicness and universality. Universalism has become an important aspect of Korean social services, with 75 percent of social services today not imposing any income restrictions on eligibility. The scope or breadth of social service programs nonetheless remains de-pendent upon the fiscal conditions of the given state. It is therefore inevitable that disparities will arise between the ac-tual and intended scopes of a service program. It is thus the
re-sponsibility of the state to determine whose needs are to be prioritized, given the limited resources. In the short term, the Korean government may organize interdepartmental and multi-disciplinary discussions on how to decide the target pop-ulations of service programs in light of the extents of social-ization in relation to the given needs. For instance, as care serv-ices have become largely socialized in recent years, they can be provided through a universal public program, whereas policy makers may consider taking a more selective approach to such less socialized areas as culture and housing, prioritizing serv-ices to low-income classes. In the long term, it would be ideal for the state to foster conditions so that all Koreans can freely receive social services that satisfy their diverse needs.
Finally, different areas of services require different security- strengthening approaches. The overall amendment of the FASS in 2012 introduced a broader concept of social services, mak-ing social services a major focus of diverse agencies. Yet the quality and maturity of social service programs vary widely from area to area. Care services, for instance, form the core of Korea’s new social service policy, and the Korean government is concentrating its efforts on expanding care services for dif-ferent groups. Elderly care services, activity support for people with disabilities, and postnatal and neonatal care services that were introduced with electronic vouchers in 2007 have since become representative social services in Korea. With the
addi-tion of domestic help and home nursing services, in 2008, and child care services, in 2017, to the electronic voucher system, Korea’s social service structure now provides care services for all age groups, at least on the surface. Now that the scope and reach of these care services have expanded so much, there is a growing discourse on specific and diverse measures for im-proving their quality. By contrast, mental health and safety and rights protection services, although part of the traditional dis-course on social welfare, lack comparable infrastructure and delivery systems, because they seemingly serve particular and not universal needs (mental disorders, violence, abuse, etc.). It is therefore futile to adopt the same approach to mental health and rights protection services as that taken to care services in order to reinforce the security of the former. Housing, living environments, and culture were only belatedly recognized as areas of social security circa the late 1990s, which is why there is a dearth of even normative research and discourse on how inclusive services in these areas should be. In designing policy measures to strengthen the security of different social services, policymakers should divide the existing programs into stages according to their maturity (e.g., introductory, growth, and ad-vanced stages) and tailor security-strengthening measures accordingly. Services in the introductory stage, for example, would primarily require stable budgets for providing minimum services and the expansion of infrastructure and personnel.
Services in the growth stage would require funds for providing appropriate services, extensive supply infrastructure, and greater personnel. Services in the advanced stage would require the di-versification of programs and establishment of a governance system to ensure service quality.
Social services, along with income security, forms one of the two main pillars of a lifelong social security net. As people’s needs grow more refined, diverse, and complex, it is becoming increasingly challenging to design these services, while the de-mand for social services continues to rise. To devise effective policy measures for strengthening the security of social serv-ices, it is most important to enhance interdepartmental coordi-nation and collaboration on social service policymaking. Therefore, an interdepartmental social service policy council should be assembled and permanent bodies set up to organize policy discussions on different types of social services. Although these tasks have been identified since social services were first introduced, they have yet to be carried out (Lee, 2012; Kang et al., forthcoming). It is also important to establish a system for collecting and managing empirical data on the supply and use of social services. Measures to strengthen the security of social services can be legitimized only when they are based upon ac-curate and objective understanding of the status of services.
Kang, H., Kim, Y., Kim, B., Yang, N., Kim, E., Ahn, S., Lee, J., Ha, T., and Lee, J. (2018). Basic Research on the Establishment of a Lifelong Social Service Security System. Sejong: MOHW-KIHASA. Government of the Republic of Korea (2018a). Governmentwide Social
Service Plan. Sejong: Government of the Republic of Korea. Gu, I. and Baek, H. (2008). Blind spots of social security: Facts and
factors. Journal of Social Security, 24(1), 175-204.
Kim, W. (2013). Blind spots of welfare and solutions: The Case of the National Pension. Korea Association of Public Finance-Korea Institute of Public Finance Joint Policy Seminar. Seoul: KIPF, 1-41.
Kim, H. and Kwon, H. (2013). A study on the universal application of social services. International Journal of Policy Evaluation and Management, 23, 143-170.
Roh, H. (2016). Blind spots of social services in Korea. Journal of Social Welfare, 47(1), 179-204.
MOHW (2015). Social Service Demand and Supply Survey 2015 (data files; internal documents).
Shin, H. (2009). Blind spots in the medical security system and solutions. Health and Welfare Forum, 155, 5-16.
Yun, S., Kim, M., Oh, E., Lim, J., Kang, M., and Lee, M. (2010). Basic Research for Determining Minimum Depths of Public and Social Welfare Services: Focusing on Care Services. Seoul: KIHASA. Asian Development Bank.(2016). The social protection indicator:
Assessing results for the pacific. Mandaluyong City, Philippines: Asian Development Bank.
Thompson, S., & Hoggett, P. (1996). Universalism, selectivism and particularism: Towards a postmodern social policy. Critical Social Policy, 16(46), 21-42.