I. Introduction
The National Health Insurance Corporation Ilsan Hospital (NHIIH) was established by the National Health Insur-ance Corporation in Korea as a reference hospital for health policy on insurance rates and hospital costs. NHIIH opened in March, 2000 with the size of 745 beds. It is located in the northwest part of Gyeonggi-do, and there are 55 centers and clinics including a cardiovascular center, emergency center, artificial joint center, hyperlipidemia clinic and arrhythmia clinic. There are 24 clinical departments with 1,400 medi-cal specialists. In 2011, NHIIH treated 781,323 outpatients and 29,424 inpatients. NHIIH introduced a computerized provider order entry (CPOE) system, admission/discharge/
Performance Analysis of Hospital Information
System of the National Health Insurance
Corporation Ilsan Hospital
Jung Mi Han, MPH1, Young Moon Chae, PhD1, Eun Hee Boo, PhD2, Jung A Kim, PhD3,
Soo Jin Yoon, MPH2, Seong Woo Kim, MD2
1Department of Health Informatics, Graduate School of Public Health, Yonsei University, Seoul; 2EMR Task Force, National Health Insurance Corporation Ilsan Hospital, Goyang; 3
Department of Nursing, Hanyang University, Seoul, Korea
Objectives: This study evaluated the qualitative and quantitative performances of the newly developed information system which was implemented on November 4, 2011 at the National Health Insurance Corporation Ilsan Hospital. Methods: Reg-istration waiting time and changes in the satisfaction scores for the key performance indicators (KPI) before and after the introduction of the system were compared; and the economic effects of the system were analyzed by using the information economics approach. Results: After the introduction of the system, the waiting time for registration was reduced by 20%, and the waiting time at the internal medicine department was reduced by 15%. The benefit-to-cost ratio was increased to 1.34 when all intangible benefits were included in the economic analysis. Conclusions: The economic impact and target satisfac-tion rates increased due to the introducsatisfac-tion of the new system. The results were proven by the quantitative and qualitative analyses carried out in this study. This study was conducted only seven months after the introduction of the system. As such, a follow-up study should be carried out in the future when the system stabilizes.
Keywords: Hospital Information System, Evaluation, Personal Satisfaction, Computer Systems Evaluation, Cost-benefit Analysis Healthc Inform Res. 2012 September;18(3):208-214.
http://dx.doi.org/10.4258/hir.2012.18.3.208 pISSN 2093-3681 • eISSN 2093-369X Submitted: September 17, 2012 Revised: September 21, 2012 Accepted: September 24, 2012 Corresponding Author Young Moon Chae, PhD
Department of Health Informatics, Graduate School of Public Health, Yonsei University, 50 Yonsei-ro, Seodaemun-gu, Seoul 120-749, Korea. Tel: +82-2-2228-1524, Fax: +82-2-392-7734, E-mail: ymchae@yuhs.ac This is an Open Access article distributed under the terms of the Creative Com- mons Attribution Non-Commercial License (http://creativecommons.org/licenses/by- nc/3.0/) which permits unrestricted non-commercial use, distribution, and reproduc-tion in any medium, provided the original work is properly cited. ⓒ 2012 The Korean Society of Medical Informatics
transfer (ADT) system, and laboratory information system (LIS) in 2000. It introduced a picture archive and communi-cation system (PACS) and data warehouse (DW) system in 2001. Based on these, NHIIH introduced the new integrated hospital information system with the focus on the Electronic Medical Record (EMR) on November 4, 2011.
To define the goals and scope of a new system, the informa-tion strategy plan (ISP) was developed in December 2009. An organization for developing the new system was estab-lished with the EMR task force comprised of the following three teams in July 2011: business plan team, contents devel-opment team, and supporting team. The business plan team was responsible for analyzing and redesigning the business processes in order to improve the hospital’s operating ef-ficiency. It was comprised of medical, nursing, medical sup-porting, and administrative staffs. The contents development team was responsible for developing quality indicators, stan-dards, codes, and user interface guidelines. The supporting team was responsible for management support and system development support. During the development period, 573 interviews were conducted to identify user requirements, two workshops were organized to monitor development activities, and 175 user training sessions were conducted to train key users.
The performance of the new system was evaluated from both qualitative and quantitative perspectives before and after the implementation in order to improve user satisfac-tion and justify the investment on the system. The qualitative evaluation dealt with factors related to user satisfaction and improvement in the business process based on the perfor-mance reference model (PRM) which was developed by the Office for Management of Budget (OMB) in the United States [1]. PRM is a standardized framework to measure the performance of major information systems (IS) investments and their contribution to program performance. PRM has been widely used in evaluating IS performance for govern-ment projects in the United States. Chung et al. [2] applied PRM to evaluate IS performance for several e-government projects in Korea. Since PRM evaluates IS based on the key performance indicators (KPIs) for each of three system lay-ers, input, process, and business, it provides a comprehensive view of the overall IS performance. Chung et al. [2] also de-veloped PRM version 2.0 as a standard performance evalu-ation tool and identified 138 KPIs for evaluating the perfor-mance of government IS projects. However, many of these KPIs are not applicable in healthcare settings because they were primarily developed for IS’s for government projects unrelated to healthcare. Moreover, there are not many stud-ies that compared the changes in KPIs before and after the
introduction of IS. Therefore, there is a need to analyze KPIs for evaluating such performance of IS projects in a health-care setting based on the PRM framework.
The quantitative evaluation primarily deals with the eco-nomic effects of IS. In order to analyze the ecoeco-nomic effects of the new system, waiting times at the registration desk and outpatient departments were measured, and business processes were compared before and after the introduction of new system. Although several studies have evaluated economic benefits of information systems projects in health-care [3,4], most of traditional cost-benefits analyses did not adequately account for intangible or indirect benefits such as savings from the reduction in medication errors. Since hospital information systems (HIS) tend to have a great deal of intangible benefits, there is a need for another approach to account for them. Parker et al. [5] introduced the infor-mation economics (IE) approach to account for intangible benefits by systematically analyzing the intangible benefit items. Chae et al. [6,7] modified them to the healthcare set-ting and used to analyze the economic effects of CPOE and EMR. Kang et al. [8] also used the IE approach to analyze the economic effects of EMR, but they mostly relied on the hypothesized performance indicators in their analysis. The purposes of this paper were to evaluate the qualita-tive performance of the new information systems at NHIIH based on PRM and compared the waiting time before and after the introduction of new system at NHIIH. Based on these results, an economic analysis was conducted by using the IE approach.
II. Methods
1. Data CollectionQuestionnaire surveys for qualitative evaluation were con-ducted three times to identify all factors influencing system success: three months before (August 8, 2011) and after three (February 4, 2012) and seven months (June 4, 2012) of the introduction of the new system implemented on Nov. 4, 2011. On each survey, 266, 314, and 329 users responded. Interns and residents were excluded in all surveys because they often rotated to other hospitals during their training. The waiting time for registration and business process of 475 patients was measured three months before the sys-tem's introduction (August 8 and 9, 2011), and 700 patients seven months after that (June 4 and 5, 2012) at the central registration desk; and 200 patients at two internal medicine outpatient departments (pulmonology and gastroenterol-ogy) three months before the system’s introduction and 300 patients seven months after the introduction.
2. Qualitative Performance Evaluation
Twenty three KPIs were derived from three layers based in PRM. Specifically, the input layer was comprised of IT fac-tors (e.g., system quality, information quality, user under-standing of system, information sharing, and security check) and human factors (top management support). The process layer was comprised of the business transaction process (efficiency of process and quality of business transaction) and the management process (regulation management, knowledge management, and security management). The business layer was comprised of business aspects (effective-ness in busi(effective-ness) and the user aspects (user satisfaction) [9]. Each KPI satisfaction score was measured for four types of users (i.e., doctors, nurses, medical support staffs, and ad-ministrative staffs) in 3-point scales (1, not satisfied; 2, in-between; and 3, satisfied).
3. Economic Analysis
The economic performance of HIS was evaluated by com-paring costs and benefits. Cost items include hardware, database, software, system infrastructure, and system audit. Maintenance cost was zero for the first year. The scope of the benefits was broadened to values based on the IE approach in order to account for the intangible benefits. The IE ap-proach categorizes them into 5 specific value items: direct benefits, value acceleration, value linkage, value restructur-ing, and innovation valuation. Direct benefits refer to the traditional benefits from IS, such as savings in personnel costs due to reduced workloads. Value acceleration refers to the value associated with time factors, such as the reduced opportunity costs for patients due to the reduced waiting time. Value linkage refers to the value accrued from com-pounded effects, such as savings for hospital costs due to reduced medication errors. Value restructuring refers to the value accrued from increased productivity by reengineering the business process.
III. Results
1. Characteristics of the Subjects
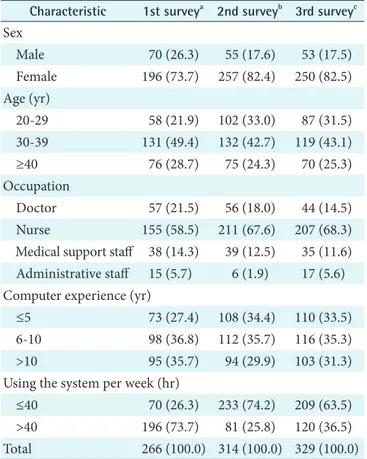
Characteristics of the subjects of three surveys were de-scribed in Table 1. In each survey, over 70% of the subjects were female as more than 50% of the subjects were nurses. Almost half of the subjects were in their age 30s; younger subjects (aged 20-29) participated less than the older sub-jects (aged 40 and over) in the first survey, however, they participated in the second and third surveys more than the older subjects. Doctors and nurses, who were the key users of EMR, were almost 80% of the subjects in all surveys. A
to-tal of 32 doctors participated in all three surveys. Over 60% of the subjects had more than seven years of computer expe-rience. Finally, less than 30% of the subjects used the system for 40 hours or less per week in the first survey, but more than 60% of the subjects used the system for 40 hours or less per week in the second and third surveys.
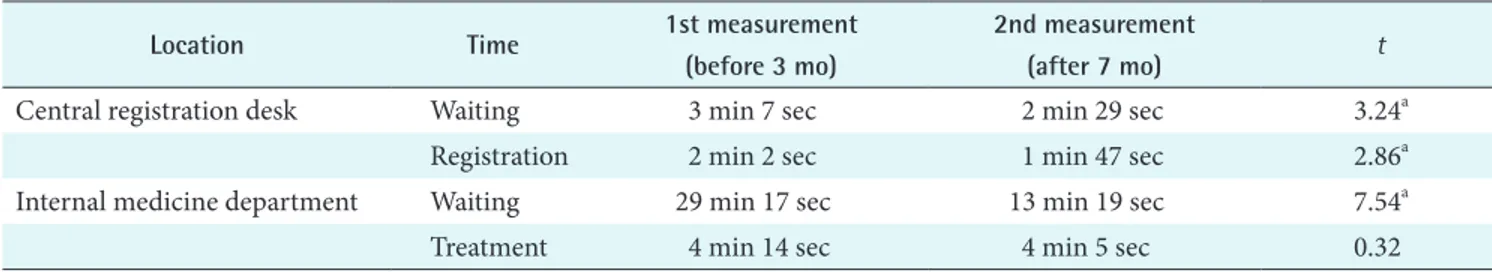
2. Waiting and Business Processing Time Measurement Both waiting time and registration time at the central reg-istration desk were significantly reduced after the introduc-tion of the system, as seen in Table 2. Waiting and business processing time at the internal medicine department was significantly reduced after the introduction of the system. Treatment time at the same department has also reduced, but the difference was not significant.
3. Qualitative Performance Evaluation
As see in Table 3, all KPI satisfaction scores in the input layer (system quality, information quality, and user understanding
Table 1. Characteristics of the users
Characteristic 1st surveya 2nd surveyb 3rd surveyc Sex Male 70 (26.3) 55 (17.6) 53 (17.5) Female 196 (73.7) 257 (82.4) 250 (82.5) Age (yr) 20-29 58 (21.9) 102 (33.0) 87 (31.5) 30-39 131 (49.4) 132 (42.7) 119 (43.1) ≥40 76 (28.7) 75 (24.3) 70 (25.3) Occupation Doctor 57 (21.5) 56 (18.0) 44 (14.5) Nurse 155 (58.5) 211 (67.6) 207 (68.3)
Medical support staff 38 (14.3) 39 (12.5) 35 (11.6) Administrative staff 15 (5.7) 6 (1.9) 17 (5.6) Computer experience (yr)
≤5 73 (27.4) 108 (34.4) 110 (33.5)
6-10 98 (36.8) 112 (35.7) 116 (35.3)
>10 95 (35.7) 94 (29.9) 103 (31.3)
Using the system per week (hr)
≤40 70 (26.3) 233 (74.2) 209 (63.5)
>40 196 (73.7) 81 (25.8) 120 (36.5)
Total 266 (100.0) 314 (100.0) 329 (100.0)
Values are presented as number (%).
aFirst survey was conducted three months before the system introduction. bSecond survey was conducted three months after the system introduction. cThird survey was conducted seven months after the system introduction.
Table 2. Outpatient waiting and business processing time
Location Time 1st measurement
(before 3 mo)
2nd measurement
(after 7 mo) t
Central registration desk Waiting 3 min 7 sec 2 min 29 sec 3.24a
Registration 2 min 2 sec 1 min 47 sec 2.86a
Internal medicine department Waiting 29 min 17 sec 13 min 19 sec 7.54a
Treatment 4 min 14 sec 4 min 5 sec 0.32
ap < 0.01.
Table 3. Key Performance Indicator (KPI) satisfaction scores by layers
Layer Category KPI Survey period F
1st 2nd 3rd
Input Information technology factor
System quality Response time 2.81 2.58 2.63 5.13a
System performance 2.88 2.35 2.38 26.37a
Information quality Upgrade frequency 3.35 3.15 3.26 6.48a
Problem solving 3.13 2.76 2.97 15.33a
Maintenance 3.14 3.04 3.10 1.24
User understanding of system Screen design 3.65 3.33 3.48 17.51a
Friendliness of screen 3.65 3.06 3.27 46.24a
Data input 3.32 2.85 2.98 24.89a
Inquiry time 3.36 2.78 3.04 36.20a
Text inquiry 3.38 2.87 3.07 28.36a
Information sharing Information sharing 3.14 2.77 3.02 18.85a
Security check Access control 3.09 3.21 3.32 7.16a
Virus protection 3.15 3.30 3.32 4.40b
Human factor
Top management support Mandatory use of system 3.31 3.27 3.39 2.41
Process Transaction process
Efficiency of process Reduction in costs 3.37 2.91 3.16 20.13a
Quality of business process Usefulness to business process 3.65 3.38 3.59 8.92a
Management process
Regulation management Observing regulation 3.87 3.79 3.78 1.39
Knowledge management Knowledge sharing 3.42 3.16 3.33 8.43a
Security management Reduction in security problems 3.64 3.80 3.77 2.62
Business Business aspects
Effectiveness in business Business quality 3.45 3.39 3.62 7.19a
Medical quality 3.53 3.08 3.32 24.10a
Reduction in medication errors 3.25 2.76 2.95 28.37a
User aspects
User satisfaction Improvement in work environment 3.47 3.01 3.24 22.97a
of system, information sharing and top management sup-port) except the security check initially decreased after three months of the introduction of the system and increased after seven months. However, both access control and virus protection scores in the security management were continu-ally increased three months prior to the introduction of the system. The changes in the KPI satisfaction scores were all statistically significant except for information maintenance and top management support.
In the process layer, the KPI satisfaction scores for effi-ciency of the process, quality process, and knowledge man-agement decreased after three months since the system in-troduction then increased after seven months. These changes in the KPI satisfaction scores were all statistically significant. On the other hand, the KPI satisfaction scores for observ-ing the regulation continually decreased, but for the security management the KPI satisfaction scores increased after three months from the system introduction then decreased after seven months. The changes in the latter two KPIs were not statistically significant.
In the business layer, all KPI satisfaction scores showed the same significant pattern in three survey periods. They de-creased after three months since the inception of the system, and increased after seven months.
4. Economic Performance Evaluation
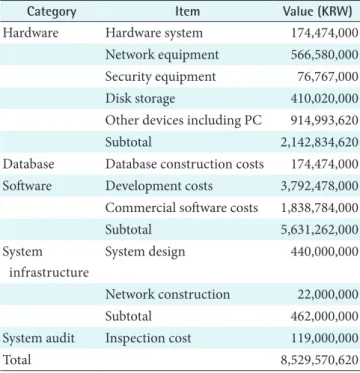
Cost items include hardware, database, software, system infrastructure, and system audit. Maintenance cost was zero
for the first year. The total cost was KRW 8,529,570,620 (about USD 7,107,975), as seen in Table 4.
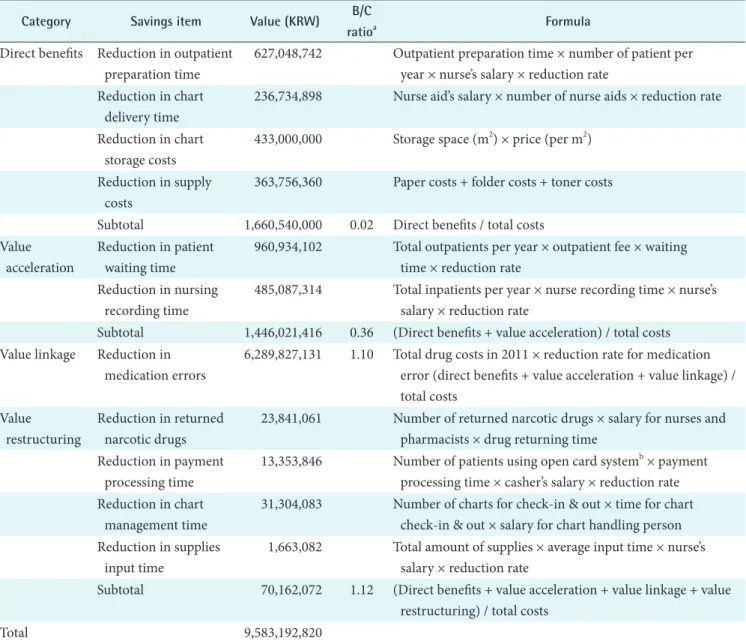
Direct benefits were savings from the reduction in out-patient preparation time, chart delivery time, chart stor-age costs, and supply costs. These amounted to KRW 1,660,540,000 and the benefit to cost (B/C) ratio was 0.019. The traditional cost-benefit analysis accounting for the direct benefits alone could not justify the costs. Value accelera-tion was the value associated with the time factor, such as the revenue increase due to the reduction in patient waiting time and the savings from the reduction in nursing record-ing time. These amounted to KRW 1,446,021,416, and the B/C ratio of the cumulative values increased to 0.36. Value linkage was the value accrued from all compounded effects, such as the savings from the reduction in medication errors. Medication errors obtained by multiplying the total amount of drug expenses by the reduction rate in medication er-rors were significantly reduced after the introduction of the system resulting in the highest increase in values which was. These amounted to KRW 6,289,827,131 and the B/C ratio of the cumulative values increased to 1.10. Finally, value restructuring was the value accrued from the increased ef-ficiency in business process, such as the savings from the reduction in returned narcotic drugs, accounting processing time, chart management time, and supplies input time. These amounted to KRW 70,162,072. The final B/C ratio of the cu-mulative values KRW 9,583,190,820 (about USD 8,599,417) increased to 1.12. Accordingly, the IE analysis showed the economic profitability of the new system if all intangible benefits were included, as seen in Table 5.
IV. Discussion
NHIIH began the implementation of the newly integrated hospital information system on November 4, 2011. Three months prior to its implementation, performance of the old information system was qualitatively evaluated based on PRM in order to identify problematic areas for the old system and collect the baseline data to compare with the performance of the new system. All KPI satisfaction scores in the input layer (system quality, information quality, and recognition of user’s information, information share and top management support) except the security check initially de-creased after three months of the introduction of the system and increased after seven months. This result coincides with the study of Kim and Choi [10]. However, both access con-trol and virus protection scores in the security management continually increased since the introduction of the system. This may be due to the fact that the electronic signatures
Table 4. Cost summary of hospital information system imple-mentation
Category Item Value (KRW)
Hardware Hardware system 174,474,000
Network equipment 566,580,000
Security equipment 76,767,000
Disk storage 410,020,000
Other devices including PC 914,993,620
Subtotal 2,142,834,620
Database Database construction costs 174,474,000
Software Development costs 3,792,478,000
Commercial software costs 1,838,784,000
Subtotal 5,631,262,000 System infrastructure System design 440,000,000 Network construction 22,000,000 Subtotal 462,000,000
System audit Inspection cost 119,000,000
were required in every record and overall security check for access control were reinforced after the introduction of the new system.
In the process layer, the KPI satisfaction scores for effi-ciency of the process, quality process, and knowledge man-agement decreased after three months since the system in-troduction then increased after seven months of the system implementation. On the other hand, the satisfaction scores for observing the regulation continually decreased perhaps due to the confusion in the process of adjusting to the new working process. In the business layer, all KPI scores showed the same significant pattern in three surveys. They decreased after the first three months and increased after seven months. Economic analysis was performed for the newly developed
HIS by using the IE approach in order to systematically quantify the intangible benefits. IE attempts to categorize the benefits into the following five value types: direct benefits, value acceleration, value linkage, value restructuring, and innovation valuation. While actual hospital data were used in most of the analysis, some data were extrapolated from the literature if actual data were not available. The patient waiting time for two outpatient departments were compared before and after the introduction of the system in order to estimate the time savings from the reduction in waiting time. The B/C ratio was 0.02 if only the direct benefit was included, but increased to 0.36 with the addition of value ac-celeration, to 1.10 with value linkage, and to 1.12 with value restructuring. Medication errors were significantly reduced
Table 5. Benefit summary of HIS implementation
Category Savings item Value (KRW) B/C
ratioa Formula
Direct benefits Reduction in outpatient preparation time
627,048,742 Outpatient preparation time × number of patient per year × nurse’s salary × reduction rate
Reduction in chart delivery time
236,734,898 Nurse aid’s salary × number of nurse aids × reduction rate Reduction in chart
storage costs
433,000,000 Storage space (m2) × price (per m2) Reduction in supply
costs
363,756,360 Paper costs + folder costs + toner costs Subtotal 1,660,540,000 0.02 Direct benefits / total costs
Value acceleration
Reduction in patient waiting time
960,934,102 Total outpatients per year × outpatient fee × waiting time × reduction rate
Reduction in nursing recording time
485,087,314 Total inpatients per year × nurse recording time × nurse’s salary × reduction rate
Subtotal 1,446,021,416 0.36 (Direct benefits + value acceleration) / total costs Value linkage Reduction in
medication errors
6,289,827,131 1.10 Total drug costs in 2011 × reduction rate for medication error (direct benefits + value acceleration + value linkage) / total costs
Value restructuring
Reduction in returned narcotic drugs
23,841,061 Number of returned narcotic drugs × salary for nurses and pharmacists × drug returning time
Reduction in payment processing time
13,353,846 Number of patients using open card systemb × payment processing time × casher’s salary × reduction rate Reduction in chart
management time
31,304,083 Number of charts for check-in & out × time for chart check-in & out × salary for chart handling person Reduction in supplies
input time
1,663,082 Total amount of supplies × average input time × nurse’s salary × reduction rate
Subtotal 70,162,072 1.12 (Direct benefits + value acceleration + value linkage + value restructuring) / total costs
Total 9,583,192,820
after the introduction of the system resulting in the highest increase in values. The previous study on the economic ef-fects of hospital information systems shows similar findings. Bates et al. [11] reported that CPOE and clinical decision support system reduced medication error rates by 55%. In a similar study, Kaushal et al. [3] reported that CPOE saved a total of 28.5 million dollars during 11 years of its operation at the Brigham and Women’s Hospital. The largest cumula-tive savings were from renal dosing guidance (USD 6.3 mil-lion), improved nursing time utilization (USD 6.0 milmil-lion), specific drug guidance (USD 4.9 million), and adverse drug events (ADE) prevention (USD 3.7 million). Wu et al. [4] found the similar savings from the reduction in ADEs at the Toronto General Hospital. They estimated that 261 ADEs were prevented resulting in USD 3,322,000 over the 10-year time horizon. Girosi et al. [12] also found that hospitals with more than 100 beds can save 1 billion dollars annually by re-ducing the 20,000 side effects of drug. The IE analysis dem-onstrated the economic profitability of the new system when all intangible benefits were included.
There are limitations with the qualitative and quantitative evaluation. First, many users at NHIIS were still not satis-fied with the system because some user requirements were not fully reflected to the system there were frequent changes in the program. Second, some medication error data were based on the limited study of economic evaluation at one hospital so that the results are not generalizable to other institutions. Finally, our maintenance cost was zero and this resulted in lower implementation costs. Implementation costs could vary depending on the type of institution. In the future, performances of the new system should be evaluated again after the system is more stabilized. Specifi-cally, the KPIs from the previous survey should be compared with the KPIs from the fourth survey to determine whether the new information system will further improve user satis-faction, especially for medical staffs, and improve efficiency in the business process. In addition, some economic data were based on institutional estimates and this requires fur-ther study to improve accuracy in economic evaluation.
Conflict of Interest
No potential conflict of interest relevant to this article was reported.
Acknowledgments
This article is supported by the grant from the National Health Insurance Corporation Ilsan Hospital. The authors
wish to express sincere gratitude to those who responded to surveys and to provide information for the economic analy-sis.
References
1. Federal Enterprise Architecture. FEA consolidated ref-erence model document version 2.3. Washington, DC: The Office of Management and Budget; 2007.
2. Chung KH, Moon JW, Moon MJ, Kim HS. Methodology for performance evaluation of public information sys-tems. Gwacheon: Korea Information Society Develop-ment Institute; 2008.
3. Kaushal R, Jha AK, Franz C, Glaser J, Shetty KD, Jaggi T, et al. Return on investment for a computerized physi-cian order entry system. J Am Med Inform Assoc 2006; 13(3):261-6.
4. Wu RC, Laporte A, Ungar WJ. Cost-effectiveness of an electronic medication ordering and administration sys-tem in reducing adverse drug events. J Eval Clin Pract 2007;13(3):440-8.
5. Parker MM, Trainor HE, Benson RJ. Information strate-gy and economics: linking information systems stratestrate-gy to business performance. Englewood Cliffs (NJ): Pren-tice Hall; 1989.
6. Chae YM, Lee HJ, Park CR. Economic analysis of order communication system for hospitals. Korean J Prev Med 1991;24(4):473-84.
7. Chae YM, Kim S, Cho KW, Kim HS, Kang SH, Kim HH, et al. Economic analysis of hospital information sys-tem by information economic approach. J Korean Soc Health Stat 2010;35(2):195-205.
8. Kang SH, Chung YI, Chae YM. Economic analysis of electronic patient record. J Korean Soc Med Inform 1997; 3(1):37-47.
9. Chae YM, Cho KW, Kim HS, Park CB. Evaluation of hospital information system based on the performance reference model. J Korean Soc Health Serv Manag 2011; 5(1):1-13.
10. Kim JI, Choi JY. Effectiveness for hospitals management of electronic medical record. 2009;11(1):87-93.
11. Bates DW, Leape LL, Cullen DJ, Laird N, Petersen LA, Teich JM, et al. Effect of computerized physician order entry and a team intervention on prevention of serious medication errors. JAMA 1998;280(15):1311-6.
12. Girosi F, Meili RC, Scoville R. Extrapolating evidence of health information technology savings and costs. Santa Monica: RAND Corporation; 2005. Report no.: MG-410-HLTH.