Research Article
Internalization and Transportation of Endothelial Cell Surface
K
Ca
2.3 and K
Ca
3.1 in Normal Pregnancy and Preeclampsia
Shinkyu Choi
,
1Ji Aee Kim,
1Seikwan Oh
,
2Mi Hye Park,
3Geum Joon Cho,
4and Suk Hyo Suh
11Department of Physiology, Medical School, Ewha Womans University, Seoul 07985, Republic of Korea
2Department of Molecular Medicine, Medical School, Ewha Womans University, Seoul 07985, Republic of Korea
3Department of Obstetrics and Gynecology, Medical School, Ewha Womans University, Seoul 07985, Republic of Korea
4Department of Obstetrics and Gynecology, Medical School, Korea University, Seoul 08308, Republic of Korea
Correspondence should be addressed to Suk Hyo Suh; shsuh@ewha.ac.kr
Received 3 May 2019; Revised 25 September 2019; Accepted 5 November 2019; Published 23 November 2019 Academic Editor: Alin Ciobica
Copyright © 2019 Shinkyu Choi et al. This is an open access article distributed under the Creative Commons Attribution License, which permits unrestricted use, distribution, and reproduction in any medium, provided the original work is properly cited.
Altered redox state modulates the expression levels of endothelial KCa2.3 and KCa3.1 (KCas) in normal pregnancy (NP) and preeclampsia
(PE), thereby regulating vascular contractility. The mechanisms underlying KCas endocytosis and transportation remain unknown. We
investigated the regulation of KCas expression in plasma membrane (PM) during NP and PE. Cultured human uterine artery
endothelial cells were incubated in serum from normal nonpregnant women and women with NP or PE, or in oxidized LDL-, or
lysophosphatidylcholine- (LPC-) containing a medium for 24 hours. NP serum elevated PM levels of KCas and reduced caveolin-1
and clathrin levels. PE serum, oxidized LDL, or LPC reduced PM levels of KCas and elevated caveolin-1, clathrin, Rab5c, and early
endosome antigen-1 (EEA1) levels. Reduced KCas levels by PE serum or LPC were reversed by inhibition of caveolin-1, clathrin, or
EEA1. Catalase and glutathione peroxidase 1 (GPX1) knockdown elevated PM-localized KCas levels and reduced caveolin-1 and
clathrin levels. Elevated KCa2.3 levels upon catalase and GPX1 knockdown were reversed by PEG-catalase treatment. An H2O2donor
reduced clathrin and Rab5c. In contrast, elevated clathrin, caveolin-1, or colocalization of caveolin-1 with KCa3.1 by PE serum or LPC
was reversed by NADPH oxidase inhibitors or antioxidants. A superoxide donor xanthine+xanthine oxidase elevated caveolin-1 or
Rab5c levels. We concluded that KCas are endocytosed in a caveola- or a clathrin-dependent manner and transported in a Rab5c- and
EEA1-dependent manner during pregnancy. The endocytosis and transportation processes may slow down via H2O2-mediated
pathways in NP and may be accelerated via superoxide-mediated pathways in PE.
1. Introduction
KCa2.3 and KCa3.1 play an important role in endothelial
con-trol of vascular contractility. Activation of these K+channels induces K+ efflux and endothelial hyperpolarization, which hyperpolarize vascular smooth muscle cells (VSMCs) by acti-vating inward-rectifier K+channels and spreading to VSMCs through gap junctions, respectively [1–3]. In addition, endo-thelial hyperpolarization enhances Ca2+entry through Ca2+ -permeable channels such as transient receptor potential channels by increasing its electrical driving force and elevates intracellular Ca2+ levels [4], which stimulates nitric oxide (NO) production in endothelial cells (ECs) [5]. NO and
VSM hyperpolarization relax blood vessels, thereby control-ling vascular contractility. The contribution of NO and VSM hyperpolarization to the control of vascular contractility might vary between conduit arteries and resistant arteries. The contribution of NO was most prominent in the aorta, whereas that of VSM hyperpolarization was most prominent in the distal mesenteric arteries, suggesting that VSM hyperpolarization plays a more important role in the con-trol of vasorelaxation in resistant arteries than in conduit arteries [6–9]. Since resistant arteries are the main regula-tors of systemic vascular resistance, endothelial KCa2.3 and KCa3.1 might play an important role in the regulation of
blood pressure.
Volume 2019, Article ID 5820839, 13 pages https://doi.org/10.1155/2019/5820839
Since endothelial hyperpolarization is caused by KCa2.3
and KCa3.1 activation, the magnitude of endothelial
hyperpo-larization may be affected by the expression levels of these K+
channels in plasma membrane (PM). Thus, KCa2.3 and KCa3.1
upregulation might increase endothelial hyperpolarization, thereby potentiating L-NAME-resistant, KCa2.3 and KCa3.1
activation-induced endothelium-dependent relaxation, as shown in blood vessels during aging process and normal preg-nancy (NP) [10, 11]. On the contrary, downregulation of KCa2.3 and KCa3.1 activity and expression causes endothelial
dysfunction, thereby developing vascular diseases, such as preeclampsia (PE) and Fabry disease [10, 12–14].
KCa2.3 and KCa3.1 levels are affected by various stimuli,
such as sphingolipids and redox state. KCa3.1 upregulation
was caused by an altered sphingolipid profile via a H2O2/Fyn-mediated pathway during the aging process,
whereas globotriaosylceramide downregulated KCa3.1 in Fabry disease [14]. KCa2.3 and KCa3.1 levels were regulated by the altered redox state in pregnancy [10]. KCa2.3 and KCa3.1 were upregulated by soluble serum factors, such as
vas-cular endothelial growth factor (VEGF) in NP. H2O2plays an
important role in KCa2.3 and KCa3.1 upregulation during
aging [11] and NP [10]. On the other hand, KCa2.3 and
KCa3.1 were downregulated by serum factors, such as
proges-terone and oxidized low-density lipoprotein (LDL) through superoxide generation in PE [10].
Our previous study explains how membrane levels of KCa3.1 are reduced in Fabry disease. Clathrin-dependent inter-nalization, Rab5c, early endosome antigen-1- (EEA1-) depen-dent transportation, and lysosomal degradation were involved in globotriaosylceramide-induced KCa3.1 downregulation in
Fabry disease [12]. However, little is known about how mem-brane levels of KCa2.3 and KCa3.1 are regulated in NP and
PE. Thus, we investigated the regulation of KCa2.3 and KCa3.1
expression in PM during NP and PE and found that endothe-lial KCa2.3 and KCa3.1 are internalized from PM via caveola- or
clathrin-dependent pathways. Rab5c and early EEA1 were involved in transportation of the internalized K+channel pro-teins. Moreover, KCa2.3 and KCa3.1 internalization and trans-portation processes were delayed in NP and facilitated in PE.
2. Materials and Methods
Studies involving human subjects were approved by the local ethics committee, the Institutional Review Board of the Ewha Womans University Mokdong Hospital, and Korea University Guro Hospital and were conducted in accordance with the Declaration of Helsinki. All patients provided their written informed consent prior to the inclusion in this study. Experiments with mice were approved by the local ethics committee and the Institutional Review Board of the Ewha
Womans University Mokdong Hospital and were conducted in accordance with the Declaration of Helsinki, the Animal Care Guidelines of the Ewha Womans University, Medical School, and the National Institutes of Health Guide for the Care and Use of Laboratory Animals.
2.1. Human Subjects. The study population consisted of Asian women who were not pregnant or had either a NP or PE (Table 1). Pregnancies were considered normal when patients did not have medical and obstetric complications of pregnancy and delivered a newborn at a gestational age of 37-42 weeks. Preeclampsia was defined by a systolic blood pressure over 140 mmHg and a diastolic blood pressure over 90 mmHg after 20 weeks of gestation in a previously normo-tensive woman, and the onset of proteinuria exceeding 300 mg of protein during 24 hours of urine collection. Non-pregnant women were healthy premenopausal volunteers taking no medications. Preeclamptic patients and normal pregnant women were matched for age (±3 years) and gesta-tional age (±2 weeks), and nonpregnant healthy female volun-teers were matched for age (±3 years). Blood samples were obtained from subjects during the third trimester of preg-nancy. The study population was monitored at the Depart-ment of Obstetrics and Gynecology from the first trimester until their pregnancy was completed without complications. Exclusion criteria included the following: altered renal func-tion, diabetes or chronic diseases, twin pregnancies, recurrent miscarriages, fetal growth retardation, and abruptio placenta. Smokers and women with a history of essential hypertension were also excluded from this study. Gestational age was defined as the interval between the first day of the mother’s last menstrual period and the date of delivery.
2.2. Animals and Tissue Collection. We studied young C57BL/6 wild-type mice (about 20-week-old; n = 24), and catalase/glutathione peroxidase 1 (GPX1) double knockout (catalase-/-/GPX1-/-) mice (about 20-week-old; n = 18), gen-erously donated by Dr. Ye-Shih Ho (Wayne State Medical School, Detroit, MI) [15]. Mice were anesthetized by an intraperitoneal injection of pentobarbital sodium (50 mg/kg body weight) and sacrificed by cervical dislocation.
2.3. Cell Culture and Serum Treatment. Human uterine microvascular ECs (HUtMECs), which were purchased from PromoCell GmbH (Heidelberg, Germany), were maintained in EC Growth Medium MV2 (PromoCell GmbH). For serum treatment, HUtMECs were plated in 6-well plates for 24 hours. The concentration of fetal bovine serum in a culture medium was gradually decreased from 10% to 5, 2, and 0% over 30 minutes, and HUtMECs were incubated in a serum-free medium for 30 minutes. After that, a culture
Table 1: Blood pressure levels of subject groups.
Group Normal nonpregnancy (n = 8) Normal pregnancy (n = 15) Preeclamptic pregnancy (n = 12)
Systolic blood pressure (mmHg) 115:0 ± 1:0 117:7 ± 1:7 153:0 ± 3:2
Diastolic blood pressure (mmHg) 74:0 ± 1:7 77:4 ± 2:1 97:7 ± 2:9
medium was substituted with serum from normal nonpreg-nancy (NNP) women or women with NP or PE, and the cells were incubated for 24 hours.
Mouse aortic endothelial cells (MAECs) were isolated from the mouse aortas as described [16]. Briefly, periadventi-tial fats and connective tissues around the aorta were care-fully cleaned in Ca2+-free phosphate-buffered saline under a dissecting microscope. Matrigel (BD Biosciences, San Jose, CA) was plated and polymerized at 37°C for 30 minutes. After that, aorta pieces were placed with the intima side down on the Matrigel. To demonstrate the endothelial nature of the cell, 1,1′-dioctadecyl-3,3,3′,3′-tetramethyl-indocarbo-cyanine perchlorate-labeled acetylated low-density lipopro-tein (Biomedical Technologies Inc., Stoughton, MA) uptake assay was employed. MAECs were used within 2 passages and not above 3 passages.
2.4. Immunoblotting and Immunoprecipitation. For immu-noblotting, cell lysates were used to examine the protein level. After proper processing of each type of sample, total protein was measured using the bicinchoninic acid assay (Pierce Bio-technology, Rockford, IL). The same amount of total protein was analyzed using SDS-PAGE on 7.5–12% gels and trans-ferred to nitrocellulose membrane (Invitrogen, Eugene, OR). Membranes were blocked for 1 hour in 5% bovine serum albumin in Tris-buffered saline with 0.1% Tween-20 and incubated overnight at 4°C with primary antibodies (Abs) diluted in blocking buffer. Membranes were then washed three times with Tris-buffered saline with 0.1% Tween-20 and incubated for 1 hour with horseradish peroxidase-conjugated secondary Abs diluted in blocking buffer. The immunoblots were visualized by chemilumines-cence reagents bought from GE Healthcare (Piscataway, NJ). Data processing was performed using a luminescent image analyzer LAS-3000 (Fujifilm, Tokyo, Japan) and IMAGE GAUSE software.
For immunoprecipitation, cells were washed twice with phosphate buffer saline and lysed in lysis buffer containing protease inhibitor cocktail (Sigma-Aldrich, St. Louis, MO) at 4°C for 1 hour. The lysate samples were prepared by cen-trifugation at 12000× g for 30 minutes to eliminate the cell debris. Total protein concentration was estimated as described above. The lysate samples were precleared with a nonspecific IgG Ab. Total 30 μL of 50% protein G-coupled dynabead slurry (Invitrogen) was added to an Ab (1-5μg) diluted in 200μL phosphate buffer saline with Tween 20, incubated for 15 minutes at room temperature (about 20°C) with rotating, and washed. Precleared lysate samples were incubated with the dynabeads-Ab by rotating at 4°C over-night or at room temperature for 30 minutes. Following that, the dynabeads-antigen-Ab complexes were washed three times with the lysis buffer, and the antigen was eluted in 2x SDS-PAGE sample buffer by heating at 70°C for 10 minutes. Immunoprecipitates were separated using 7.5–12% SDS-PAGE and analyzed by immunoblotting.
2.5. Biotinylation of Cell Surface Protein. Cells were washed twice with phosphate buffer saline and labeled with 1 mM sulfosuccinimidyl-2-(biotinamido)ethyl-1,
3-dithiopropionate (EZ-Link-sulfo-NHS-SS-biotin; Pierce Biotechnology) in labeling buffer (150 mM NaCl, 20 mM HEPES, 3 mM CaCl2, and 1 mM MgCl2) for 30 minutes to
1 hour at room temperature. After the cells were washed, any nonreacted biotinylation reagent was quenched with 100 mM glycine, the cells were lysed in NP40 lysis buffer, and the proteins were incubated with 30μL of dynabead M-280 streptavidin (Invitrogen) for 3 hours at 4°C with rotation and then washed three times with lysis buffer. The proteins were eluted from streptavidin bead in 2x SDS-PAGE sample buffer by heating at 65°C for 5 minutes.
Supernatant was subjected to 7.5–12% SDS-PAGE and analyzed by immunoblotting.
2.6. siRNA Transfection. Negative control siRNAs (SN-1012) and siRNAs against EEA1 (SDH-1001) were purchased from Bioneer (Daejeon, Korea). Negative control siRNAs (sc-36869) and siRNAs against NADPH oxidase 4 (NOX4; sc-41586) were purchased from Santa Cruz Bio-technology. ECs were transiently transfected with the siRNAs using an siRNA transfection reagent (Santa Cruz Biotechnol-ogy) according to the procedure suggested by the manufac-turer. Cell lysates were prepared 24 hours after transfection, and immunoblotting was performed using anti-EEA1 Abs. 2.7. Electrophysiology. The patch-clamp technique was used in whole-cell configurations at 20-22°C. Whole-cell currents were measured using ruptured patches and monitored in voltage-clamp modes with an EPC-9 (HEKA Elektronik, Lambrecht, Germany). The holding potential was 0 mV, and currents were monitored by the repetitive application of voltage ramps from−100 to +100 mV with a 10-second interval (sampling interval 0.5 milliseconds, 650 millisec-ond duration). The standard external solution contained (in mM) 150 NaCl, 6 KCl, 1.5 CaCl2, 1 MgCl2, 10 HEPES, and 10 glucose, pH adjusted to 7.4 with NaOH. The pipette solution for whole-cell recording contained (in mM) 40 KCl, 100 K-aspartate, 2 MgCl2, 0.1 EGTA, 4 Na2ATP, and
10 HEPES, pH adjusted to 7.2 with KOH. To buffer free Ca2+, the appropriate amount of Ca2+ (calculated using CaBuf software; G. Droogmans, Leuven, Belgium) was added in the presence of 5 mM EGTA.
KCa3.1 currents were activated by loading 1μM Ca2+via a
patch pipette in whole-cell clamped MAECs. KCa3.1 current
was normalized to cell capacitance, and the selective KCa3.1 blocker TRAM-34-sensitive current was measured as the KCa3.1 current.
2.8. Reagents. Reagents were purchased from Sigma-Aldrich (St. Louis, MO) and dissolved in sterilized distilled water unless indicated otherwise. The cells were treated with xan-thine+xanthine oxidase (X/XO), tert-butylhydroperoxide (TBHP), or oxidized LDL (Intracel Inc., Frederick, MD) or the major component of oxidized LDL, lysophosphatidylcho-line (LPC; dissolved in chloroform : methanol, 2 : 1) for 24 hours. Abs specific to lectin-like oxidized LDL receptor 1 (LOX1; ab81709, Abcam, Cambridge, MA), chlorpromazine (CPZ; C8138), or methyl-β-cyclodextrin (MβCD; C4555) were pretreated for 1 hour. Abs against KCa2.3 (sc-28621),
KCa3.1 (sc-32949), GAPDH (sc-25778), and β-actin
(sc-130656) were purchased from Santa Cruz Biotechnology (Santa Cruz, CA).
The final concentration of DMSO, chloroform, or methanol in media was less than 0.1%, and these solvents did not have any effect on the experiments tested in this study (data not shown).
2.9. Statistics. Data representmean ± SEM. To prove the sta-tistical significance between groups, one-way ANOVA with Bonferroni’s post hoc or 2-tailed Student’s t-test was used. A P value of 0.05 or lower was considered statistically sig-nificant. Calculations were performed with SPSS 14.0 for Windows (SPSS, Chicago, IL).
3. Results
3.1. Endothelial Membrane Levels of KCa2.3 and KCa3.1 Are
Altered during Pregnancy. We compared the effects of soluble serum factors from NNP and NP women on PM-localized KCa2.3 or KCa3.1 levels by incubating HUtMECs in serum
from NNP and NP women for 24 hours. KCa2.3 or KCa3.1
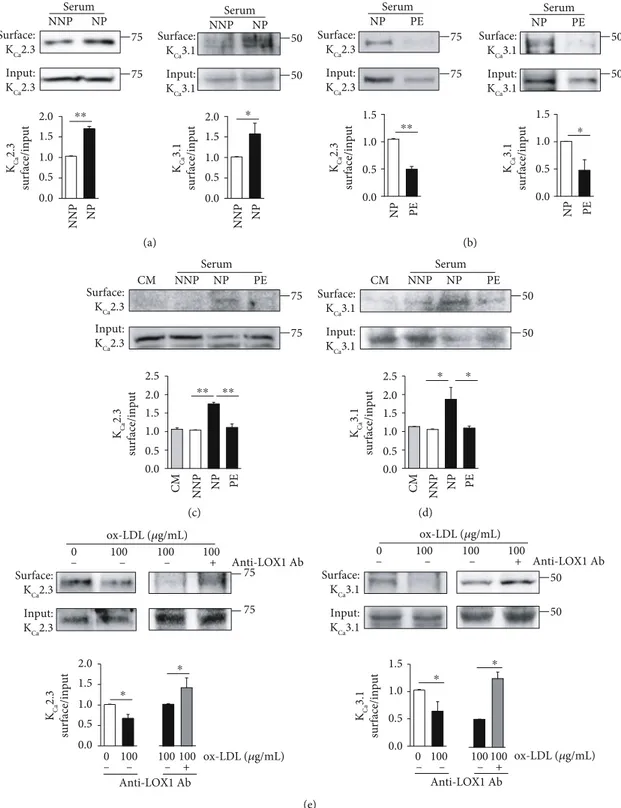
proteins were biotinylated at the cell surface and labeled with horseradish peroxidase-conjugated streptavidin. The levels of PM-localized KCa2.3 or KCa3.1 were significantly higher in ECs treated with NP serum than in ECs treated with NNP serum (Figure 1(a)). We then compared the effects of serum from NP and PE women on PM levels of KCa2.3 or KCa3.1 in
HUtMECs. The levels of PM-localized KCa2.3 or KCa3.1
pro-teins were significantly lower in ECs treated with PE serum than in ECs treated with NP serum (Figure 2(b)). In addition, we compared the effect of serum from NNP, NP, and PE women on PM levels of KCa2.3 (Figure 1(c)) or KCa3.1
(Figure 1(d)) in HUtMECs. The levels of PM-localized KCa2.3 or KCa3.1 were not changed in ECs treated with NNP serum, compared to those treated with normal culture medium (CM), and were elevated in ECs treated with NP serum, compared to those treated with NNP serum or CM. Increases in the KCa2.3 or KCa3.1 levels were significantly
reduced in ECs treated with PE serum than in ECs treated with NP serum. Since oxidized LDL is among the causative factors to induce endothelial dysfunction in PE, we examined the effects of oxidized LDL on PM levels of KCa2.3 and KCa3.1
by incubating HUtMECs in oxidized LDL containing a culture medium for 24 hours. We found that the levels of PM-localized KCa2.3 or KCa3.1 were significantly reduced upon incubation (Figure 1(e)). Reduced KCa2.3 or KCa3.1
levels by oxidized LDL treatment were reversed by block-ing the oxidized LDL receptors usblock-ing an anti-LOX1 Ab (Figure 1(e)). These results suggest that the expression and localization of KCa2.3 or KCa3.1 in PM are elevated
in NP compared to that in NNP, and the elevation was attenuated in PE.
3.2. Caveolae and Clathrin Are Involved in the Internalization of KCa2.3 and KCa3.1. The levels of PM-localized proteins, such as ion channels, can be modulated by caveola-dependent internalization. Caveolins, the essential structural elements of caveolae, are suggested to be scaffolding proteins
that facilitate the compartmentalization of various signaling molecules or proteins within caveolae. We thus investigated whether caveola-dependent internalization of KCa2.3 or
KCa3.1 occurs during pregnancy by examining Cav-1 levels.
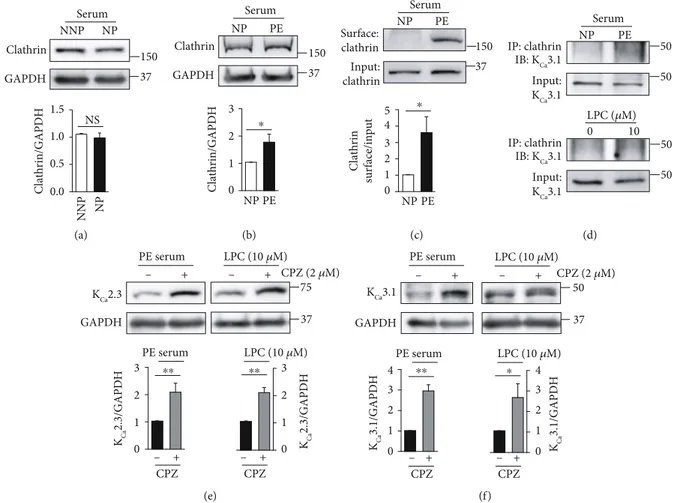
Cav-1 levels were markedly lower in the ECs treated with NP serum than in ECs treated with NNP serum, and VEGF receptor (VEGFR) inhibition using an anti-VEGFR1 Ab or anti-VEGFR2 Ab enhanced Cav-1 levels in ECs treated with NP serum (Figure 2(a)), indicating that NP serum decreases Cav-1 levels via VEGFR activation. In contrast, Cav-1 levels were markedly higher in ECs treated with PE serum than in ECs treated with NP serum (Figure 2(b)). In addition, LPC, the major component of oxidized LDL, enhanced Cav-1 levels in a concentration-dependent manner (Figure 2(b)). To confirm the presence of Cav-1 in the inner leaflet of the PM, the cell surface was biotinylated with a membrane impermeable agent (NHS-SS-biotin). Biotinylated PM pro-teins from whole cell lysates were isolated on a streptavidin column and, following elution and SDS-PAGE, were blotted for Cav-1 with anti-Cav-1 Ab. PM localization of Cav-1 was significantly elevated upon treatment with oxidized LDL (Figure 2(c)). We then examined whether caveolae are involved in the regulation of the levels of KCa2.3 or KCa3.1.
Colocalization of KCa3.1 with Cav-1 was examined using
coimmunoprecipitation. Colocalization of KCa3.1 with Cav-1 was markedly higher in ECs treated with PE serum than in ECs treated with NP serum (Figure 2(d)). Cav-1 inhi-bition using the Cav-1 inhibitor MβCD elevated KCa2.3 (Figure 2(e)) or KCa3.1 (Figure 2(f)) levels in ECs treated with
PE serum or LPC. These results suggested that caveola-dependent internalization is involved in regulating the PM localization of KCa2.3 or KCa3.1 during pregnancy.
Caveola-dependent internalization process might be delayed in NP, whereas it might be facilitated in PE.
Previously, we reported that KCa3.1 proteins on the PM are internalized via a clathrin-dependent process in Fabry disease [12]. We, therefore, examined whether clathrin-dependent internalization is involved in regulating PM local-ization of KCa2.3 or KCa3.1 during pregnancy. Clathrin levels
were not altered in ECs treated with NNP or NP serum (Figure 3(a)). In contrast, clathrin levels were markedly higher in the ECs treated with PE serum than in ECs treated with the NP serum (Figure 3(b)). Then, clathrin protein was biotinylated at the cell surface. PM clathrin levels were signif-icantly higher in ECs treated with PE serum than in ECs treated with NP serum (Figure 3(c)). Colocalization of KCa3.1 with clathrin was markedly enhanced in ECs treated with PE serum than in ECs treated with NP serum, and LPC markedly increased colocalization of KCa3.1 with
cla-thrin (Figure 3(d)). Furthermore, the clacla-thrin inhibitor chlorpromazine enhanced KCa2.3 (Figure 3(e)) and KCa3.1
levels (Figure 3(f)) in ECs treated with PE serum or LPC. These results suggest that KCa2.3 and KCa3.1 are internalized
via a clathrin-dependent process. Clathrin-dependent inter-nalization process might not be affected in NP, whereas it might be facilitated in PE.
3.3. A Rab5c- and EEA1-Dependent Process Mediates KCa2.3
play a rate-limiting role in membrane docking or fusion in the early endocytic pathway [17, 18], and our previous study suggested that KCa3.1 is transported into early endosomes via a Rab5c- and EEA1-dependent process in Fabry disease [12]. We thus examined whether a Rab5c- and EEA1-dependent
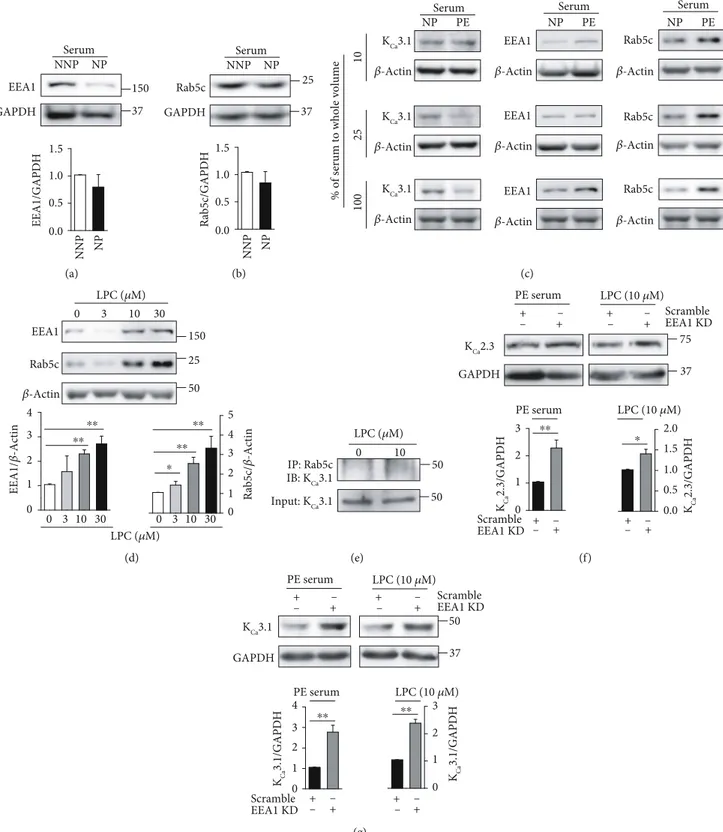
process mediates KCa2.3 and KCa3.1 transportation during pregnancy. Compared to ECs treated with NNP serum, levels of EEA1 (Figure 4(a)) or Rab5c (Figure 4(b)) were slightly decreased in the ECs treated with NP serum. However, sig-nificant difference was not found in ECs treated with NNP
Surface: KCa3.1 Input: KCa3.1 50 50 Serum NNP NP Surface: KCa2.3 Input: KCa2.3 Serum NNP NP 75 75 KCa 2.3 surface/input KCa 3.1 surface/input NNP NP NNP NP ⁎⁎ ⁎ 2.0 1.5 1.0 0.5 0.0 2.0 1.5 1.0 0.5 0.0 (a) Surface: KCa2.3 Input: KCa2.3 Serum NP PE Surface: KCa3.1 Input: KCa3.1 Serum NP PE 75 75 50 50 NP PE NP PE KCa 2.3 surface/input KCa 3.1 surface/input ⁎⁎ ⁎ 1.5 1.0 0.5 0.0 1.5 1.0 0.5 0.0 (b) Surface: KCa2.3 Input: KCa2.3 Serum CM NNP 75 75 NP PE KCa 2.3 surface/input NNP NP PE CM ⁎⁎ ⁎⁎ 2.0 2.5 1.5 1.0 0.5 0.0 (c) Surface: KCa3.1 Input: KCa3.1 Serum 50 50 KCa 3.1 surface/input PE CM NNP NP PE NP CM NNP ⁎ ⁎ 2.0 2.5 1.5 1.0 0.5 0.0 (d) KCa 2.3 surface/input Surface: KCa3.1 Input: KCa3.1 50 50 KCa 3.1 surface/input 75 75 Surface: KCa2.3 Input: KCa2.3 + ox-LDL (𝜇g/mL) Anti-LOX1 Ab ox-LDL (𝜇g/mL) Anti-LOX1 Ab ox-LDL (𝜇g/mL) Anti-LOX1 Ab – – – 0 100 100 100 0 100 100 100 + – – – – – – + ox-LDL (𝜇g/mL) Anti-LOX1 Ab ⁎ ⁎ ⁎ ⁎ 0 100 100 100 + – – – 0 100 100 100 2.0 1.5 1.0 0.5 0.0 1.5 1.0 0.5 0.0 (e)
Figure 1: Membrane levels of KCa2.3 and KCa3.1 are altered in NP and PE. (a) PM levels of KCa2.3 and KCa3.1 in ECs treated with NNP or NP
serum. (b) PM levels of KCa2.3 and KCa3.1 in ECs treated with NP or PE serum. (c, d) PM levels of KCa2.3 (c) and KCa3.1 (d) in ECs treated
with CM, NNP serum, NP serum, or PE serum. (e) PM levels of KCa2.3 or KCa3.1 in ECs treated with oxidized LDL. Reduced KCa2.3 or KCa3.1
levels were reversed by blocking oxidized LDL receptor using an anti-LOX1 Ab. Blots shown are representative of the three tofive experiments
or NP serum. Then, NP or PE serum was diluted with the cul-ture medium. Compared to the diluted NP serum, the diluted PE serum (10%, 25%, and 100% serum) reduced KCa3.1 levels
and increased Rab5c and EEA1 levels in a concentration-dependent manner (Figure 4(c)), indicating that KCa3.1 levels
are inversely related to Rab5c and EEA1 levels. In addition,
GAPDH Cav-1 Cav-1/GAPDH 25 37 Serum NNP NP NNP NP NNP NP NNP NP NP+ Anti-VEGFR1 Ab NP+ Anti-VEGFR2 Ab NP+anti- VEGFR1 Ab NP+ Anti-VEGFR2 Ab ⁎⁎ ⁎⁎ ⁎ ⁎ 1.5 1.0 0.5 0.0 (a) Serum Cav-1/GAPDH GAPDH Cav-1 0 5 10 20 LPC (𝜇M) LPC (𝜇M) 0 NP PE 5 10 20 25 50 𝛽-Actin 37 PE NP Cav-1/ 𝛽 -actin ⁎ ⁎ ⁎ 10 8 6 4 2 0 4 3 2 1 0 (b) ox-LDL (𝜇g/mL) Cav-1 surface/input Surface: Cav-1 Input: Cav-1 ox-LDL (𝜇g/mL) 25 0 100 0 100 25 ⁎ 2.0 1.5 1.0 0.5 0.0 (c) IP: Cav-1 IB: KCa3.1 NP PE Input: KCa3.1 Serum 50 50 (d) KCa2.3 GAPDH + PE serum LPC (10 𝜇M) 75 37 M𝛽CD (1 mM) KCa 2.3/GAPD H PE serum LPC (10 𝜇M) KCa 2.3/GAPD H M𝛽CD M𝛽CD – – + + – + – ⁎⁎ ⁎⁎ 3 2 1 0 3 2 1 0 (e) KCa3.1 GAPDH PE serum 50 37 LPC (10 𝜇M) M𝛽CD (1 mM) KCa 3.1/GAPDH PE serum LPC (10 𝜇M) KCa 3.1/GAPDH M𝛽CD M𝛽CD + – – + + – – + ⁎⁎ ⁎ 3 2 1 0 3 2 1 0 (f)
Figure 2: Cav-1 is necessary for KCa2.3 and KCa3.1 internalization from the PM. (a) Cav-1 levels were reduced in ECs treated with NP serum,
which were reversed by VEGFR inhibition using anti-VEGFR1 and anti-VEGFR2 Abs. (b) Cav-1 levels in ECs treated with NP serum or PE serum, and in ECs treated with LPC. LPC enhanced Cav-1 levels in ECs in a concentration-dependent manner. (c) PM localization of Cav-1
was increased by oxidized LDL. (d) Coimmunoprecipitation showing the interaction between Cav-1 and KCa3.1 in ECs treated with NP or PE
serum. Input is lysate without primary Ab. (e, f) Treatment with the Cav-1 inhibitor MβCD (1 mM) recovered KCa2.3 (e) or KCa3.1 (f) levels
in ECs treated with PE serum or LPC. Blots shown are representative of three to six experiments performed with three to six different cultures.
LPC increased Rab5c and EEA1 levels in a concentration-dependent manner (Figure 4(d)). We examined whether Rab5c is involved in the regulation of the levels of KCa3.1 using coimmunoprecipitation. LPC enhanced colocalization of Rab5c with KCa3.1 (Figure 4(e)). We then examined the
effect of EEA1 inhibition on LPC-induced downregulation of KCa2.3 or KCa3.1 by using siRNA against EEA1. KCa2.3
(Figure 4(f)) and KCa3.1 (Figure 4(g)) levels, which were
reduced by PE serum or LPC, recovered upon EEA1 inhibi-tion. These results suggest that Rab5c and EEA1 are involved in KCa2.3 or KCa3.1 downregulation in PE.
3.4. A Redox State Regulates Membrane Levels of KCa2.3 and
KCa3.1 during Pregnancy. Previously, we showed that catalase
and GPX downregulation increased H2O2 levels, thereby
upregulating KCa2.3 and KCa3.1 in NP [10]. In addition,
KCa3.1 levels were elevated in mouse aortic endothelial cells (MAECs) from catalase/GPX1 double knockout (catalase-/-/GPX1-/-) mice [11]. Thus, we examined whether catalase and GPX1 knockdown affects PM levels of KCa2.3
or KCa3.1 using wild-type and catalase
-/-/GPX1-/- mice.
PM-localized KCa2.3 or KCa3.1 levels were markedly increased in catalase-/-/GPX1-/-MAECs, compared to wild-type MAECs (Figure 5(a)). We then compared Cav-1 or cla-thrin levels in wild-type and catalase-/-/GPX1-/-MAECs. In catalase-/-/GPX1-/-MAECs, levels of Cav-1 (Figure 5(b)) or clathrin (Figure 5(c)) were markedly reduced, and KCa2.3
levels were elevated (Figure 5(c)). Thus, inverse relation between KCa2.3 and clathrin levels was found. The increase
in KCa2.3 levels seen in these cells was reversed by treatment
with polyethylene glycol- (PEG-) catalase (Figure 5(d)). Furthermore, a H2O2 donor TBHP reduced clathrin (Figure 5(e)) and Rab5c (Figure 5(f)) levels in a concentration-dependent manner. These results suggest that catalase and GPX1 downregulation slows down the internal-ization and trafficking of KCa2.3 and KCa3.1 from PM via
H2O2-mediated pathways.
We then compared KCa3.1 currents in MAECs isolated
from wild-type and catalase-/-/GPX1-/- mice. Figure 5(g) shows KCa3.1 currents activated by loading cells with 1μM
Ca2+in the patch pipette (A) and the current-intracellular Ca2+ concentration ([Ca2+]i) relationship at +50 mV (B).
Serum GAPDH NP NNP Clathrin 150 37 Clathrin/GAPDH NNP NP NS 1.5 1.0 0.5 0.0 (a) PE NP Serum GAPDH Clathrin 150 37 NP PE Clathrin/GAPDH ⁎ 3 2 1 0 (b) Surface: clathrin Input: clathrin Clathrin surface/input NP PE 150 37 Serum PE NP ⁎ 5 4 3 2 1 0 (c) Input: KCa3.1 50 50 IP: clathrin IB: KCa3.1 LPC (𝜇M) Serum PE NP 0 10 50 50 Input: KCa3.1 IP: clathrin IB: KCa3.1 (d) KCa2.3 GAPDH + PE serum LPC (10 𝜇M) KCa 2.3/GAPDH 75 37 PE serum LPC (10 𝜇M) CPZ (2 𝜇M) KCa 2.3/GAPDH CPZ CPZ – + – – + + – ⁎⁎ ⁎⁎ 3 2 1 0 3 2 1 0 (e) KCa3.1 GAPDH PE serum LPC (10 𝜇M) 50 37 CPZ (2 𝜇M) KCa 3.1/GAPDH PE serum LPC (10 𝜇M) KCa 3.1/GAPDH CPZ CPZ + – – + + – – + ⁎⁎ ⁎ 4 3 2 0 1 4 3 2 0 1 (f)
Figure 3: Role of clathrin in the K+channel degradation. (a) Clathrin levels in ECs treated with NNP or NP serum. Alteration in clathrin
levels was not found between ECs treated with NNP or NP serum. (b) Clathrin levels in ECs treated with NP or PE serum. (c) Membrane
clathrin levels in ECs treated with NP or PE serum. (d) Colocalization of clathrin and KCa3.1 was enhanced by PE serum or LPC. (e, f)
Treatment with the clathrin inhibitor CPZ (2μM) recovered KCa2.3 (e) or KCa3.1 (f) levels in the ECs treated with PE serum or LPC. Blots
shown are representative of three to six experiments performed with three to six different cultures. Bar graphs represent the mean ± SEM.
37 GAPDH Serum NNP NP EEA1 150 EEA1/GAPDH NNP NP 1.5 1.0 0.5 0.0 (a) 37 Rab5c GAPDH 25 Serum NNP NP Rab5c/GAPDH NNP NP 1.5 1.0 0.5 0.0 (b) Rab5c 𝛽-Actin PE EEA1 𝛽-Actin NP 𝛽-Actin KCa3.1 100 25 10
% of serum to whole volume
PE NP NP PE 𝛽-Actin KCa3.1 𝛽-Actin KCa3.1 EEA1 𝛽-Actin EEA1 𝛽-Actin Rab5c 𝛽-Actin Rab5c 𝛽-Actin
Serum Serum Serum
(c) 0 3 10 30 0 3 10 30 0 3 10 30 𝛽-Actin Rab5c EEA1 Rab5c/ 𝛽 -Actin EEA1/ 𝛽 -Actin LPC (𝜇M) LPC (𝜇M) 50 150 25 ⁎⁎ ⁎⁎ ⁎⁎ ⁎ ⁎⁎ 4 3 2 1 0 4 5 3 2 1 0 (d) Input: KCa3.1 IP: Rab5c IB: KCa3.1 LPC (𝜇M) 50 50 0 10 (e) KCa2.3 GAPDH 75 37 + PE serum LPC (10 𝜇M) EEA1 KD Scramble KCa 2.3/GAPDH KCa 2.3/GAPDH + – + – + – + – EEA1 KD Scramble PE serum LPC (10 𝜇M) – + + – – + – ⁎⁎ ⁎ 3 2.0 1.5 1.0 0.5 0.0 2 1 0 (f) KCa3.1 GAPDH PE serum LPC (10 𝜇M) 50 37 EEA1 KD Scramble KCa 3.1/GAPDH KCa 3.1/GAPDH EEA1 KD Scramble PE serum LPC (10 𝜇M) + – + +– – + – + – + +– – + – ⁎⁎ ⁎⁎ 4 3 2 1 0 3 2 1 0 (g)
Figure 4: Rab5c- and EEA1-dependent transportation of KCa2.3 and KCa3.1 proteins. (a, b) Levels of EEA1 (a) or Rab5c (b) in ECs treated
with NNP or NP serum. (c) PE serum reduced KCa3.1 levels and enhanced Rab5c and EEA1 levels. (d) LPC increased EEA1 and Rab5c levels
in a concentration-dependent manner. (e) Coimmunoprecipitation showing the interaction between Rab5c and KCa3.1 in ECs treated with
LPC. Input is lysate without primary Ab. (f, g) Treatment with siRNA against EEA1 recovered KCa2.3 (f) or KCa3.1 (g) levels in ECs
treated with PE serum or LPC. Blots shown are representative of three to four experiments performed with three to four different cultures.
The current densities were found to be dependent on [Ca2+]i. At 0.2, 0.5, 1, 1.5, and 2μM [Ca2+]i, the current densities were 1:76 ± 0:21, 3:20 ± 1:06, 23:81 ± 3:96, 38:15 ± 7:46, and 41:10 ± 5:38 pA/pF in wild-type MAECs (n = 8), respectively,
and 2:39 ± 1:37, 6:42 ± 1:93, 39:33 ± 4:40, 63:72 ± 7:89, and 67:52 ± 6:73 pA/pF in catalase-/-/GPX1-/- MAECs (n = 8),
respectively, suggesting that KCa3.1 currents were
signifi-cantly enhanced in catalase-/-/GPX1-/- MAECs, compared
Surface: KCa3.1 Input: KCa3.1 MAECs Catalase/GPX1 50 50 Surface: KCa2.3 Input: KCa2.3 75 75 +/+ –/– (a) +/+ GAPDH Cav-1 MAECs Cav-1/GAPDH 25 37 –/– Catalase/GPX1 Catalase/GPX1 +/+–/– ⁎⁎ 1.5 1.0 0.5 0.0 (b) GAPDH KCa2.3 Clathrin MAECs Clathrin/GAPDH KCa 2.3/GAPDH 75 150 37 Catalase/GPX1 Catalase/GPX1 +/+ –/– +/+–/– +/+–/– ⁎ ⁎ 1.5 1.0 0.5 3 2 1 0.0 0 (c) PEG-catalase Catalase/GPX1 MAECs KCa 2.3/GAPDH Catalase/GPX1 (–/–) PEG-catalase GAPDH KCa2.3 75 37 +/+ + –/– ––/– + – – ⁎⁎ 1.5 1.0 0.5 0.0 (d) 0 10 25 25 37 Clathrin GAPDH TBHP (𝜇M) 150 Clathrin/GAPDH 0 10 25 50 TBHP (𝜇M) ⁎⁎ ⁎⁎ ⁎⁎ 1.5 1.0 0.5 0.0 (e) 0 10 Rab5c GAPDH 25 37 0 10 20 TBHP (𝜇M) 20 TBHP (𝜇M) Rab5c/GAPDH ⁎⁎ ⁎ 1.5 1.0 0.5 0.0 (f) 1 𝜇M Ca2+ 0.2 0.5 1 2 80 60 40 20 0 50 40 30 20 10 0
–50 0 50 Current density (pA/pF)
pA/pF Catalase/GPX1 (A) (B) Catalase/GPX1 VM (mV) +/+ –/– +/+ –/– Free [Ca2+] (𝜇M) (g)
Figure 5: Catalase and GPX1 knockdown slows down KCa2.3 or KCa3.1 endocytosis. (a) PM levels of KCa2.3 or KCa3.1 in MAECs from
wild-type and catalase-/-/GPX1-/-mice. (b) Cav-1 levels in MAECs from wild-type and catalase-/-/GPX1-/-mice. (c) KCa2.3 and clathrin
levels in MAECs from wild-type and catalase-/-/GPX1-/-mice. (d) Elevated KCa2.3 levels by catalase/GPX1 knockdown were reversed by
a membrane permeable catalase, PEG-catalase. (e, f) A H2O2donor TBHP reduced clathrin (e) or Rab5c (f) levels in a
concentration-dependent manner. (g) KCa3.1 currents activated by loading cells with 1μM Ca2+(A) and the current-[Ca2+]irelationship at +50 mV (B). The
current densities at +50 mV are plotted against [Ca2+]i. Blots shown are representative of three to four experiments performed with three to
to wild-type MAECs. However, no significant difference was found in EC50 between wild-type and catalase-/-/GPX1
-/-MAECs (948 ± 37 nM [Ca2+]i and 934 ± 42 nM [Ca2+]i,
respectively). This implies KCa3.1 upregulation enhances KCa3.1 currents in catalase-/-/GPX1-/-MAECs.
On the other hand, we had previously reported that NADPH oxidase 2 (NOX2) and NOX4 upregulation and SOD downregulation enhance superoxide levels, thereby downregulating KCa2.3 and KCa3.1 in PE [10, 19]. We thus
examined whether superoxide facilitates the internalization and transportation processes of KCa2.3 and KCa3.1 in PE.
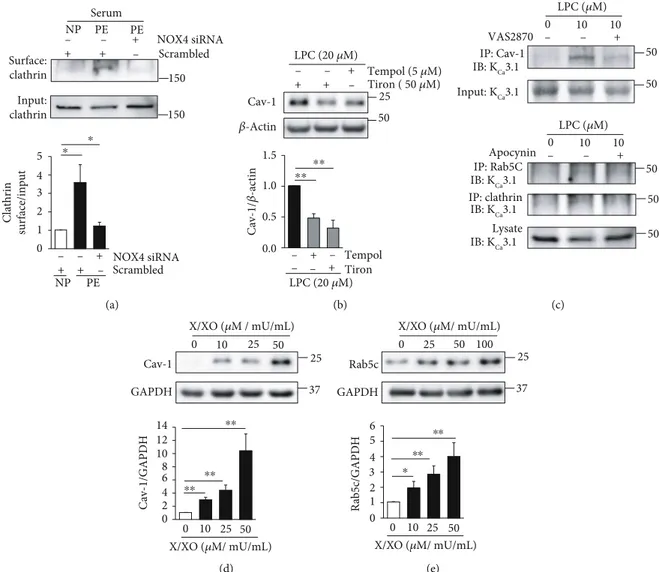
Compared to cells treated with NP serum, PM-localized cla-thrin levels were markedly elevated in ECs treated with PE serum, and the elevation was reversed by the treatment with NOX4 siRNA (Figure 6(a)). LPC elevated Cav-1 levels, and the elevation was reversed by the treatment with the antioxidants, tempol or tiron (Figure 6(b)). LPC increased colocalization of KCa3.1 with Cav-1, clathrin, or Rab5c,
which was inhibited by a pan-NOX inhibitor VAS2870 or apocynin (Figure 6(c)). Furthermore, a superoxide donor X/XO increased Cav-1 (Figure 6(d)) or Rab5c (Figure 6(e)) levels in ECs in a concentration-dependent manner. These results suggest that the internalization and transportation processes of KCa2.3 and KCa3.1 facili-tated by superoxide contribute to the downregulation of KCa2.3 and KCa3.1 in PE.
4. Discussion
In this study, we observed for thefirst time that PM-localized KCa2.3 and KCa3.1 are internalized via caveola- or
clathrin-dependent processes and transported via a Rab5c- and EEA1-dependent process in ECs (Figure 7). Compared to NNP, the internalization and transport processes are delayed in NP, thus elevating PM-localized KCa2.3 and KCa3.1 levels.
However, compared to NP, the internalization and transport
150 + + NOX4 siRNA + Scrambled 150 Surface: clathrin Input: clathrin Clathrin surface/input NP PE PE Serum Scrambled NOX4 siRNA NP PE – – – + + + – – – ⁎ ⁎ 5 4 3 2 1 0 (a) 25 Tempol (5 𝜇M) Tiron ( 50 𝜇M) 𝛽-Actin Cav-1 Cav-1/ 𝛽 -actin LPC (20 𝜇M) LPC (20 𝜇M) 50 + + + – – – Tempol Tiron + + – – – – ⁎⁎ ⁎⁎ 1.5 1.0 0.5 0.0 (b) IP: Cav-1 IB: KCa3.1 Input: KCa3.1 LPC (𝜇M) 0 10 10 VAS2870 Apocynin IP: clathrin IP: Rab5C IB: KCa3.1 Lysate IB: KCa3.1 IB: KCa3.1 LPC (𝜇M) + – – 0 10 10 + – – 50 50 50 50 50 (c) 25 50 37 Cav-1 GAPDH 25 0 10 X/XO (𝜇M / mU/mL) Cav-1/GAPDH 0 10 25 50 X/XO (𝜇M/ mU/mL) ⁎⁎ ⁎⁎ ⁎⁎ 14 12 10 8 6 4 2 0 (d) 0 10 25 50 50 100 37 Rab5c GAPDH 25 0 25 X/XO (𝜇M/ mU/mL) X/XO (𝜇M/ mU/mL) R ab5c/GAPD H ⁎⁎ ⁎⁎ ⁎ 6 5 4 3 2 1 0 (e)
Figure 6: Superoxide facilitates KCa2.3 or KCa3.1 endocytosis. (a) Elevated PM clathrin levels by PE serum were reduced by NOX4 inhibition
using NOX4 siRNA. (b) Elevated Cav-1 levels by LPC were reduced by the antioxidants, tempol or tiron. (c) Elevated colocalization of KCa3.1
with Cav-1, clathrin, or Rab5c by LPC was reversed by the treatment with a pan-NOX inhibitor, VAS2870, or apocynin. (d, e) A superoxide donor, X/XO, elevated Cav-1 (d) or Rab5c (e) levels in a concentration-dependent manner. Blots shown are representative of three to four
processes are facilitated in PE, thus reducing PM-localized KCa2.3 and KCa3.1 levels. Soluble factors in PE serum, such
as oxidized LDL, might induce internalization of K+channel proteins from the PM via clathrin- or caveola-dependent processes and thereby attenuate the pregnancy-associated KCa2.3 and KCa3.1 upregulation. Since endothelial KCa2.3
and KCa3.1 play important roles in the control of vascular
contractility, altered levels of these K+ channels might explain the hemodynamic changes seen during the progress of pregnancy, both NP and PE.
KCa2.3 was internalized from PM via a caveola- or clathrin-dependent process. The involvement of caveolae in the internalization of KCa2.3 is consistent with the finding
that KCa2.3 is observed in caveolae, Cav-1-rich membrane
fractions [20], and that the endocytosis of KCa2.3 from the
cell membrane is dependent upon both Cav-1 and dynamin II [21]. In addition, we showed that clathrin is involved in KCa2.3 internalization. Internalized KCa2.3 might be
trans-ported via a EEA1- and Rab5-dependent process, since LPC-induced reduced KCa2.3 levels were reversed by siRNA against EEA1 (Figure 4(f)). Similarly, Gao et al. demon-strated the involvement of Rab5-containing endosome in the endocytosis of KCa2.3 from PM [21]. These
mecha-nisms involved in KCa2.3 internalization and transporta-tion were similar to those for KCa3.1 internalization and
transportation.
Previously, we demonstrated that PM KCa3.1 proteins are
internalized via a clathrin-dependent process and trans-ported in a Rab5c- and EEA1-dependent process in Fabry disease [12]. In addition, we demonstrated that caveolae are involved in KCa3.1 internalization from cell membrane,
although endothelial KCa3.1 is suggested to be present in noncaveolar membrane fractions [20, 22]. However, KCa3.1, which is not associated with Cav-1 under baseline conditions, was found to colocalize with Cav-1 during shear stress condi-tions [23]. In addition, PE serum induced colocalization of KCa3.1 with Cav-1 (Figure 2(d)). Thus, stimulation by serum
components or shear stress might lead to colocalization of KCa3.1 and Cav-1. In addition, clathrin-dependent
internali-zation followed by Rab5c- and EEA1-dependent transporta-tion was found to regulate membrane KCa3.1 levels during
pregnancy.
Altered redox state might be involved in the regulation of internalization and transportation of KCa2.3 and KCa3.1 in NP and PE. We previously showed that H2O2levels are
ele-vated via downregulation of catalase and GPX1 during NP
Caveolar-or clathrin-dependent internalizaion of KCa channel proteins
Degradation of KCa channel proteins
Clathrin Caveolin-1
A EEA1 and Rab5c-dependent transportation of KCa channel proteins to early endosome
KCa channel proteins
(a)
K+
Normal non-pregnancy (NNP) Normal pregnancy (NP) Preeclampsia (PE) Delayed by H2O2 in NP,
compared to NNP
Facilitated by superoxide in PE,
compared to NP These degradation processes are
(b)
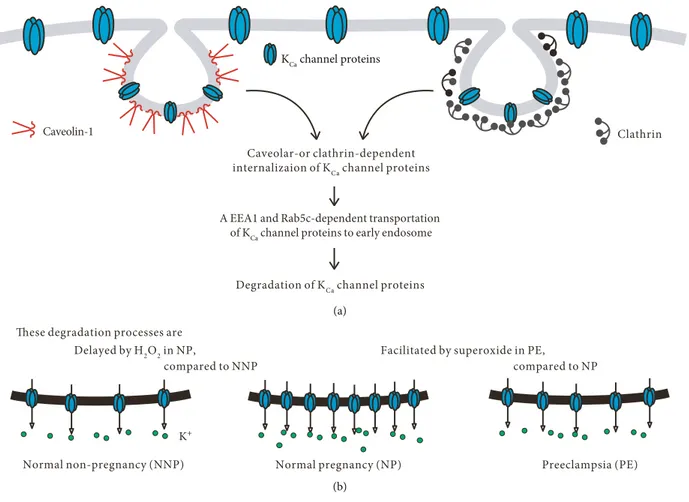
Figure 7: A schematic model for altered redox state-induced modulation of PM-localized KCa2.3 and KCa3.1 in NP and PE. (a) PM-localized
KCa2.3 and KCa3.1 are internalized via caveola- or clathrin-dependent processes and transported via a Rab5c- and EEA1-dependent process to
early endosome. (b) Compared to NNP, the internalization and transport processes are delayed by H2O2in NP, thus elevating PM-localized
KCa2.3 and KCa3.1 levels. However, compared to NP, the internalization and transport processes are facilitated in PE, thus reducing
[10]. Catalase and GPX1 knockdown elevated KCa2.3 and
KCa3.1 levels in PM (Figure 5(a)) and reduced Cav-1 and
clathrin levels (Figures 5(b) and 5(c)), suggesting that H2O2
elevates PM levels of KCa2.3 and KCa3.1 by slowing down
the internalization process of the K+channel proteins from PM. In addition, reduction in Rab5c levels by the H2O2 donor TBHP suggests that H2O2slows down the transporta-tion process of the internalized KCa2.3 and KCa3.1. Thus, reduced degradation of KCa2.3 and KCa3.1 might contribute
to the upregulation of these K+ channel proteins during NP. In contrast, superoxide might facilitate the internaliza-tion and transportainternaliza-tion processes of KCa2.3 and KCa3.1 from
cell membrane. NOX2 and NOX4 upregulation and SOD downregulation enhanced superoxide levels, thereby down-regulating KCa2.3 and KCa3.1 in PE [10].
Reduction in Cav-1 levels by NP serum was reversed by anti-VEGFR Abs, suggesting that soluble serum factors, such as VEGF, might inhibit caveola-dependent internalization of KCa2.3 and KCa3.1 through VEGFR activation during NP.
Since serum levels of the soluble VEGF inhibitor, sFlt-1 are increased in PE, VEGFR activation might be suppressed dur-ing PE. Inhibition of VEGFR activation might contribute to the increase in Cav-1 levels by PE serum. In addition, cell membrane localization of Cav-1 and clathrin was enhanced by the treatment with oxidized LDL or LPC, and LPC increased colocalization of clathrin with KCa3.1. Thus, VEGFR inhibition or oxidized LDL might facilitate internal-ization of KCa2.3 and KCa3.1, thereby reducing membrane
levels of these K+channels during PE.
Oxidative stress is increased during pregnancy (in both NP and PE) [24–26]. ROS reduces NO bioavailability by interacting directly with NO [27–29], suggesting that NO-induced vasorelaxation might be impaired during pregnancy. Since KCa2.3 and KCa3.1 activation induces NO-independent
vasorelaxation by evoking hyperpolarization of VSMCs, KCa2.3 and KCa3.1 upregulation may compensate for decreased NO signaling, as shown in vascular aging [11]. KCa2.3 and KCa3.1 upregulation in NP suggests that a similar
compensation occurs in NP [10]. In contrast, ROS and super-oxide production has been suggested to be more in PE than in NP, and superoxide decreased levels of endothelial NO synthases [30]. These results suggest that the impairment of NO-induced vasorelaxation might be greater in PE than in NP. In addition to the impaired NO-induced vasorelax-ation, reduced KCa2.3 and KCa3.1 upregulation suggests that NO-independent, endothelium-dependent relaxation is also impaired in PE [10].
The presentfindings suggest that PM-localized KCa2.3
and KCa3.1 levels are regulated by similar internalization
and transportation processes, and the regulation of the pro-cesses is affected by an altered redox state during NP and PE. We identified Cav-1, clathrin, Rab5c, and EEA1 as critical components in the regulation of PM-localized KCa2.3 and
KCa3.1 levels during pregnancy. Inhibiting Cav-1, clathrin,
or EEA1 using siRNAs against these components led to the recovery of PM-localized KCa2.3 and KCa3.1 levels, suggesting that siRNAs against these components can be used to treat endothelial dysfunction. To the best of our knowledge, this is the first study to reveal the mechanisms
underly-ing the regulation of membrane KCa2.3 and KCa3.1 levels
during pregnancy.
Abbreviations
Ab: Antibody Cav-1: Caveolin-1 CM: Culture medium CPZ: ChlorpromazineEC: Endothelial cell
EEA1: Early endosome antigen-1 HUtMEC: Human uterine microvascular EC LDL: Low-density lipoprotein
LOX: Lectin-like oxidized LDL receptor LPC: Lysophosphatidylcholine
MAECs: Mouse aortic endothelial cells MβCD: Methyl-β-cyclodextrin NNP: Normal nonpregnancy
NO: Nitric oxide
NOX: NADPH oxidase
NP: Normal pregnancy
PE: Preeclampsia
PM: Plasma membrane
sFlt-1: Soluble fms-like tyrosine kinase-1 VEGF: Vascular endothelial growth factor VEGFR: VEGF receptor.
Data Availability
The data used to support thefindings of this study are avail-able from the corresponding author upon request.
Conflicts of Interest
No conflicts of interest, financial, or otherwise are declared by the authors.
Acknowledgments
This work was supported by the National Research Founda-tion of Korea (NRF) grant funded by the Korea government (MSIT) (2018R1A2B3003815), intramural research promo-tion grants from Ewha Womans University, School of Medicine, and RP-grant 2018 of Ewha Womans University.
References
[1] K. Goto, T. Ohtsubo, and T. Kitazono,
“Endothelium-dependent hyperpolarization (EDH) in hypertension: the
role of endothelial ion channels,” International Journal of
Molecular Sciences, vol. 19, no. 1, p. 315, 2018.
[2] K. M. Gauthier, W. B. Campbell, and A. J. McNeish,
“Regula-tion of KCa2.3 and endothelium-dependent hyperpolarization
(EDH) in the rat middle cerebral artery: the role of lipoxygen-ase metabolites and isoprostanes,” PeerJ, vol. 2, article e414, 2014.
[3] M. Y. Kim, G. H. Liang, J. A. Kim, S. H. Park, J. S. Hah, and
S. H. Suh,“Contribution of Na+-K+pump and KIRcurrents
to extracellular pH-dependent changes of contractility in rat
Physiology-Heart and Circulatory Physiology, vol. 289, no. 2, pp. H792– H800, 2005.
[4] E. J. Behringer and S. S. Segal,“Membrane potential governs
calcium influx into microvascular endothelium: integral role
for muscarinic receptor activation,” The Journal of Physiology,
vol. 593, no. 20, pp. 4531–4548, 2015.
[5] J. Z. Sheng, S. Ella, M. J. Davis, M. A. Hill, and A. P. Braun,
“Openers of SKCaand IKCachannels enhance agonist-evoked
endothelial nitric oxide synthesis and arteriolar vasodilation,”
The FASEB Journal, vol. 23, no. 4, pp. 1138–1145, 2009.
[6] C. J. Garland and K. A. Dora,“EDH: endothelium-dependent
hyperpolarization and microvascular signalling,” Acta
Physio-logica, vol. 219, no. 1, pp. 152–161, 2017.
[7] H. Shimokawa, H. Yasutake, K. Fujii et al.,“The importance of
the hyperpolarizing mechanism increases as the vessel size decreases in endothelium-dependent relaxations in rat
mesen-teric circulation,” Journal of Cardiovascular Pharmacology,
vol. 28, no. 5, pp. 703–711, 1996.
[8] J. J. Hwa, L. Ghibaudi, P. Williams, and M. Chatterjee,
“Com-parison of acetylcholine-dependent relaxation in large and small arteries of rat mesenteric vascular bed,” The American
Journal of Physiology, vol. 266, no. 3, pp. H952–H958, 1994.
[9] T. Nagao, S. Illiano, and P. M. Vanhoutte, “Heterogeneous
distribution of endothelium-dependent relaxations resistant
to NG-nitro-L-arginine in rats,” The American Journal of
Physiology, vol. 263, no. 4, pp. H1090–H1094, 1992.
[10] S. Choi, J. A. Kim, H. Y. Li et al.,“Altered redox state
modu-lates endothelial KCa2.3 and KCa3.1 levels in normal pregnancy
and preeclampsia,” Antioxidants & Redox Signaling, vol. 30,
no. 4, pp. 505–519, 2019.
[11] S. Choi, J. A. Kim, H. Y. Li et al.,“KCa3.1 upregulation
pre-serves endothelium-dependent vasorelaxation during aging
and oxidative stress,” Aging Cell, vol. 15, no. 5, pp. 801–810,
2016.
[12] S. Choi, J. A. Kim, H. Y. Na et al.,“Globotriaosylceramide
induces lysosomal degradation of endothelial KCa3.1 in Fabry
disease,” Arteriosclerosis, Thrombosis, and Vascular Biology,
vol. 34, no. 1, pp. 81–89, 2014.
[13] S. Choi, H. Y. Na, J. A. Kim, S. E. Cho, and S. H. Suh,
“Contra-dictory effects of superoxide and hydrogen peroxide on KCa3.1
in human endothelial cells,” Korean Journal of Physiology &
Pharmacology, vol. 17, no. 3, pp. 181–187, 2013.
[14] S. Park, J. A. Kim, K. Y. Joo et al.,“Globotriaosylceramide leads
to K(Ca)3.1 channel dysfunction: a new insight into
endothe-lial dysfunction in Fabry disease,” Cardiovascular Research,
vol. 89, no. 2, pp. 290–299, 2011.
[15] R. M. Johnson, Y. S. Ho, D. Y. Yu, F. A. Kuypers,
Y. Ravindranath, and G. W. Goyette,“The effects of disruption
of genes for peroxiredoxin-2, glutathione peroxidase-1, and catalase on erythrocyte oxidative metabolism,” Free Radical
Biology & Medicine, vol. 48, no. 4, pp. 519–525, 2010.
[16] S. Choi, J. A. Kim, K. C. Kim, and S. H. Suh,“Isolation and
in vitro culture of vascular endothelial cells from mice,” Korean Journal of Physiology & Pharmacology, vol. 19, no. 1,
pp. 35–42, 2015.
[17] S. Christoforidis, H. M. McBride, R. D. Burgoyne, and
M. Zerial,“The Rab5 effector EEA1 is a core component of
endosome docking,” Nature, vol. 397, no. 6720, pp. 621–625,
1999.
[18] H. Stenmark, G. Vitale, O. Ullrich, and M. Zerial,“Rabaptin-5
is a direct effector of the small GTPase Rab5 in endocytic
membrane fusion,” Cell, vol. 83, no. 3, pp. 423–432, 1995.
[19] S. Choi, J. A. Kim, H. Y. Na et al.,“NADPH oxidase 2-derived
superoxide downregulates endothelial KCa3.1 in
preeclamp-sia,” Free Radical Biology and Medicine, vol. 57, pp. 10–21,
2013.
[20] M. Absi, M. P. Burnham, A. H. Weston, E. Harno, M. Rogers,
and G. Edwards,“Effects of methyl β-cyclodextrin on EDHF
responses in pig and rat arteries; association between SKCa
channels and caveolin-rich domains,” British Journal of
Phar-macology, vol. 151, no. 3, pp. 332–340, 2007.
[21] Y. Gao, C. A. Bertuccio, C. M. Balut, S. C. Watkins, and D. C.
Devor, “Dynamin- and Rab5-dependent endocytosis of a
Ca2+-activated K+channel, KCa2.3,” PLoS One, vol. 7, no. 8,
article e44150, 2012.
[22] P. Gluais, G. Edwards, A. H. Weston, J. R. Falck, P. M.
Vanhoutte, and M. Feletou,“Role of SK(Ca) and IK(Ca) in
endothelium-dependent hyperpolarizations of the guinea-pig
isolated carotid artery,” British Journal of Pharmacology,
vol. 144, no. 4, pp. 477–485, 2005.
[23] S. Goedicke-Fritz, A. Kaistha, M. Kacik et al., “Evidence
for functional and dynamic microcompartmentation of
Cav-1/TRPV4/KCain caveolae of endothelial cells,” European
Journal of Cell Biology, vol. 94, no. 7-9, pp. 391–400, 2015.
[24] M. T. Raijmakers, R. Dechend, and L. Poston,“Oxidative stress
and preeclampsia: rationale for antioxidant clinical trials,”
Hypertension, vol. 44, no. 4, pp. 374–380, 2004.
[25] O. G. Shaker and N. A. Sadik,“Pathogenesis of preeclampsia:
implications of apoptotic markers and oxidative stress,”
Human & Experimental Toxicology, vol. 32, no. 11,
pp. 1170–1178, 2013.
[26] I. A. Siddiqui, A. Jaleel, W. Tamimi, and H. M. F. Al Kadri, “Role of oxidative stress in the pathogenesis of preeclampsia,”
Archives of Gynecology and Obstetrics, vol. 282, no. 5, pp. 469–
474, 2010.
[27] Z. Ungvari, R. Buffenstein, S. N. Austad, A. Podlutsky,
G. Kaley, and A. Csiszar,“Oxidative stress in vascular
senes-cence: lessons from successfully aging species,” Frontiers in
Bioscience, vol. 13, pp. 5056–5070, 2008.
[28] A. J. Donato, I. Eskurza, A. E. Silver et al.,“Direct evidence of
endothelial oxidative stress with aging in humans: relation to impaired endothelium-dependent dilation and upregulation
of nuclear factor-κB,” Circulation Research, vol. 100, no. 11,
pp. 1659–1666, 2007.
[29] D. R. Seals, K. L. Jablonski, and A. J. Donato,“Aging and
vas-cular endothelial function in humans,” Clinical Science,
vol. 120, no. 9, pp. 357–375, 2011.
[30] S. Choi, S. Park, G. H. Liang, J. A. Kim, and S. H. Suh,
“Super-oxide generated by lysophosphatidylcholine induces endothe-lial nitric oxide synthase downregulation in human endotheendothe-lial
cells,” Cellular Physiology and Biochemistry, vol. 25, no. 2-3,
Stem Cells
International
Hindawi www.hindawi.com Volume 2018 Hindawi www.hindawi.com Volume 2018 INFLAMMATIONEndocrinology
International Journal of Hindawi www.hindawi.com Volume 2018 Hindawi www.hindawi.com Volume 2018Disease Markers
Hindawi www.hindawi.com Volume 2018 BioMed Research InternationalOncology
Journal of Hindawi www.hindawi.com Volume 2013 Hindawi www.hindawi.com Volume 2018Oxidative Medicine and Cellular Longevity
Hindawi
www.hindawi.com Volume 2018
PPAR Research
Hindawi Publishing Corporation
http://www.hindawi.com Volume 2013 Hindawi www.hindawi.com
The Scientific
World Journal
Volume 2018 Immunology Research Hindawi www.hindawi.com Volume 2018 Journal ofObesity
Journal of Hindawi www.hindawi.com Volume 2018 Hindawi www.hindawi.com Volume 2018 Computational and Mathematical Methods in Medicine Hindawi www.hindawi.com Volume 2018Behavioural
Neurology
Ophthalmology
Journal of Hindawi www.hindawi.com Volume 2018Diabetes Research
Journal ofHindawi
www.hindawi.com Volume 2018
Hindawi
www.hindawi.com Volume 2018 Research and Treatment
AIDS
Hindawi
www.hindawi.com Volume 2018
Gastroenterology Research and Practice
Hindawi www.hindawi.com Volume 2018