Cerebral perfusion
changes during
cataplexy in
narcolepsy patients
Abstract—To localize cerebral perfusion differences during cataplexy, brain SPECT subtraction was performed between cataplexy and baseline awake period or REM sleep in patients with narcolepsy. During cataplexy, subtracted SPECT showed hyperperfusion in right amygdala, bilateral cingulate gyri, basal ganglia, thalami, premotor cortices, sensorimotor cortices, right insula, and brainstem, and hypoperfusion in prefrontal cortex and occipital lobe. This result suggests that cataplexy is produced by the activation of amygdalo-cortico-basal ganglia– brainstem circuit.
NEUROLOGY 2006;66:1747–1749
Seung Bong Hong, MD, PhD; Woo Suk Tae, MS; and Eun Yeon Joo, MD
Cataplexy is a sudden loss of muscle tone triggered by emotional changes such as laughing and is caused by the inappropriate activation of descending neural pathways that promote atonia.1Although these same REM sleep atonia pathways likely help mediate cat-aplexy, the mechanisms differ slightly. In contrast to neurons of the locus ceruleus that are silent during both REM sleep and cataplexy, neurons of the dorsal raphe are silent during REM sleep but retain some activity during cataplexy in narcoleptic dogs.2 The radiotracer for SPECT, 99mTc-ethylcysteinate dimer (ECD) has a high first-pass brain extraction rate, with maximum uptake being achieved within 30 to 60 seconds of an IV injection.3 They become trapped in the brain, thereby producing a “snapshot” of the ictal cerebral perfusion pattern that can be imaged up to 4 hours after radiotracer injection in patients with epilepsy.
To investigate cerebral perfusion changes during cataplexy, we injected 99mTc-ECD during a cataplec-tic episode, REM sleep, and a baseline awake period for a brain SPECT study in two patients with narcolepsy.
Methods. Subject 1 was a 64-year-old man with a 35-year his-tory of excessive daytime sleepiness (EDS) and daily episodes of cataplexy with head drooping and falling down. These episodes were triggered when he was sad or elated and lasted more than 3 minutes.
Subject 2 was a 25-year-old woman. Her EDS and cataplexy began at age 15 years. Her cataplectic episodes started with a sagging of the face and head drooping and lasted for up to 5 minutes. Frequently, she would slump onto the ground. Her cata-plectic attacks were triggered by talking to friends on the phone. She had vivid dreams and hypnagogic visual hallucinations. Both patients had overnight polysomnography and the Multiple Sleep Latency Test.
99mTc-ECD brain SPECT and cataplexy induction. Brain SPECT images were obtained 30 to 60 minutes after injecting of 25 mCi99mTc-ECD using a three-headed Triad XLT system
(Trio-nix Research Laboratory, Twinsburg, OH) equipped with low-energy, high-resolution collimators. The transaxial system resolution of this camera was 6.9 mm full width at half maximum. Images were reconstructed by filtered back-projection using a But-terworth filter. Attenuation correction was performed using Chang’s method (attenuation coefficient ⫽ 0.12 cm⫺1). The voxel dimension of reconstructed SPECT was 3.56⫻ 3.56 ⫻ 3.56 mm (x, y, z, respectively).
99mTc-ECD for brain SPECT was injected during the baseline
awake period, a cataplectic episode, and REM sleep in Subject 1 and during the baseline awake period and a cataplectic attack in Subject 2. During the SPECT studies, patients were continuously monitored using EEG, electro-oculography, and EMG.
SPECT subtraction. SPECT subtraction was performed on an offline workstation using ANALYZE 7.5 (Biomedical Imaging Re-source, Mayo Foundation, Rochester, MN). All biomedical images were transferred from scanner consoles to a Unix workstation using a digital audiotape device. The SPECT subtraction proce-dures were described in a previous study.4,5
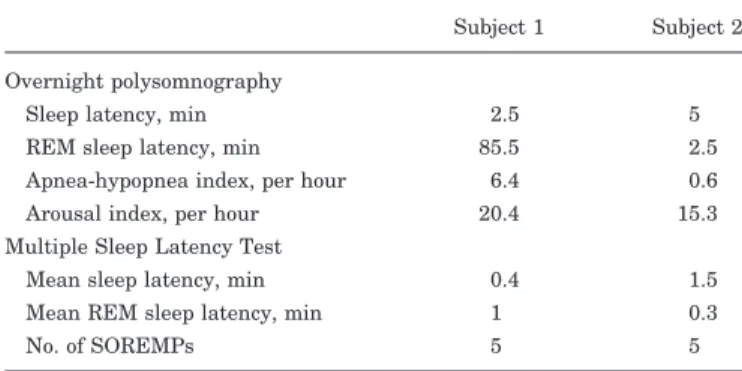
Results. The results of sleep studies are summarized in table 1. Both patients had a very short sleep latency and five sleep-onset REM periods. Subject 1 had mild obstruc-tive apnea-hypopnea syndrome. He had worn a nasal con-tinuous positive airway pressure mask for more than 6 months, but his EDS did not decrease. Subject 2 showed only frequent arousals with no other problems during over-night polysomnography.
Subject 1 experienced a cataplectic episode using a sad story. Subject 2 was able to induce cataplexy by talking and laughing with a friend on the phone. During these episodes, both subjects presented with complete muscle atonia of the limbs, head, and trunk extensor muscles and loss of speech. Tendon reflexes were absent. EEG record-ings showed alpha rhythm persistence on posterior head regions and submental EMG-documented hypotonia. They recovered from their cataplexies 5 minutes (Subject 1) and 3 minutes (Subject 2) after onset.
Subtracted SPECT. Hyperperfusion during cataplexy vs the awake period was observed in bilateral cingulate gyri and sensorimotor cortices, basal ganglia, right amyg-dale, and hippocampal head, thalami, midbrain, and mid-line pons (table 2; figure, A), whereas hypoperfusion was
Additional material related to this article can be found on the Neurology Web site. Go to www.neurology.org and scroll down the Table of Con-tents for the June 13 issue to find the title link for this article.
From the Department of Neurology (W.S.T., S.B.H.), Samsung Medical Center, Sungkyunkwan University School of Medicine, Seoul, Korea; and Department of Neurology (E.Y.J.), College of Medicine, Ewha Womans University, Seoul, Korea.
Supported by grant A050462 from the Good Health R&D Project, Ministry of Health & Welfare, Republic of Korea.
Disclosure: The authors report no conflicts of interest.
Received December 1, 2005. Accepted in final form February 20, 2006. Address correspondence and reprint requests to Dr. Seung Bong Hong, Department of Neurology, Samsung Medical Center, Sungkyunkwan Uni-versity School of Medicine, 50 Irwon-dong, Gangnam-gu, Seoul 135-710, Korea; e-mail: sbhong@smc.samsung.co.kr
detected in the bilateral prefrontal cortices and occipital lobes (figure, C).
Hyperperfusion during cataplexy vs REM sleep was observed in bilateral cingulate gyri, sensorimotor corti-ces, basal ganglia, thalami, right amygdala/hippocam-pus, midbrain, and pons (figure, B), whereas hyperperfusion during REM sleep compared to during cataplexy was detected in bilateral prefrontal cortices, right inferior parietal cortex, left mid-posterior parietal cortex, left mid-posterior basal temporal regions, and bilateral occipital lobes (figure, C).
Discussion. Neurons of the amygdala are
fre-quently active when individuals show strong emo-tions, and stimulation of the amygdala can increase REM sleep, perhaps via its projections to the laterodorsal, pedunculopontine tegmental nu-clei, and nearby regions.6In recordings from narco-leptic dogs, amygdala neurons often fire just before and during a cataplectic episode,7 suggesting that they may help trigger the response. These observa-tions support hyperperfusion of the right amygdala in our patients. Human REM sleep shows the pre-dominant right hemisphere activation by SPECT imaging8and spectral EEG analysis.9 Right amyg-dala activation in our patients suggests that the right hemisphere is also more activated during cat-aplexy. An fMRI study showed that the right amygdala was more activated by laughing or cry-ing stimuli.10
The cingulate gyrus is related to emotional pro-cesses. An fMRI study showed that emotional pic-tures result in increased blood flow in the anterior cingulate gyri, dorsolateral frontal lobes, and amyg-dala/anterior temporal regions.11Our results suggest that the overactivation of the amygdala and cingu-late gyrus in response to emotional changes may trigger a cataplectic pathway.
A previous SPECT study showed significant hypo-perfusion in bilateral premotor cortices, cingulate gyri, and sensorimotor cortices in the baseline state of patients with narcolepsy with cataplexy,12; how-ever, we found hyperperfusion during a cataplectic episode. These observations suggest that cataplexy may be related to increased neuronal discharges in
specific brain regions involved in the baseline state of patients with narcolepsy.
Our study demonstrated basal ganglia hyperper-fusion during a cataplectic episode. Postsynaptic D2-receptor binding was elevated in narcolepsy and correlated with the frequency of cataplectic attacks.13 In narcoleptic dogs, local perfusion with D2-receptor agonists into the globus pallidus/putamen produced an increase in cataplexy in narcoleptic canines,14 whereas oral administration of dopamine D2/D3 an-tagonist in canine narcolepsy significantly reduced cataplexy.15
We also found hyperperfusion in the midbrain and pons during a cataplectic episode. Canine experi-ments have identified several monoamine receptor subtypes that are involved in the regulation of cata-plexy, namely, adrenergic postsynaptic a-1b,16 pre-synaptic a-2,17 and dopaminergic D2/D3 receptors.18 Furthermore, the acting sites of D2/D3 compounds have also been identified recently; D2/D3 agonists perfused into the ventral tegmental area, substantia nigra, and diencephalic dopamine cell groups, such as A11, significantly aggravate cataplexy, whereas Table 1 The results of overnight polysomnography and Multiple
Sleep Latency Test
Subject 1 Subject 2 Overnight polysomnography
Sleep latency, min 2.5 5 REM sleep latency, min 85.5 2.5 Apnea-hypopnea index, per hour 6.4 0.6 Arousal index, per hour 20.4 15.3 Multiple Sleep Latency Test
Mean sleep latency, min 0.4 1.5 Mean REM sleep latency, min 1 0.3
No. of SOREMPs 5 5
SOREMPs⫽ sleep-onset REM periods.
Table 2 Brain regions with perfusion changes during a
cataplectic episode compared to awake state or REM sleep Hyperperfusion during cataplexy compared to awake period
Subject 1
Bilateral frontal lobes: cingulate gyri, medial frontal, premotor cortices
Bilateral basal ganglia, bilateral thalami (L⬎R) Right amygdala and hippocampal head Bilateral sensorimotor cortices Right insula cortex
Midline pons and bilateral midbrains Subject 2
Bilateral frontal lobes: cingulate gyri, premotor cortices Bilateral basal ganglia, right thalamus
Right amygdala
Right sensorimotor cortex Right insula cortex Pons, right midbrain
Hypoperfusion during cataplexy compared to awake period Subject 1
Bilateral prefrontal cortices Bilateral occipital cortices Subject 2
Bilateral prefrontal cortices Bilateral occipital cortices
Hyperperfusion during cataplexy compared to REM sleep Subject 1
Bilateral sensorimotor cortices Bilateral basal ganglia
Right amygdala and hippocampus Bilateral cingulate gyri
Thalamus Midbrain and pons
Hyperperfusion during REM sleep compared to cataplexy Subject 1
Bilateral occipital lobes
Left mid-posterior basal temporal cortex Left mid-inferior parietal cortex
Right inferior parietal and posterior temporal cortices
D2/D3 antagonists significantly reduce cataplexy.19,20 These data suggest that cataplexy is produced by an episodically overactive neuronal state of basal gan-glia and specific brainstem nuclei.
Although it is difficult to differentiate structures related to a strong emotion from those accompanying a cataplectic attack, sudden emotional changes may activate the right amygdala and cingulate gyri. Then these structures trigger the activation of a cataplec-tic pathway consisting of sensorimotor cortex, basal ganglia, and brainstem nuclei.
Cataplexy was suggested as an atavistic expres-sion of tonic immobility (TI) rather than REM sleep atonia.21 TI describes a response pattern character-ized by severe motor inhibition when an animal faces grave danger. Both TI and cataplexy make use of the brainstem regions responsible for REM sleep atonia as a final common pathway to induce the spinal inhi-bition of motor neurons,22,23 but cerebral perfusion changes during TI have not been studied.
References 11 through 23 may be found on the
Neurology Web site at www.neurology.org.
References
1. Shirmani PJ, Armstrong DM, Bruce G, et al. Relation of pontine choline acetyl transferase immunoreactive neurons with cells which increase discharge during REM sleep. Brain Res Bull 1987;18:447–455. 2. Wu MF, John J, Boehmer LN, et al. Activity of dorsal raphe cells across
the sleep-waking cycle and during cataplexy in narcoleptic dogs. J Physiol 2004;554:202–215.
3. O’Brien TJ, O’Connor MK, Mullan BP, et al. Subtraction ictal SPET co-registered to MRI in partial epilepsy: description and technical vali-dation of the method with phantom and patient studies. Nucl Med Commun 1998;19:31–45.
4. O’Brien TJ, So EL, Mullan BP, et al. Subtraction ictal SPECT co-registered to MRI improves clinical usefulness of SPECT in localizing the surgical seizure focus. Neurology 1998;50:445–454.
5. Joo EY, Lee EK, Tae WS, et al. Ictal hyperperfusion of brain structures related to ictal dystonic posturing in temporal lobe seizures. J Korean Neurol Assoc 2003;21:479–486.
6. Simon-Arceo K, Ramirez-Salado I, Calvo JM. Long-lasting enhance-ment of rapid eye moveenhance-ment sleep and pontogeniculooccipital waves by vasoactive intestinal peptide microinjection into the amygdala temporal lobe. Sleep 2003;26:259–264.
7. Gulyani S, Wu MF, Nienhuis R, et al. Cataplexy-related neurons in the amygdala of the narcoleptic dog. Neuroscience 2002;112:355–365. 8. Asenbaum S, Zeithofer J, Saletu B, et al. Technetium-99m-HMPAO
SPECT imaging of cerebral blood flow during REM sleep in narcolep-tics. J Nucl Med 1995;36:1150–1155.
9. Bolduc C, Daoust AM, Limoges E, Braun CM, Godbout R. Hemispheric lateralization of the EEG during wakefulness and REM sleep in young healthy adults. Brain Cogn 2003;53:193–196.
10. Sander K, Brechmann A, Scheich H. Audition of laughing and crying leads to right amygdala activation in a low-noise fMRI setting. Brain Res Brain Res Protoc 2003;11:81–91.
Figure. SPECT subtraction results. (A) Hyperperfusion in bilateral premotor cortices, cingulate gyri, sensorimotor cortices, basal ganglia, right amygdala/ hippocampus, right insula, both thal-ami, and brainstem during cataplectic episode compared to baseline awake pe-riod (brain SPECT during cataplexy⫺ brain SPECT during baseline awake period). (B) Hyperperfusion in sensori-motor cortices, cingulate gyri, basal ganglia, thalami, right amygdala/ hippocampus, midbrain, and pons during cataplexy compared to REM sleep (brain SPECT during cataplexy⫺ brain SPECT during REM sleep). (C, left two images) Hyperperfusion in pre-frontal cortices and occipital lobes dur-ing awake period compared to cataplexy (brain SPECT during awake period⫺ brain SPECT during cataplexy). (C, right two images) Hyperperfusion in left posterior basal temporal cortex and bi-lateral occipital lobes during REM sleep compared to cataplexy attack (brain SEPCT during REM sleep⫺ brain SPECT during cataplexy). Small arrowheads indicate brain structures described.
DOI 10.1212/01.wnl.0000218205.72668.ab
2006;66;1747-1749
Neurology
Seung Bong Hong, Woo Suk Tae and Eun Yeon Joo
Cerebral perfusion changes during cataplexy in narcolepsy patients
This information is current as of June 12, 2006
Services
Updated Information &
http://n.neurology.org/content/66/11/1747.full including high resolution figures, can be found at:
Supplementary Material
http://n.neurology.org/content/suppl/2006/06/08/66.11.1747.DC1 Supplementary material can be found at:
References
http://n.neurology.org/content/66/11/1747.full#ref-list-1
This article cites 10 articles, 2 of which you can access for free at:
Citations
http://n.neurology.org/content/66/11/1747.full##otherarticles This article has been cited by 2 HighWire-hosted articles:
Permissions & Licensing
http://www.neurology.org/about/about_the_journal#permissions its entirety can be found online at:
Information about reproducing this article in parts (figures,tables) or in
Reprints
http://n.neurology.org/subscribers/advertise
Information about ordering reprints can be found online:
Online ISSN: 1526-632X.
1951, it is now a weekly with 48 issues per year. Copyright . All rights reserved. Print ISSN: 0028-3878. ® is the official journal of the American Academy of Neurology. Published continuously since