PUBLIC HEALTH WEEKLY REPORT, PHWR
Vol.11 No.9
2018
CONTENTS
CONTENTS
0248
인체자원 데이터 품질관리 체계 연구0254
수인성 식품매개 바이러스 검사용 표준물질 소개0261
주요 감염병 통계 환자감시 : 전수감시, 표본감시 병원체감시 : 인플루엔자 및 호흡기바이러스 급성설사질환, 엔테로바이러스따라 데이터 품 질관리가 필수 적인 요 소 로 부각되고 있다. 한국인체자원은행사업은 2기까지(’08-’16) 인체자원 확보를 위한 국가 바이오뱅크 네트워크를 구축하고, 71만 명의 대규모 인체자원과
들어가는 말
최근 공 공데이터의 개방·공 유·활용 요구가 증가 함 에 연구논문, Research article인체자원 데이터 품질관리 체계 연구
A Study of data quality management in the National Biobank of Korea
Ji Byeonggon, Lee Sang-Hyeop, Jeon Jae-Pil
Division of Biobank for Health Sciences, Center for Genome Science, KNIH, KCDC
Background: Most biobanks put in manually biospecimen-related inventory data into the databases, which may introduce
errors in the database. The National Biobank of Korea (NBK) operates on the self-developed Human Biobank Information System (HuBIS) which stores and disseminates data of biological samples.
Methodology/Results: The HuBIS handles various biobank inventory data generated from a central biobank and 17
regional biobanks, which form the Korea Biobank Network (KBN). Here, we report the analysis of the data quality and database structure of the HuBIS with an aim to improve the database quality and reliability. The HuBIS database was analyzed for patterns of data errors in terms of 12 assessment areas, including uniqueness and column consistency according to the database quality certification-value (DQC-V) of the Korea Data Agency. The result of the analysis indicated that the error rates for uniqueness and column consistency were 0.17% and 3.3% respectively, showing 3.04% error rate of the total evaluation standard, which is similar to 3.2, the error rate of a Sigma level and the Silver class of the DQC-V standard. In addition, we analyzed the entity relationship diagram (ERD) of the database structure, and demonstrated that data quality can be efficiently increased by improving data normalization.
Conclusion: Based on the assessment of database quality, we will apply for a data quality certification of the Korea Data
Agency, and will implement the 5-year roadmap of data quality management of the HuBIS.
Keywords: Biobank, Data quality management, Database quality, Roadmap
질병관리본부 국립보건연구원 유전체센터 바이오뱅크과 지병곤, 이상협, 전재필* *교신저자 : [email protected], 043-719-6550
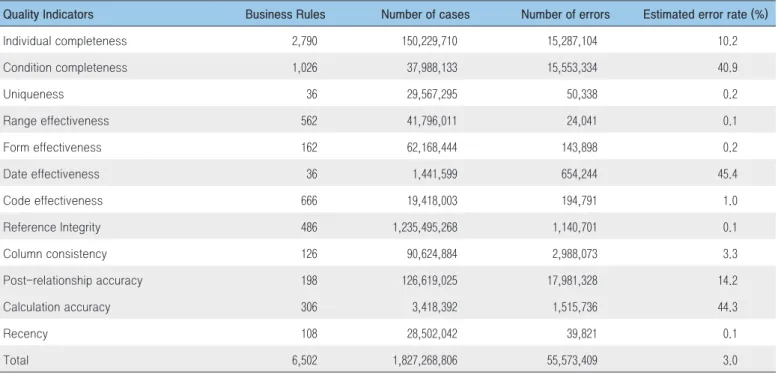
45.4% 및 계산/집계 정확성 44.3%로 일부 품질지표에서 높은 오류가 있는 것으로 추정되었다. 이에 대한 집중적인 검토와 관리가 필요할 것으로 보인다(Table 1). 품질지표 오류 추정률 을 바탕으 로 데이터 품질향상을 위해서는 다음과 같은 노력이 필요하다. 첫째, 현 데이터베이스 모델을 정제하여야 한다. 데이터의 오류사항을 확인한 결과 데이터들의 표준이 지켜지지 않고 있으며 이로 인해 발생하는 오류가 상당 부분을 차지하고 있다. 표준 데이터는 정보시스템의 데이터 품질 확보를 위한 필수 요소로 표준 데이터를 정의· 관리함으로써 데이터 간의 불일치와 데이터 오류를 방지하고 데이터에 대한 이해도를 높일 수 있다. 둘째, 메타데이터 관리를 통해 추후에 잘못된 데이터가 발생되지 않도록 하여야 한다. 데이터 모델에 대한 메타데이터를 관리함으로써 데이터 구조에 대한 최신 정보를 유지하고 전사 차원의 데이터 모델 공유 및 재사용을 극대화하며, 체계적인 데이터 모델의 변경 관리를 가 능하게 한다. 현재까지 나온 결과 를 모두 반영하 는 것을 시작으로 데이터 표준을 설정하고 메타데이터를 관리해야 한다.
데이터 모델 현황 분석
해당 정보를 확보 및 관리하고 있다. 이에 따라 한국인체자원은행 정보관리시스템에 누적된 대량의 데이터에 대한 신뢰성 확보를 위한 품질관리가 필수적인 요소로 부각되고 있으며, 인체자원 정보의 특성을 반영한 데이터 품질관리 체계모델을 수립하고 품질관리활동을 수행할 수 있는 가이드라인을 필요로 한다. 이번 글의 목표는 인체자원 데이터의 품질관리 기반 마련을 위하여 현행 데이터에 대한 품질 현황 분석 결과를 바탕으로 품질관리 전략 및 로드맵을 제시하고자 한다.몸 말
데이터 품질 현황 검토
인체자원 데이터 품질 현황 분석을 위해 한국데이터베이스 진흥원에서 제시한 데이터 품질관리 프레임워크 기반의 방법론을 사용하여 국립중앙인체자원은행 및 17개 단위은행을 대상으로 현황 분석을 실시하였다. 총 품질지표별 오류 추정률은 3.0%로 그렇게 높게 나타나지는 않았으나 조건완전성 40.9%, 날짜유효성Table 1. Error rates by quality indicator
Quality Indicators Business Rules Number of cases Number of errors Estimated error rate (%)
Individual completeness 2,790 150,229,710 15,287,104 10.2 Condition completeness 1,026 37,988,133 15,553,334 40.9 Uniqueness 36 29,567,295 50,338 0.2 Range effectiveness 562 41,796,011 24,041 0.1 Form effectiveness 162 62,168,444 143,898 0.2 Date effectiveness 36 1,441,599 654,244 45.4 Code effectiveness 666 19,418,003 194,791 1.0 Reference Integrity 486 1,235,495,268 1,140,701 0.1 Column consistency 126 90,624,884 2,988,073 3.3 Post-relationship accuracy 198 126,619,025 17,981,328 14.2 Calculation accuracy 306 3,418,392 1,515,736 44.3 Recency 108 28,502,042 39,821 0.1 Total 6,502 1,827,268,806 55,573,409 3.0
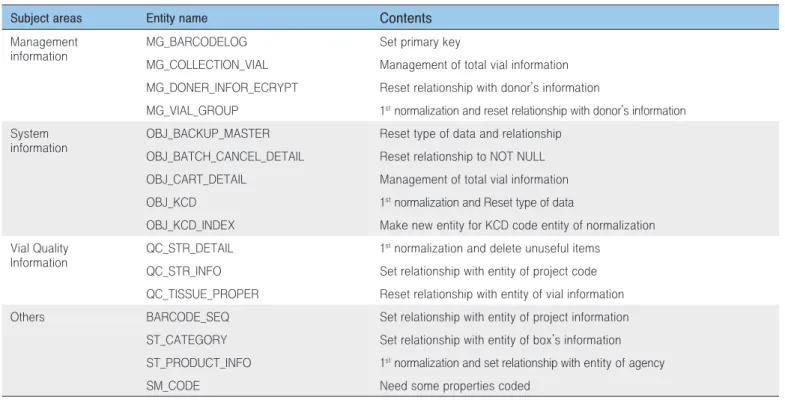
데이터베이스는 시간이 경과함에 따라 데이터 처리 성능은 저하되며, 품질 문제를 발생시킨다. 이러한 문제를 해결하기 위해서는 데이터베이스에 최적의 데이터가 저장되고 관리될 수 있는 구조를 유지하여 잘못된 데이터가 초기 단계부터 저장되지 않도록 해야 한다. 이를 위해서는 데이터베이스의 구조를 정확하게 분석하여 데이터의 정합성과 신뢰성이 보장되는 최적의 데이터베이스 구조를 유지해야 한다. 위의 내용에 따라 국립중앙인체자원은행에서 운영하고 있는 인체자원정보관리시스템의 105개 데이터 모델 개체를 선정하고, 4개의 주제 영역(제공자 및 인체자원정보, 시스템관리, 자원품질정보, 기타정보)으로 분류하여 최적의 데이터 구조 모델 분석을 진행하였다. 분석 항목으로는 데이터베이스 관리 표준화 규칙, 명명 규칙, 데이터베이스 관리 프로세스 규칙, 개체/테이블 구조, 개체/테이블 관계, 기본키(Primary key) 구조, 인덱스(Index) 및 제약 조건, 속성/컬럼 명칭 및 데이터 유형, 정규화(Normalization)로 총 9가지 항목을 정의하였다. 데이터 모델 현황 검토 중 5가지 항목이 개선이 필요한 것으로 분석되었다(Table 2). 첫 번째로 데이터 관리 표준화의 문제점은 체계적인 데이터 관리를 위한 표준화 정책의 부재에 따른 데이터 관리의 어려움으로 데이터 관리지침 및 관리 방법의 정립이 필요하다. 두 번째로 개체/테이블 구조 및 관계 설정의 문제점은 현재 활용하고 있는 많은 개체들이 정규화를 고려하지 않아 데이터의 중복 및 관리의 한계를 내포하고 있어 정규화 과정을 통한 누락 개체의 도출 및 불필요한 개체들을 제거하는 작업을 수행해야 한다. 또한 개체들 간의 관계 정의가 명확하지 않아 정합성을 유지하는데 많은 영향을 미치므로 정확한 관계 표현 표기법을 사용하여 개체들 간의 정확한 관계 설정을 해야 한다. 세 번째로 속성/칼럼 설정의 문제점은 데이터베이스 속성들의 특성을 고려하지 않은 데이터 테이블 배치에 의한 것으로, 참조 대상 속성들과 변경 대상 속성들이 같은 테이블에 산재되어 있어 성능 저하의 원인이 되고 있다. 따라서 데이터베이스 연결 시에 성능 향상에 기여하는 코드성격의 개체를 도출하여 정리(데이터 그룹화)해야 한다. 네 번째로 식별자/인덱스 설정의 문제점은 데이터베이스에 기본키를 제외하면 성능을 고려한 대체키(Alternate key)들이 설정되어있지 않다는 것이다. 따라서 식별자/인덱스 활용도를 파악하여 대체키 혹은 개체들 간의 외래키(Foreign key)를 설정하여 적절한 식별자/인덱스를 활용해야 한다. 다섯 번째로 데이터베이스를 관리하기 위해 database
Table 2. Modified entity relationship objects by subject area
Subject areas Entity name Contents
Management information
MG_BARCODELOG Set primary key
MG_COLLECTION_VIAL Management of total vial information MG_DONER_INFOR_ECRYPT Reset relationship with donor’s information
MG_VIAL_GROUP 1st normalization and reset relationship with donor’s information
System information
OBJ_BACKUP_MASTER Reset type of data and relationship OBJ_BATCH_CANCEL_DETAIL Reset relationship to NOT NULL OBJ_CART_DETAIL Management of total vial information OBJ_KCD 1st normalization and Reset type of data
OBJ_KCD_INDEX Make new entity for KCD code entity of normalization Vial Quality
Information
QC_STR_DETAIL 1st normalization and delete unuseful items
QC_STR_INFO Set relationship with entity of project code QC_TISSUE_PROPER Reset relationship with entity of vial information
Others BARCODE_SEQ Set relationship with entity of project information
ST_CATEGORY Set relationship with entity of box’s information ST_PRODUCT_INFO 1st normalization and set relationship with entity of agency
management system(DBMS)이 제공하는 편리한 기능들을 활용하는 것이 바람직하다. 그러나 현 시스템의 응용 프로그램들은 이러한 DBMS의 기능들을 활용하기 보다는 사용자 프로그램에서 이러한 내용을 반영하고 있다. 따라서 트리거(Trigger), 내장형 프로시저(Stored procedure), 적절한 뷰(View) 등과 같은 DBMS가 제공하는 기타 유용한 기능을 파악하고 활용해야 한다. 마지막으로 인체자원은행의 업무 프로세스를 정확한 업무프로세스 및 개체 매트릭스를 정의해야 한다. 실제 업무 영역을 크루드 매트릭스 분석(CRUD matrix)을 활용하여 데이터와 연관된 업무프로세스 재설계가 필요하다. 최적의 업무 프로세스를 재정립한 이후에 데이터 관리 영역에 적용함으로써 데이터들의 활용가치를 높일 수 있도록 해야 한다.
데이터 품질관리 체계 및 전략 수립
인체자원 데이터의 품질향상을 위하여 품질인증을 받는다. 데이터베이스 품질 인증제도(Database quality certification,DQC)는 조직에서 개발하여 활용 중인 정보시스템의 데이터 품질을 확보하기 위해 데이터 자체 품질과 데이터 관리 체계의 품질을 심사, 인증하여 데이터 품질 제고 및 고도화를 목적으로 한다. 한국데이터베이스진흥원에서 제시하는 데이터 품질관리 성숙도(Data quality management maturity)는 5단계로 구분하고 있으며, 이는 데이터 품질관리 성숙수준을 도입, 정형화, 통합화, 정량화, 최적화로 구분한다. 인체자원 데이터 품질관리 체계의 수준 향상을 위하여 데이터베이스 품질 인증을 받는 것은 중요한 과정 중 하나로 위의 데이터 품질 및 모델 현황을 파악한 결과를 가지고 인체자원 데이터 품질관리 성숙수준을 높여 데이터 인증(Database quality certification value) 및 데이터 관리 인증(Database quality certification management)을 단계적으로 진행하여 더욱 체계적인 데이터 품질관리 체계를 구축할 수 있다.
데이터 품질관리 추진 단계별 이행 로드맵
인체자원 데이터에 대한 품질관리 추진 목표의 단계적 달성을
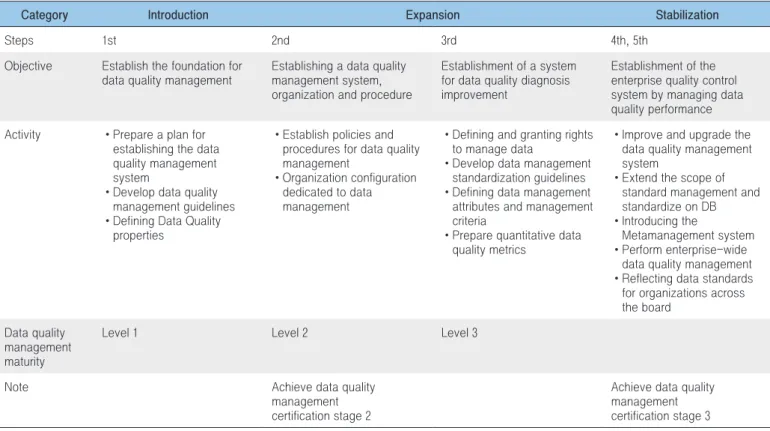
Table 3. Implementation roadmap of data quality management
Category Introduction Expansion Stabilization
Steps 1st 2nd 3rd 4th, 5th
Objective Establish the foundation for data quality management
Establishing a data quality management system, organization and procedure
Establishment of a system for data quality diagnosis improvement
Establishment of the enterprise quality control system by managing data quality performance Activity • Prepare a plan for
establishing the data quality management system
•
Develop data quality management guidelines •
Defining Data Quality properties
•
Establish policies and procedures for data quality management • Organization configuration dedicated to data management •
Defining and granting rights to manage data
•
Develop data management standardization guidelines •
Defining data management attributes and management criteria
•
Prepare quantitative data quality metrics
•
Improve and upgrade the data quality management system
•
Extend the scope of standard management and standardize on DB • Introducing the Metamanagement system • Perform enterprise-wide data quality management •
Reflecting data standards for organizations across the board
Data quality management maturity
Level 1 Level 2 Level 3
Note Achieve data quality
management certification stage 2
Achieve data quality management certification stage 3
위해서는 이행단계 및 추진 방향을 명확히 정의하고, 앞으로의 품질관리 활동을 위한 이행 로드맵을 수립할 필요가 있다. 인체자원 데이터 품질관리 추진 단계 계획은 도입기, 확산기, 성숙기로 구분할 수 있다. 인체자원 데이터 품질 관리 체계의 높은 수준 유지를 위해서 첫 번째 도입기에서는 데이터 표준화 및 데이터 품질관리 체계 수립을 통한 데이터 품질관리 기반을 확립하여야 한다. 다음으로 확산기에는 품질관리 범위 확대를 위한 활동을 하여야 한다. 이는 데이터 품질관리 체계/조직/절차 수립 및 데이터 품질 진단 개선 체계를 구축하는 것을 말한다. 끝으로 성숙기에는 데이터 품질 성과관리를 통한 전사적 품질관리 체계의 운영을 정착시키는 것을 목표로 한다. 데이터 품질관리 체계 추진 방향의 목표는 업무의 효율화를 위한 선진화된 데이터 관리와 활용체계의 구축이다. 먼저 데이터 관리의 기반을 확립하고 관리 범위를 확대하는 단계를 거쳐 정착되어 체계적으로 운영될 수 있도록 해야 한다. 이와 같은 일련의 과정에서 자원의 효율성과 데이터의 신뢰성 그리고 상호운용성이 확보된다. 이를 위한 추진 과제로는 첫째 선진 데이터 관리체계 전략계획의 수립, 둘째 데이터 품질관리 자동화 시스템을 구축, 셋째 데이터 품질관리 공인인증을 획득, 마지막으로 품질관리 전담 운영 인력을 확보하는 것이다. 인체자원 데이터 품질관리체계를 마련하기 위한 단계별 이행 로드맵으로 5개년에 걸쳐 “도입 및 기반 확립”, “품질관리 범위 확대”, “품질관리 체계 정착 운영” 으로 단계를 나누고 각 단계별 목표와 주요 활동 내역을 다음과 같이 정의하였다(Table 3).
맺는 말
인체자원은행의 데이터 품질은 정보시스템 운영 기간 및 수집된 데이터를 고려할 때, 품질수준을 높이기 위한 노력을 하고 있다. 그러나 데이터 품질현황 파악 내역 중에서 오류 데이터들을 파악하여 빠른 시일 내에 수정사항 및 개선사항을 현 데이터베이스에 적용함으로써 데이터 품질 향상을 해야 한다. 또한 데이터베이스 스키마(Schema)를 완전하게 수정하지 않은 상태에서의 오류 데이터의 수정은 현 시점에서는 좋은 데이터 품질을 유지하겠지만 일정 기간이 경과하면 반복적으로 새로운 오류가 발생할 가능성이 높기 때문에 현재의 데이터베이스 구조를 데이터 모델링 규칙을 적용하여 완전하게 수정하고, 수정된 데이터베이스에 현 데이터를 적용함으로써 지속적으로 발생할 수 있는 오류를 제거할 수 있다. 현재 인체 자 원정 보관리시스템의 데이터베이스 구 조를 변경한다는 것은 쉽게 접근할 수 있는 문제가 아니지만, 단기적으로 데이터베이스 구조를 조금만 변경해서 높은 성능을 보장받을 수 있거나 데이터의 정확성을 높일 수 있는 부분들은 먼저 반영하여 진행하는 것이 바람직하다고 판단된다. 장기적으로는 정보시스템 품질관리 담당자가 데이터 품질관리 이행 로드맵에 포함된 구분별 주요 활동을 성실히 이행함으로써 단계별 데이터 품질관리 성과를 이룰 수 있도록 해야 하며, 데이터 품질 인증기관을 통한 높은 데이터 품질 인증 수준을 획득할 수 있도록 노력해야 한다. 이를 통해 인체자원 데이터 품질이 향상될 수 있으며 연구자들에게 양질의 데이터를 제공할 수 있다. 또한 질병관리본부 인체자원은행의 현행 업무 프로세스를 대상으로 Process-Entity Matrix(CRUD Matrix)를 작성하여 업무와 데이터의 연관 관계를 정확하게 파악할 수 있는 업무 프로세스 재설계(Business Process Re-Engineering, BPR)를 수행해야 한다. 이를 통해 인체자원은행에서 수행하는 업무와 데이터 간의 연관관계의 파악 뿐 아니라 데이터 관리 수준 향상 및 응용 프로그램 개발에도 도움을 줄 수 있다. 이러한 내용들을 정보시스템의 구축 측면에서 살펴보면, 업무 프로세스 재설계가 먼저 수행되어야 하며 다음으로 데이터 구조 변환 및 데이터 이관의 작업이 수행되어야 한다. 그리고 이를 바탕으로 응용 프로그램 변환을 수행해야 한다. 마지막으로, 데이터의 생성으로부터 폐기에 이르는 데이터 생명주기와 중요성 데이터를 관리하는 관련자는 물론 데이터 생성 및 활용의 주체인 사용자들에게도 교육을 함으로써 데이터의 품질 저하 가능성을 줄이고 올바른 사용을 할 수 있도록 해야 한다.이 글은 2017년 질병관리본부 정책용역사업 과제인 “인체자원 데이터 품질관리체계 마련 연구” 보고서를 일부 요약 정리한 내용입니다.
참고문헌
1. 한국데이터베이스진흥원. 데이터 품질 가이드라인. 2011. 2. 한국데이터베이스진흥원. 데이터 품질관리 성숙모형(ver 1.0). 2006. 3. 한국데이터베이스진흥원. 데이터 품질관리 지침(ver 2.1). 2006. 4. 한국데이터베이스진흥원. 데이터베이스 품질 인증 안내서. 2011. 5. 한국데이터베이스진흥원. 데이터베이스 품질 인증 도입 전략과 방안. 2010. 6. 김창재, 최용락, 류성열. 소프트웨어공학 : 정보 품질 성숙도 모델에 관한 연구. 정보처리학회 논문지. 2004;13(4): 557-64. 7. 문성은. 메타데이터와 연계한 데이터품질관리의 경제적 효과 분석 및 사례 연구. 숭실대학교. 2012. 8. 최용락. 데이터 품질 관리. 숭실대학교. 2014.연구단신, Brief report
수인성 식품매개 바이러스 검사용 표준물질 소개
질병관리본부 감염병분석센터 바이러스분석과 정선영, 이덕용, 최우영, 강춘* 감염병진단관리과 박예은
*교신저자 : [email protected], 043-719-8190
Introduction of reference materials for water- and food-borne disease viruses
Jung Sunyoung, Lee Deog-Yong, Choi Wooyoung, Kang Chun
Division of Viral Diseases, Center for Laboratory Control of Infectious Diseases, KCDC Park Ye Eun
Division of Laboratory Diagnosis Management, Center for Laboratory Control of Infectious Diseases, KCDC
Positive controls are crucial to ascertain the reliability of results in diagnosis and experiments. Therefore, we have produced reference material according to international regulation and have used it as a positive control. In this article, we introduce the reference material for detection of water- and food-borne disease viruses. ISO guideline 34/35 is the international standard for reference material, which has the management-related, technical requirements for producing such materials. Reference material of norovirus, which is the representative water- and food-borne pathogen, has been produced globally. However, it remains valid only for a short duration after production and shows mismatches in amplification region. In Korea, some reference materials have been produced and are being used as internal controls without following the international guidelines. Therefore, the Korea Center for Disease Control and Prevention (KCDC) started to produce the reference material for water- and food-borne disease viruses based on the international standard, ISO guideline 34/35. The process of production was as follows: selection of the target region, RNA synthesis, measurement of concentration, contamination, homogeneity, and stability. First, we selected norovirus and subsequently have expanded to other food-borne disease viruses. Now, KCDC provides 6 type of reference materials to be used as positive control materials for diagnosis of viruses that cause water- and food-borne diseases. To improve the reference material produced, the standard materials obtained should be improved continuously and be used as positive controls for achieving the reliable experimental results.
들어가는 말
질병관리본부에서는 전국 시·도 보건환경연구원과 함께 바이러스성 장염에 대한 전국적인 실험실 감시망을 운영하고 있다. 바이러스성 장염은 주로 소아에서 급성으로 발현하는 질환으로서 노로바이러스(Norovirus) 외 그룹 A형 로타바이러스(Group A Rotavirus), 장 아데노바이러스(Enteric adenovirus), 아스트로바이러스 (Astrovirus), 사포바이러스(Sapovirus)가 주요 원인 병원체이다. 매년 표본 감시 사업을 통해 2만 여건의 검체에 대한 검사가 이루어지고 있으며, 양성 검체에 대한 유전자 특성 분석도 함께 이루어지고 있다. 신속한 실험실 검사와 자료 분석을 통하여 실시간으로 결과가 환류 되어야 하므로, 이를 위해 검사 시간의 단축과 특이도를 높이기 위해 유전자 검사법인 PCR이 보편적으로 사용되고 있다. 특히, 실험 결과의 확실성을 위해 양성대조물질(실험 결과에 항상 활성을 가지는 것)과 음성대조물질(결과에 항상 비활성을 가지는 것)을 기본적으로 사용하고 있다. 양성대조물질은 병원체 검사의 정확성, 정밀성 그리고 재현성에 대한 보장을 위해 반드시 필요한 물질이다. 병원체 검사에 대한 향상된 질 관리와 결과 값에 대한 객관성을 높이기 위해 장염 바이러스에 대한 국내·외 표준물질을 조사하였다. 하지만 국내에서 범용으로 사용할 수 있으면서 국제기준에 부합하는 인증 표준물질(Certified Reference Material, CRM)은 확보할 수 없었다. 이 글을 통해 양성대조물질에 대한 개념과 국제적인 기준을 정리하고 이에 준하는 장염바이러스 표준물질 생산을 위해 질병관리본부에서 수행하였던 결과를 소개하고자 한다.
몸 말
2000년도 초반 국제적인 무역환경의 변화에 따라 시험의 소급성, 정확도 그리고 정밀도 등에 대한 요구가 증대되었고, 시험의 중요 요소 중 하나인 측정 소급성에 대한 인식전환이 이루어지면서 국제공인시험기관의 기능이 급격히 확대되었다. 특히, 국제표준화기구 표준물질위원회(ISO Committee on Reference Materials, ISO/REMCO)에서는 국제표준물질 데이터베이스(Code d’Indexation des Matėriaux de Rėfėrence, COMAR)에 각국이 개발한 표준물질들을 등록하고 사용하도록 권고하고 있다. 이곳에 등록된 표준물질들은 규정된 요건에 따라 물질의 생산, 관리 및 통계적 분석을 수행하여 인증 절차를 따르기를 요구하고 있으며, Homogeneous StableRM’s
CRM’s
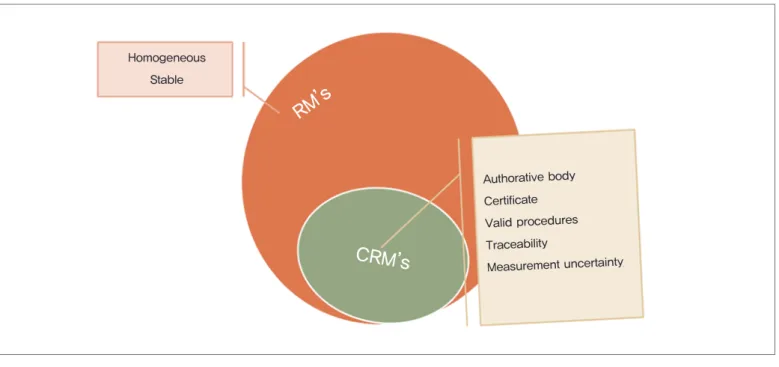
Authorative body Certificate Valid procedures Traceability Measurement uncertaintyFigure 1. Range of reference material and certified reference material
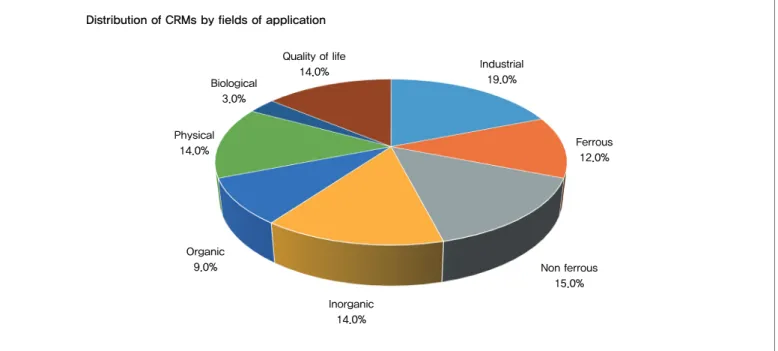
Industrial 19.0% Ferrous 12.0% Non ferrous 15.0% Inorganic 14.0% Organic 9.0% Physical 14.0% Biological 3.0% Quality of life 14.0%
Distribution of CRMs by fields of application
Figure 2. Current situation of international reference material database
Biological field accounts for 3%, which is divided into 10 areas.
① bacteriology and mycology ② clinical chemistry ③ general medicine ④ haematology and cytology ⑤ immunohaematology, transfusion, transplant ⑥ immunology ⑦ parasitology ⑧ pathology and histology ⑨ virology ⑩ other biological and clinical RM
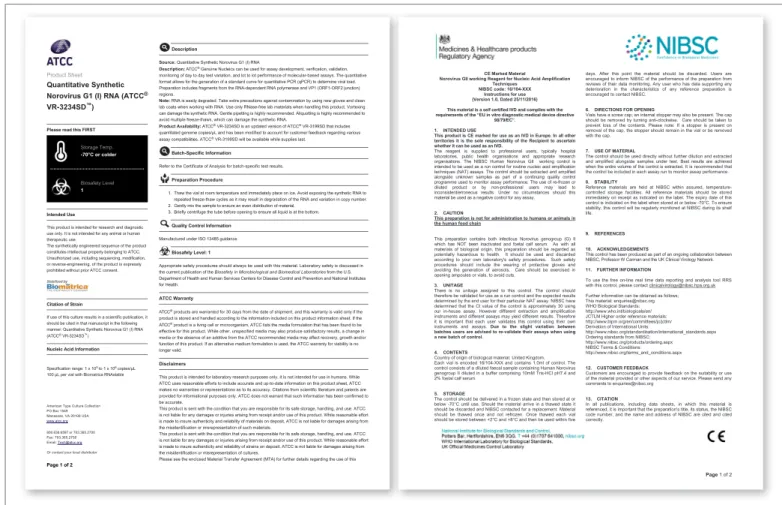
표준물질은 ISO guideline 34/35에 따라 생산 및 관리하도록 되어있다. ISO guideline 34/35에는 표준물질 생산을 위한 경영 요구사항과 기술 및 생산 요구사항에 대해 자세히 언급 되어있다. 경영 요구사항에는 조직 및 경영, 위탁기관의 활용, 고객서비스 및 물품구매, 계약, 부적합 물질의 관리, 시정 및 예방 조치, 경영 검토 등이 해당된다. 기술 및 생산 요구사항에는 물질을 직접 생산하는데 관련된 인력, 시설 및 환경, 측정 장비, 물질제조, 특성 값 및 불확도 부여, 균질성 및 안정성 평가, 측정소급성 확보 등이 해당된다[1, 2]. 국제표준기준의 정의에 따르면 표준물질(Reference Material, RM)이란 측정기기의 교정, 측정방법의 평가 또는 재료에 값을 부여하는 것에 사용하기 위해 하나 이상의 특성 값이 충분히 균일하고 적절하게 확정되어 있는 재료 또는 물질이라고 정의되어있다. 이러한 표준물질에 특성 값을 나타내는 단위의 정확한 표현과 이 단위에 근거하여 소급성이 확립된 절차에 따라 하나 이상의 특성 값이 인증되며, 각 인증 값에 정해진 신뢰수준에서의 불확도가 확보된 인증서가 수반되면 이 물질을 인증 표준물질(Certified Reference Material, CRM)이라고 부른다(Figure 1)[1, 2]. 국제표준물질 데이터베이스에 현재까지 등록된 생물학분야의 인증물질은 전체의 3.0%정도를 차지하고 있다(Figure 2)[3]. 장 염을 유발하 는 병원체중 노 로바이러스는 전 세계적으 로 가장 높은 유병률을 보이는 병원체로써 우리나라에서도 질병 관리본부와 여러 부처의 검사기관에서 검사를 수행하고 있다. 노로바이러스 표준물질은 영국의 NIBSC(National Institute for Biological Standards and Control, 국립생물표준통제연구원)와 미국의 ATCC(American Type Culture Collection, The Global Bioresource Center, 미국의 생물자원 보관 및 분양 등을 하는 기관)에서 제조하는 것으로 알려져 있으나 일상적인 진단용으로 사용하기에는 가격이 비싸고, 국내에서는 수입해서 사용해야 하며 유효기간이 약 1개월여 밖에 되지 않는다는 제한점이 있다. 또한 우리나라에서 유전자 진단 및 감시사업을 위해 사용하고 있는 유전자 부위와 시판되고 있는 인증표준물질의 부위가 달라서 국내에서 범용으로 사용하는데 한계가 있다(Figure 3)[4]. 국내에서는 식품의약품안전처와 국립환경과학원에서 transcript RNA를 이용한 표준물질을 합성하여 사용하고 있다[5]. 그러나 국제기준에 따라 생산 및 관리되는 물질이 아니며 내부 양성대조물질의 수준에만
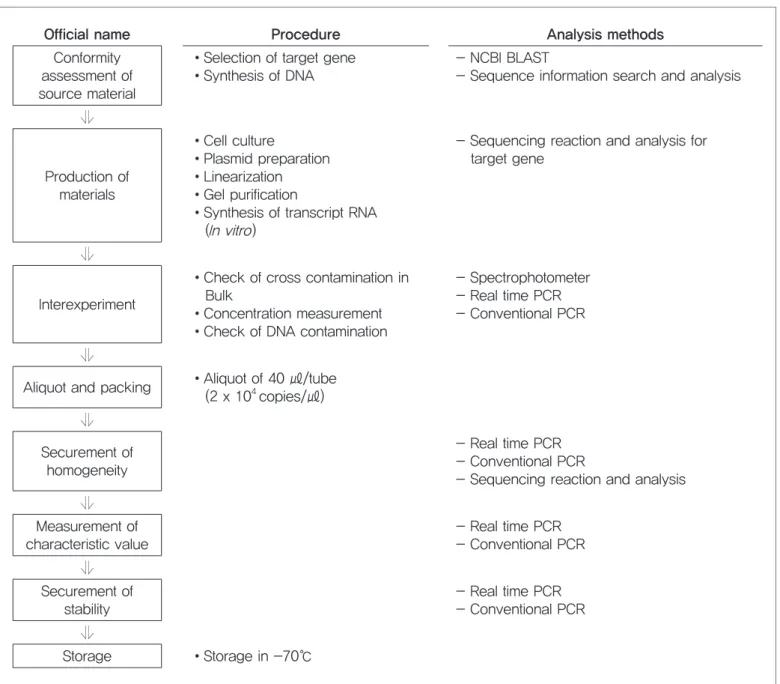
머물러 있다. 또한 노로바이러스 외 수인성 식품매개 바이러스인 그룹 A형 로타바이러스, 장아데노바이러스, 아스트로바이러스, 사포바이러스와 A형 간염바이러스도 국제적인 표준물질이 존재하지 않거나 내부 양성대조물질용으로 생산 및 사용하고 있는 등 노로바이러스와 비슷한 한계점을 가지고 있다. 질병관리본부에서는 이러한 한계점을 극복하고 국내에서 범용으 로 사 용할 수 있는 표준 물 질을 생산 하고 자 하였다. 국제규격기준인 ISO guideline 34/35에 맞는 표준물질 생산시스템을 구축하기 위해 우선 노로바이러스 1종을 대상으로 생산을 시작했다. 노로바이러스 감염을 확인하기 위해서는 먼저 실시간 유전자 증폭법(Real-time RT-PCR)을 이용하여 바이러스의 감염여부를 확인한 후, 일반 유전자 증폭법(Conventional RT-PCR)을 통해 증폭된 유전자의 염기서열을 확인하여 유전형을 확인하는 과정을 거친다. 두 시험법에서 증폭하고자 하는 유전자의 부위가 다르고,
Figure 3. Certified reference material of norovirus
The ATCC’ and NIBSC’ corporation are representative materials.
기관 또는 연구자별로 사용하는 프라이머(Primer)의 위치가 달라 기존의 표준물질 사용의 한계가 있었던 점을 고려하여 이 부분을 모두 포함하는 표준물질을 제작하고자 하였다. 노로바이러스 표준물질을 생산하기 위해 인체 감염을 일으키는 유전자 그룹인 Group I 과 Group Ⅱ 에서 가장 높은 유병률을 보이는 두 유전형(GI.4, GⅡ.4)을 선별하고 다른 유전형과 상호 비교하여 유전자의 대표성을 확인하였다. 두 유전형에 대한 염기서열을 바탕으로 주형 DNA를 합성하고, 이를 이용하여 합성 RNA를 만드는 공정을 시작하였다. 대상 유전자 선별, RNA 합성, 생산된 RNA의 특성 값, 오염 여부, 균질성 및 안정성 확인의 과정을 거쳐 최종 사용 단계의 합성 RNA를 생산하였다. 생산된 표준물질은 실시간 유전자 증폭법(Real-time RT-PCR)과 일반 유전자 증폭법(Conventional RT-PCR)에 의해 모두 증폭됨을 확인하였다. 두 시험법에 의해 충실히 유전자가 증폭될 수 있는 농도(2 x 10⁴ copies/㎕)를 Source: Quantitative Synthetic Norovirus G1 (I) RNA Description: ATCC® Genuine Nucleics can be used for assay development, verification, validation, monitoring of day to day test variation, and lot to lot performance of molecularbased assays. The quantitative format allows for the generation of a standard curve for quantitative PCR (qPCR) to determine viral load. Preparation includes fragments from the RNAdependent RNA polymerase and VP1 (ORF1ORF2 junction) regions. Note: RNA is easily degraded. Take extra precautions against contamination by using new gloves and clean lab coats when working with RNA. Use only RNasefree lab materials when handling this product. Vortexing can damage the synthetic RNA. Gentle pipetting is highly recommended. Aliquotting is highly recommended to avoid multiple freezethaws, which can damage the synthetic RNA.
Product Availability: ATCC® VR3234SD is an updated version of ATCC® VR3199SD that includes
quantitated genome copies/µL and has been modified to account for customer feedback regarding various assay compatibilities. ATCC® VR3199SD will be available while supplies last. Refer to the Certificate of Analysis for batchspecific test results. 1. Thaw the vial at room temperature and immediately place on ice. Avoid exposing the synthetic RNA to repeated freezethaw cycles as it may result in degradation of the RNA and variation in copy number. 2. Gently mix the sample to ensure an even distribution of material. 3. Briefly centrifuge the tube before opening to ensure all liquid is at the bottom. Manufactured under ISO 13485 guidance Appropriate safety procedures should always be used with this material. Laboratory safety is discussed in the current publication of the Biosafety in Microbiological and Biomedical Laboratories from the U.S. Department of Health and Human Services Centers for Disease Control and Prevention and National Institutes for Health. ATCC Warranty ATCC® products are warranted for 30 days from the date of shipment, and this warranty is valid only if the product is stored and handled according to the information included on this product information sheet. If the ATCC® product is a living cell or microorganism, ATCC lists the media formulation that has been found to be effective for this product. While other, unspecified media may also produce satisfactory results, a change in media or the absence of an additive from the ATCC recommended media may affect recovery, growth and/or function of this product. If an alternative medium formulation is used, the ATCC warranty for viability is no longer valid. Disclaimers This product is intended for laboratory research purposes only. It is not intended for use in humans. While ATCC uses reasonable efforts to include accurate and uptodate information on this product sheet, ATCC makes no warranties or representations as to its accuracy. Citations from scientific literature and patents are provided for informational purposes only. ATCC does not warrant that such information has been confirmed to be accurate. This product is sent with the condition that you are responsible for its safe storage, handling, and use. ATCC is not liable for any damages or injuries arising from receipt and/or use of this product. While reasonable effort is made to insure authenticity and reliability of materials on deposit, ATCC is not liable for damages arising from the misidentification or misrepresentation of such materials. This product is sent with the condition that you are responsible for its safe storage, handling, and use. ATCC is not liable for any damages or injuries arising from receipt and/or use of this product. While reasonable effort is made to insure authenticity and reliability of strains on deposit, ATCC is not liable for damages arising from the misidentification or misrepresentation of cultures. Please see the enclosed Material Transfer Agreement (MTA) for further details regarding the use of this Description BatchSpecific Information Preparation Procedure Quality Control Information Biosafety Level: 1 Page 1 of 2 Product Sheet Quantitative Synthetic Norovirus G1 (I) RNA (ATCC® VR3234SD™) Please read this FIRST Storage Temp. 70°C or colder Biosafety Level 1 Intended Use This product is intended for research and diagnostic use only. It is not intended for any animal or human therapeutic use. The synthetically engineered sequence of the product constitutes intellectual property belonging to ATCC. Unauthorized use, including sequencing, modification, or reverseengineering, of the product is expressly prohibited without prior ATCC consent. Citation of Strain If use of this culture results in a scientific publication, it should be cited in that manuscript in the following manner: Quantitative Synthetic Norovirus G1 (I) RNA (ATCC® VR3234SD™) Nucleic Acid Information
Specification range: 1 x 10⁵ to 1 x 10⁶ copies/µL 100 µL per vial with Biomatrica RNAstable American Type Culture Collection PO Box 1549 Manassas, VA 20108 USA www.atcc.org 800.638.6597 or 703.365.2700 Fax: 703.365.2750 Email: [email protected] Or contact your local distributor Page 1 of 2 CE Marked Material Norovirus GII working Reagent for Nucleic Acid Amplification
Techniques NIBSC code: 16/104-XXX
Instructions for use (Version 1.0, Dated 25/11/2016) This material is a self certified IVD and complies with the requirements of the “EU in vitro diagnostic medical device directive
98/79/EC”. 1. INTENDED USE
This product is CE marked for use as an IVD in Europe. In all other territories it is the sole responsibility of the Recipient to ascertain whether it can be used as an IVD.
The reagent is supplied to professional users, typically hospital laboratories, public health organisations and appropriate research organisations. The NIBSC Human Norovirus GII working control is intended to be used as a run control for routine nucleic acid amplification techniques (NAT) assays. The control should be extracted and amplified alongside unknown samples as part of a continuing quality control programme used to monitor assay performance. The use of re-frozen or diluted product or by non-professional users may lead to inconsistent/erroneous results. Under no circumstances should this material be used as a negative control for any assay.
2. CAUTION
This preparation is not for administration to humans or animals in the human food chain
This preparation contains both infectious Norovirus genogroup (G) II which has NOT been inactivated and foetal calf serum. As with all materials of biological origin, this preparation should be regarded as potentially hazardous to health. It should be used and discarded according to your own laboratory's safety procedures. Such safety procedures should include the wearing of protective gloves and avoiding the generation of aerosols. Care should be exercised in opening ampoules or vials, to avoid cuts.
3. UNITAGE
There is no unitage assigned to this control. The control should therefore be validated for use as a run control and the expected results determined by the end user for their particular NAT assay. NIBSC have determined that the Ct value of the control is approximately 30 using our in-house assay. However different extraction and amplification instruments and different assays may yield different results. Therefore it is important that each user validates this control using their own instruments and assays. Due to the slight variation between batches users are advised to re-validate their assays when using a new batch of control.
4. CONTENTS
Country of origin of biological material: United Kingdom. Each vial is encoded 16/104-XXX and contains 1.0ml of control. The control consists of a diluted faecal sample containing Human Norovirus genogroup II diluted in a buffer comprising 10mM Tris-HCl pH7.4 and 2% foetal calf serum.
5. STORAGE
The control should be delivered in a frozen state and then stored at or below -70°C until use. Should the material arrive in a thawed state it should be discarded and NIBSC contacted for a replacement. Material should be thawed once and not refrozen. Once thawed each vial should be stored between +2°C and +8°C and then be used within five
days. After this point the material should be discarded. Users are encouraged to inform NIBSC of the performance of the preparation from reviews of their data monitoring. Any user who has data supporting any deterioration in the characteristics of any reference preparation is encouraged to contact NIBSC.
6. DIRECTIONS FOR OPENING
Vials have a screw cap; an internal stopper may also be present. The cap should be removed by turning anti-clockwise. Care should be taken to prevent loss of the contents. Please note: If a stopper is present on removal of the cap, the stopper should remain in the vial or be removed with the cap.
7. USE OF MATERIAL
The control should be used directly without further dilution and extracted and amplified alongside samples under test. Best results are achieved when the entire volume of the control is extracted. It is recommended that the control be included in each assay run to monitor assay performance.
8. STABILITY
Reference materials are held at NIBSC within assured, temperature-controlled storage facilities. All reference materials should be stored immediately on receipt as indicated on the label. The expiry date of this control is indicated on the label when stored at or below -70°C. To ensure stability, this control will be regularly monitored at NIBSC during its shelf life.
9. REFERENCES
10. ACKNOWLEDGEMENTS
This control has been produced as part of an ongoing collaboration between NIBSC, Professor W Carman and the UK Clinical Virology Network.
11. FURTHER INFORMATION
To use the free on-line real time data reporting and analysis tool RRS with this control, please contact [email protected] Further information can be obtained as follows; This material: [email protected] WHO Biological Standards: http://www.who.int/biologicals/en/ JCTLM Higher order reference materials: http://www.bipm.org/en/committees/jc/jctlm/ Derivation of International Units:
http://www.nibsc.org/standardisation/international_standards.aspx Ordering standards from NIBSC:
http://www.nibsc.org/products/ordering.aspx NIBSC Terms & Conditions: http://www.nibsc.org/terms_and_conditions.aspx
12. CUSTOMER FEEDBACK
Customers are encouraged to provide feedback on the suitability or use of the material provided or other aspects of our service. Please send any comments to [email protected]
13. CITATION
In all publications, including data sheets, in which this material is referenced, it is important that the preparation's title, its status, the NIBSC code number, and the name and address of NIBSC are cited and cited correctly.
최종 농도로 설정하고, 측정 불확도를 산출하여 최종 특성 값을 정하였다. 단기안정성과 장기안정성 검사를 통해 실온에서는 3일, -20℃에서는 한달, -70℃에서는 1년까지 합성된 RNA가 안정되게 보관됨을 확인하였다. 각 단계에 대한 생산 공정서를 작성하여 생산과정의 재현성을 확보하고 생산 시스템에 대한 표준화를 구축하였다(Figure 4). 구 축 된 생 산 시 스 템 을 바 탕 으 로 병 원 체 를 확 대 하 여 생산하였다. 대상 병원체는 국내 집단 환자 발생이 많고, 유전자 검사가 주요 진단법인 수인성 식품매개 바이러스 6종으로, 급성위장관염을 일으키는 5종의 장염바이러스(노로바이러스, 그룹 A형 로타바이러스, 장아데노바이러스, 아스트로바이러스, 사포바이러스)와 급성간염을 일으키는 A형 간염바이러스가 이에 해당한다. 장아데노바이러스를 제외한 5종의 바이러스가 RNA를 핵산으로 갖고 있어, 다양한 종류를 동시 생산하면서 발생할 수 있는 오염 문제를 배제하기 위해 생산 단계별로 순차적으로 생산하는 시스템을 추가로 도입하였다. 생산된 표준물질의 품질확인을 위해
Official name Procedure Analysis methods
Conformity assessment of source material
•Selection of target gene •Synthesis of DNA
- NCBI BLAST
- Sequence information search and analysis ⇓ Production of materials •Cell culture •Plasmid preparation •Linearization •Gel purification
•Synthesis of transcript RNA (In vitro)
- Sequencing reaction and analysis for target gene
⇓ Interexperiment
•Check of cross contamination in Bulk
•Concentration measurement •Check of DNA contamination
- Spectrophotometer - Real time PCR - Conventional PCR ⇓
Aliquot and packing •Aliquot of 40 ㎕/tube
(2 x 10⁴ copies/㎕) ⇓ Securement of homogeneity - Real time PCR - Conventional PCR
- Sequencing reaction and analysis ⇓ Measurement of characteristic value - Real time PCR - Conventional PCR ⇓ Securement of stability - Real time PCR - Conventional PCR ⇓ Storage •Storage in -70℃
공동시험분석을 시행하였다. 또한 생산된 표준물질의 한계점으로 안정성이 지적되어 그것을 보완하기 위해 RNAase inhibitor를 사 용하여 일반 저온냉동고(-20℃)에서도 3개월까지 보관이 가능하도록 개선하였다. 표준물질의 불활화로 인해 발생할 수 있는 결과의 오차를 최소화하기 위해 포장용기 개봉 후 1회 사용할 것을 권장하며 나머지는 폐기하는 것을 사용매뉴얼의 원칙으로 하였다. 1회성을 강조하고 재사용 방지를 위해 각 포장 용기 당 담겨있는 표준물질의 양을 40 ㎕에서 20 ㎕로 줄이고 적절한 농도의 RNAase inhibitor를 사용하였다. 또한 초저온(-70℃)에서 동결 상태로 장기간 보관 시 증발되는 현상을 막기 위해 보관 용기를 PCR tube에서 Screw-cap 방식으로 교체하고, 1차 동결 후 cap을 재 봉인하는 과정을 생산 공정에 추가하여 증발현상을 최소화 하였다. 현재 생산된 수인성 식품매개 바이러스 표준물질은 식품 의약품안전처 등 장염바이러스 진단 업무를 수행하고 있는 국가기관 및 각 시·도의 보건환경연구원, 국방부 산하 국군의학연구소, 지자체 상하수도연구소까지 무상으로 배포하여 검사업무 수행 시 검사의 객관성 확보를 위한 양성대조 물질로 사용하고 있다. 또한 보건검사기관의 정도 평가 및 장비의 검·교정을 위한 표준물질로도 활용하고 있다. 또한 생산된 표준물질의 일부는 일반 연구자와 민간기관에서도 활용할 수 있도록 국가병원체자원은행에 기탁하기도 하였다.
맺는 말
지속적인 개선을 통해 수인성식품매개바이러스에 대한 표준물질은 세계적인 수준의 표준물질로서 자리를 잡아가고 있지만 여전히 해결해야 하는 한계점들이 있다. 첫째, 생물분야 표준물질이 공통적으로 안고 있는 문제점으로서 SI unit(International System of Unit)의 부재이다. 특성 값을 표현하기 위해서 국제적으로 공인된 SI unit이 필요하지만, 생물분야에서 대부분 적절한 SI unit이 없는 실정이다. 현재는 합성 RNA의 물질 내 농도를 계산하여 특성 값으로 사용하고 있다. 둘째, 생산한 물질의 소급성 확보를 위한 신뢰성 있는 대조물질이 없는 점이다. 이를 보완하기 위해 질병관리본부에서는 자체적으로 개발한 검사법을 이용하여 cloned plasmid를 대조물질로 사용하여 상대 정량을 수행하고 있다. 마지막으로 합성 RNA의 안정성이다. 장기간 보관 시 초저온냉동고 (-70℃)에 보관해야 하므로 장비를 갖추고 있지 않은 기관에서는 물질보관에 한계가 있다. 검사 및 진단업무에서 신뢰성 있는 양성대조 물질의 사용은 결과의 객관성 확보를 위해 필수적인 요소이다. 질병관리본부에서는 수인성 식품매개 바이러스에 대한 유전자 검사를 위해 국제기준에 따라 생산 시스템을 구축하여 명실상부한 국제 수준의 표준물질을 생산하고 있다. 표준물질의 안정성 및 활용성 제고를 위해 동결제형의 개발 등 아직 해결되지 않은 문제점을 극복하여 양질의 표준물질 확보를 위한 지속적인 노력이 필요하다.참고 문헌
1. KSA ISO guideline 34. 2. KSA ISO guideline 35. 3. http://www.comar.bam.de/en4. 질병관리본부 국립보건연구원. 수인성식품매개질환 실험실 진단 실무 지침. 2015. 11-1352159-000371-14(발간등록번호).
5. Lee SG, Lee SH, Park SW, Suh CI, Jheong WH, Oh S, Paik SY. Standardized positive controls for detection of norovirus by reverse transcription PCR. Virol. J. 2011;26(8):260. doi: 10.1186/1743-422X-8-260.
Classification of disease‡ Current
week Cum.2018
5-year weekly average
Total no. of cases by year Imported cases
of current week : Country (no. of cases) 2017 2016 2015 2014 2013 Category Ⅰ Cholera 0 0 0 5 4 0 0 3
Typhoid fever 10 65 3 128 121 121 251 156 Laos(4), Vietnam(2), Pakistan(1), Indonesia(1) Paratyphoid fever 1 6 1 73 56 44 37 54 Shigellosis 2 81 2 111 113 88 110 294 Philippines(2) EHEC 0 8 1 139 104 71 111 61 Viral hepatitis A 89 530 53 4,429 4,679 1,804 1,307 867 Category Ⅱ Pertussis 15 118 2 338 129 205 88 36 Tetanus 0 2 0 34 24 22 23 22 Measles 1 9 1 8 18 7 442 107 Mumps 238 1,844 221 16,924 17,057 23,448 25,286 17,024 Rubella 3 24 0 11 11 11 11 18
Viral hepatitis B (Acute) 6 56 5 393 359 155 173 117 Japanese encephalitis 0 0 0 9 28 40 26 14 Varicella 910 10,401 701 80,074 54,060 46,330 44,450 37,361 Streptococcus pneumoniae 20 179 7 522 441 228 36 -Category Ⅲ Malaria 1 10 1 515 673 699 638 445 Scarlet fever§ 426 3,358 167 22,852 11,911 7,002 5,809 3,678 Meningococcal meningitis 0 1 0 18 6 6 5 6 Legionellosis 7 39 1 195 128 45 30 21
Vibrio vulnificus sepsis 0 0 0 47 56 37 61 56
Murine typhus 0 0 0 20 18 15 9 19 Scrub typhus 13 149 6 10,590 11,105 9,513 8,130 10,365 Leptospirosis 0 13 1 132 117 104 58 50 Brucellosis 4 10 0 6 4 5 8 16 Rabies 0 0 0 0 0 0 0 0 HFRS 2 46 3 598 575 384 344 527 Syphilis 39 340 19 2,153 1,569 1,006 1,015 799 CJD/vCJD 2 19 1 40 42 33 65 34 Tuberculosis 652 4,542 583 28,577 30,892 32,181 34,869 36,089 HIV/AIDS 23 106 14 1,005 1,062 1,018 1,081 1,013 Viral hepatitis C 197 1,789 - 6,394 - - - -VRSA 0 0 - 0 - - - -CRE 169 1,278 - 5,414 - - - -Category Ⅳ
Dengue fever 12 32 4 177 313 255 165 252 Vietnam(3), Philippines(3), Thailand(2), Taiwan(1), Laos(1), Malaysia(1), Indonesia(1) Q fever 20 62 1 109 81 27 8 11 Vietnam(2)
West Nile fever 0 0 0 0 0 0 0 0
Lyme Borreliosis 3 17 0 32 27 9 13 11
Melioidosis 0 0 0 2 4 4 2 2
Chikungunya fever 0 3 0 5 10 2 1 2
SFTS 0 0 0 272 165 79 55 36
MERS 0 0 - 0 0 185 -
-Zika virus infection 0 0 - 11 16 - -
-Table 1. Reported cases of national infectious diseases in Republic of Korea, week ending February 24, 2018 (8th Week)*
Unit: No. of cases†
Abbreviation: EHEC= Enterohemorrhagic Escherichia coli, HFRS= Hemorrhagic fever with renal syndrome, CJD/vCJD= Creutzfeldt-Jacob Disease / variant Creutzfeldt-Jacob Disease, VRSA= Vancomycin-resistant Staphylococcus aureus, CRE= Carbapenem-resistant Enterobacteriaceae, SFTS= Severe fever with thrombocytopenia syndrome, MERS-CoV= Middle East Respiratory Syndrome Coronavirus.
Cum: Cumulative counts from 1st week to current week in a year.
* The reported data for year 2017, 2018 are provisional but the data from 2013 to 2016 are finalized data.
† According to surveillance data, the reported cases may include all of the cases such as confirmed, suspected, and asymptomatic carrier in the group.
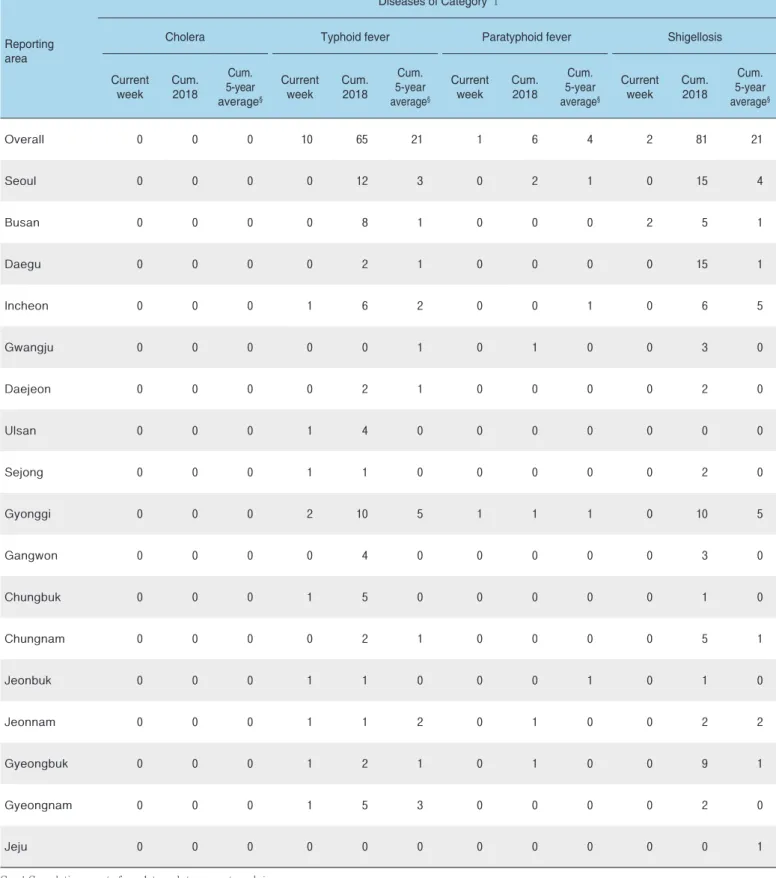
Table 2. Reported cases of infectious diseases by geography, week ending February 24, 2018 (8th Week)*
Unit: No. of cases†
Reporting area
Diseases of Category Ⅰ
Cholera Typhoid fever Paratyphoid fever Shigellosis
Current week Cum.2018 Cum. 5-year average§ Current week Cum.2018 Cum. 5-year average§ Current week Cum.2018 Cum. 5-year average§ Current week Cum.2018 Cum. 5-year average§ Overall 0 0 0 10 65 21 1 6 4 2 81 21 Seoul 0 0 0 0 12 3 0 2 1 0 15 4 Busan 0 0 0 0 8 1 0 0 0 2 5 1 Daegu 0 0 0 0 2 1 0 0 0 0 15 1 Incheon 0 0 0 1 6 2 0 0 1 0 6 5 Gwangju 0 0 0 0 0 1 0 1 0 0 3 0 Daejeon 0 0 0 0 2 1 0 0 0 0 2 0 Ulsan 0 0 0 1 4 0 0 0 0 0 0 0 Sejong 0 0 0 1 1 0 0 0 0 0 2 0 Gyonggi 0 0 0 2 10 5 1 1 1 0 10 5 Gangwon 0 0 0 0 4 0 0 0 0 0 3 0 Chungbuk 0 0 0 1 5 0 0 0 0 0 1 0 Chungnam 0 0 0 0 2 1 0 0 0 0 5 1 Jeonbuk 0 0 0 1 1 0 0 0 1 0 1 0 Jeonnam 0 0 0 1 1 2 0 1 0 0 2 2 Gyeongbuk 0 0 0 1 2 1 0 1 0 0 9 1 Gyeongnam 0 0 0 1 5 3 0 0 0 0 2 0 Jeju 0 0 0 0 0 0 0 0 0 0 0 1
Cum: Cumulative counts from 1st week to current week in a year
* The reported data for year 2017, 2018 are provisional but the data from 2013 to 2016 are finalized data.
† According to surveillance data, the reported cases may include all of the cases such as confirmed, suspected, and asymptomatic carrier in the group. § Cum. 5-year average is mean value calculated by cumulative counts from 1st week to current week for 5 preceding years.
Reporting area
Enterohemorrhagic
Escherichia coli Viral hepatitis A Pertussis Tetanus
Current week Cum.2018 Cum. 5-year average§ Current week Cum.2018 Cum. 5-year average§ Current week Cum.2018 Cum. 5-year average§ Current week Cum.2018 Cum. 5-year average§ Overall 0 8 3 89 530 325 15 118 15 0 2 0 Seoul 0 0 1 19 98 59 4 20 5 0 0 0 Busan 0 0 0 0 11 8 1 3 1 0 0 0 Daegu 0 2 0 2 18 8 0 1 0 0 1 0 Incheon 0 0 0 9 43 24 1 13 0 0 0 0 Gwangju 0 1 1 1 6 7 1 3 1 0 0 0 Daejeon 0 0 0 2 23 13 0 1 0 0 0 0 Ulsan 0 0 0 0 7 4 0 0 1 0 0 0 Sejong 0 0 0 1 3 3 0 8 0 0 0 0 Gyonggi 0 2 1 24 150 108 1 47 2 0 0 0 Gangwon 0 1 0 4 11 8 0 0 0 0 0 0 Chungbuk 0 0 0 4 23 14 0 2 0 0 1 0 Chungnam 0 1 0 13 62 19 0 1 1 0 0 0 Jeonbuk 0 0 0 1 34 22 0 4 0 0 0 0 Jeonnam 0 0 0 3 9 10 2 5 1 0 0 0 Gyeongbuk 0 0 0 2 18 6 4 5 1 0 0 0 Gyeongnam 0 1 0 3 13 9 1 5 1 0 0 0 Jeju 0 0 0 1 1 3 0 0 1 0 0 0
Cum: Cumulative counts from 1st week to current week in a year
* The reported data for year 2017, 2018 are provisional but the data from 2013 to 2016 are finalized data.
† According to surveillance data, the reported cases may include all of the cases such as confirmed, suspected, and asymptomatic carrier in the group. § Cum. 5-year average is mean value calculated by cumulative counts from 1st week to current week for 5 preceding years.
Table 2. (Continued) Reported cases of infectious diseases by geography, week ending February 24, 2018 (8th Week)*
Unit: No. of cases†
Reporting area
Diseases of Category Ⅱ
Measles Mumps Rubella Viral hepatitis B(Acute)
Current week Cum.2018 Cum. 5-year average§ Current week Cum.2018 Cum. 5-year average§ Current week Cum.2018 Cum. 5-year average§ Current week Cum.2018 Cum. 5-year average§ Overall 1 9 3 238 1,844 2,094 3 24 1 6 56 31 Seoul 0 1 1 36 230 203 1 5 0 0 9 5 Busan 0 0 0 19 120 162 0 1 0 0 5 3 Daegu 1 2 0 10 83 59 0 1 0 1 3 0 Incheon 0 0 0 12 100 76 0 1 0 0 3 2 Gwangju 0 0 0 15 63 176 0 0 0 0 1 0 Daejeon 0 1 1 1 64 93 0 1 0 0 1 1 Ulsan 0 0 0 6 69 62 0 0 0 0 2 1 Sejong 0 0 0 4 12 7 0 2 0 0 0 0 Gyonggi 0 4 1 61 465 438 1 4 1 1 11 9 Gangwon 0 0 0 8 65 83 1 3 0 1 2 1 Chungbuk 0 0 0 7 56 36 0 0 0 0 2 1 Chungnam 0 0 0 6 77 73 0 2 0 0 2 1 Jeonbuk 0 0 0 8 65 219 0 2 0 1 1 3 Jeonnam 0 0 0 6 59 114 0 0 0 1 2 1 Gyeongbuk 0 0 0 16 90 73 0 2 0 0 3 1 Gyeongnam 0 1 0 18 191 189 0 0 0 1 9 2 Jeju 0 0 0 5 35 31 0 0 0 0 0 0
Cum: Cumulative counts from 1st week to current week in a year
* The reported data for year 2017, 2018 are provisional but the data from 2013 to 2016 are finalized data.
† According to surveillance data, the reported cases may include all of the cases such as confirmed, suspected, and asymptomatic carrier in the group. § Cum. 5-year average is mean value calculated by cumulative counts from 1st week to current week for 5 preceding years.
Reporting area
Japanese encephalitis Varicella Malaria Scarlet fever¶
Current week Cum.2018 Cum. 5-year average§ Current week Cum.2018 Cum. 5-year average§ Current week Cum.2018 Cum. 5-year average§ Current week Cum.2018 Cum. 5-year average§ Overall 0 0 0 910 10,401 8,073 1 10 10 426 3,358 1,339 Seoul 0 0 0 151 1,439 818 0 3 4 82 521 143 Busan 0 0 0 43 484 559 0 0 0 65 305 104 Daegu 0 0 0 52 561 471 0 0 0 17 107 49 Incheon 0 0 0 45 620 477 0 2 1 20 170 53 Gwangju 0 0 0 44 432 212 0 1 0 18 137 68 Daejeon 0 0 0 11 286 216 0 0 0 5 107 43 Ulsan 0 0 0 40 338 272 0 0 0 25 168 51 Sejong 0 0 0 6 64 43 0 0 0 2 17 2 Gyonggi 0 0 0 189 2,870 2,248 1 3 3 79 839 399 Gangwon 0 0 0 24 268 330 0 0 1 5 57 14 Chungbuk 0 0 0 42 388 156 0 1 1 10 78 23 Chungnam 0 0 0 49 427 366 0 0 0 10 118 64 Jeonbuk 0 0 0 23 344 374 0 0 0 11 139 50 Jeonnam 0 0 0 53 444 375 0 0 0 17 161 50 Gyeongbuk 0 0 0 46 461 328 0 0 0 23 146 90 Gyeongnam 0 0 0 47 585 622 0 0 0 30 246 117 Jeju 0 0 0 45 390 206 0 0 0 7 42 19
Cum: Cumulative counts from 1st week to current week in a year
* The reported data for year 2017, 2018 are provisional but the data from 2013 to 2016 are finalized data.
† According to surveillance data, the reported cases may include all of the cases such as confirmed, suspected, and asymptomatic carrier in the group. § Cum. 5-year average is mean value calculated by cumulative counts from 1st week to current week for 5 preceding years.
Table 2. (Continued) Reported cases of infectious diseases by geography, week ending February 24, 2018 (8th Week)*
Unit: No. of cases†
Reporting area
Diseases of Category Ⅲ
Meningococcal meningitis Legionellosis Vibrio vulnificus sepsis Murine typhus Current week Cum.2018 Cum. 5-year average§ Current week Cum.2018 Cum. 5-year average§ Current week Cum.2018 Cum. 5-year average§ Current week Cum.2018 Cum. 5-year average§ Overall 0 1 1 7 39 9 0 0 0 0 0 0 Seoul 0 0 1 3 11 3 0 0 0 0 0 0 Busan 0 0 0 0 4 1 0 0 0 0 0 0 Daegu 0 0 0 0 1 0 0 0 0 0 0 0 Incheon 0 0 0 1 2 1 0 0 0 0 0 0 Gwangju 0 0 0 0 0 0 0 0 0 0 0 0 Daejeon 0 0 0 1 3 0 0 0 0 0 0 0 Ulsan 0 0 0 0 2 1 0 0 0 0 0 0 Sejong 0 0 0 0 0 0 0 0 0 0 0 0 Gyonggi 0 0 0 2 10 2 0 0 0 0 0 0 Gangwon 0 0 0 0 0 1 0 0 0 0 0 0 Chungbuk 0 0 0 0 1 0 0 0 0 0 0 0 Chungnam 0 1 0 0 0 0 0 0 0 0 0 0 Jeonbuk 0 0 0 0 1 0 0 0 0 0 0 0 Jeonnam 0 0 0 0 0 0 0 0 0 0 0 0 Gyeongbuk 0 0 0 0 3 0 0 0 0 0 0 0 Gyeongnam 0 0 0 0 1 0 0 0 0 0 0 0 Jeju 0 0 0 0 0 0 0 0 0 0 0 0
Cum: Cumulative counts from 1st week to current week in a year
* The reported data for year 2017, 2018 are provisional but the data from 2013 to 2016 are finalized data.
† According to surveillance data, the reported cases may include all of the cases such as confirmed, suspected, and asymptomatic carrier in the group. § Cum. 5-year average is mean value calculated by cumulative counts from 1st week to current week for 5 preceding years.
Reporting area
Scrub typhus Leptospirosis Brucellosis with renal syndromeHemorrhagic fever Current week Cum.2018 Cum. 5-year average§ Current week Cum.2018 Cum. 5-year average§ Current week Cum.2018 Cum. 5-year average§ Current week Cum.2018 Cum. 5-year average§ Overall 13 149 73 0 13 4 4 10 0 2 46 37 Seoul 0 6 3 0 0 0 1 3 0 0 3 2 Busan 0 1 5 0 0 0 0 0 0 0 0 0 Daegu 0 0 1 0 0 0 0 2 0 0 0 0 Incheon 2 6 2 0 0 0 0 1 0 0 1 1 Gwangju 0 1 1 0 0 0 0 0 0 0 0 0 Daejeon 0 1 3 0 0 0 0 0 0 0 0 1 Ulsan 1 6 3 0 0 0 0 0 0 0 0 0 Sejong 0 0 0 0 0 0 0 0 0 0 0 0 Gyonggi 2 8 9 0 1 1 1 1 0 0 8 15 Gangwon 0 1 3 0 0 0 0 0 0 0 2 4 Chungbuk 0 7 0 0 0 0 1 1 0 0 3 2 Chungnam 2 15 4 0 0 0 1 2 0 1 4 1 Jeonbuk 0 8 6 0 0 1 0 0 0 0 1 3 Jeonnam 3 24 14 0 0 1 0 0 0 0 4 2 Gyeongbuk 1 7 4 0 0 0 0 0 0 0 5 4 Gyeongnam 2 53 13 0 12 1 0 0 0 1 15 2 Jeju 0 5 2 0 0 0 0 0 0 0 0 0
Cum: Cumulative counts from 1st week to current week in a year
* The reported data for year 2017, 2018 are provisional but the data from 2013 to 2016 are finalized data.
† According to surveillance data, the reported cases may include all of the cases such as confirmed, suspected, and asymptomatic carrier in the group. § Cum. 5-year average is mean value calculated by cumulative counts from 1st week to current week for 5 preceding years.
Table 2. (Continued) Reported cases of infectious diseases by geography, week ending February 24, 2018 (8th Week)*
Unit: No. of cases†
Reporting area
Diseases of Category Ⅲ Diseases of Category Ⅳ
Syphilis CJD/vCJD Tuberculosis Dengue fever
Current week Cum.2018 Cum. 5-year average§ Current week Cum.2018 Cum. 5-year average§ Current week Cum.2018 Cum. 5-year average§ Current week Cum.2018 Cum. 5-year average§ Overall 39 340 148 2 19 6 652 4,542 4,641 12 32 29 Seoul 12 89 31 0 4 1 105 773 936 4 10 10 Busan 3 18 9 0 0 0 59 336 354 3 6 2 Daegu 1 12 6 1 2 0 33 212 243 0 1 3 Incheon 3 28 12 0 0 0 25 225 248 0 1 1 Gwangju 0 15 4 0 0 1 19 101 125 0 0 0 Daejeon 1 13 4 0 0 0 14 109 117 0 1 1 Ulsan 1 3 2 0 0 0 14 104 88 0 0 0 Sejong 0 0 1 0 0 0 1 23 9 0 0 0 Gyonggi 7 83 40 0 5 2 158 982 962 1 6 7 Gangwon 0 8 5 0 0 0 25 209 184 1 1 0 Chungbuk 0 11 4 0 0 0 21 145 136 2 3 0 Chungnam 3 13 4 0 1 1 35 242 185 1 1 1 Jeonbuk 1 3 4 1 3 0 18 173 177 0 0 1 Jeonnam 3 9 4 0 0 0 38 230 217 0 1 0 Gyeongbuk 2 14 6 0 2 1 43 323 315 0 0 1 Gyeongnam 0 9 8 0 2 0 38 292 294 0 0 2 Jeju 2 12 4 0 0 0 6 63 50 0 1 0
Cum: Cumulative counts from 1st week to current week in a year
* The reported data for year 2017, 2018 are provisional but the data from 2013 to 2016 are finalized data.
† According to surveillance data, the reported cases may include all of the cases such as confirmed, suspected, and asymptomatic carrier in the group. § Cum. 5-year average is mean value calculated by cumulative counts from 1st week to current week for 5 preceding years.
Reporting area
Q fever Lyme Borreliosis SFTS Zika virus infection
Current week Cum.2018 Cum. 5-year average§ Current week Cum.2018 Cum. 5-year average§ Current week Cum.2018 Cum. 3-year average§ Current week Cum.2018 Cum. 3-year average§ Overall 20 62 3 3 17 0 0 0 0 0 0 -Seoul 4 15 0 2 8 0 0 0 0 0 0 -Busan 0 2 0 0 0 0 0 0 0 0 0 -Daegu 0 2 0 0 0 0 0 0 0 0 0 -Incheon 0 1 0 0 0 0 0 0 0 0 0 -Gwangju 1 2 0 0 0 0 0 0 0 0 0 -Daejeon 0 0 0 0 0 0 0 0 0 0 0 -Ulsan 0 3 0 0 2 0 0 0 0 0 0 -Sejong 2 2 0 0 0 0 0 0 0 0 0 -Gyonggi 2 14 0 1 2 0 0 0 0 0 0 -Gangwon 0 0 0 0 1 0 0 0 0 0 0 -Chungbuk 6 8 1 0 1 0 0 0 0 0 0 -Chungnam 3 6 1 0 2 0 0 0 0 0 0 -Jeonbuk 0 0 0 0 0 0 0 0 0 0 0 -Jeonnam 0 0 0 0 0 0 0 0 0 0 0 -Gyeongbuk 0 2 1 0 1 0 0 0 0 0 0 -Gyeongnam 2 5 0 0 0 0 0 0 0 0 0 -Jeju 0 0 0 0 0 0 0 0 0 0 0
-Cum: Cumulative counts from 1st week to current week in a year
* The reported data for year 2017, 2018 are provisional but the data from 2013 to 2016 are finalized data.
† According to surveillance data, the reported cases may include all of the cases such as confirmed, suspected, and asymptomatic carrier in the group. § Cum. 5-year average is mean value calculated by cumulative counts from 1st week to current week for 5 preceding years.
1.2 환자감시 : 표본감시 감염병 주간 발생 현황
(8th week)
1. Influenza, Republic of Korea, weeks ending February 24, 2018 (8th week)
● 2018년도 제8주 인플루엔자 표본감시(전국 200개 표본감시기관) 결과, 의사환자분율은 외래환자 1,000명당 18.8명으로 지난주(30.7명)대비 감소
※ 2017-2018절기 유행기준은 6.6명(/1,000)
Figure 1. Weekly proportion of influenza-like illness per 1,000 outpatients, 2013-2014 to 2017-2018 flu seasons
0 20 10 40 30 60 70 80 90 50 100 36 38 40 42 44 46 48 50 52 2 4 6 8 10 12 14 16 18 20 22 24 26 28 30 32 34 ILI per 1,000 week 2014-2015 2015-2016 2013-2014 2016-2017 2017-2018
2. Hand, Foot and Mouth Disease(HFMD), Republic of Korea, weeks ending February 24, 2018 (8th week)
●2018년도 제8주 수족구병 표본감시(전국 95개 의료기관) 결과, 의사환자 분율은 외래환자 1,000명당 0.3명으로 전주(0.2명) 대비 증가
※ 수족구병은 2009년 6월 법정감염병으로 지정되어 표본감시체계로 운영
Figure 2. Weekly proportion of hand, foot and mouth disease per 1,000 outpatients, 2013-2018
1 3 5 7 9 11 13 2017 2018 2016 2015 2014 2013 15 17 19 21 23 25 27 29 31 33 35 37 39 41 43 45 47 49 51 week 0 10.0 5.0 20.0 15.0 30.0 35.0 40.0 45.0 50.0 25.0 55.0 No. of outpatients / 1,000
Figure 3. Weekly proportion of epidemic keratoconjunctivitis per 1,000 outpatients 0 10 20 30 40 50 60 1 3 5 7 9 11 13 15 17 19 21 23 25 27 29 31 33 35 37 39 41 43 45 47 49 51 53 No. of outpatients / 1,000 week 2018 2017 2016 2015 2014
Figure 4. Weekly proportion of acute hemorrhagic conjunctivitis per 1,000 outpatients
0 1 2 3 4 5 1 3 5 7 9 11 13 15 17 19 21 23 25 27 29 31 33 35 37 39 41 43 45 47 49 51 53 No. of outpatients / 1,000 week 2018 2017 2016 2015 2014
▣ Waterborne and foodborne disease outbreaks, Republic of Korea, weeks ending February 24, 2018 (8th week)
●2018년도 제8주 보고기관(전국 254개 보건소)에서 집단발생이 4건 발생하였으며 누적발생건수는 60건(사례수 520명)이 발생함.
1.3 수인성 및 식품매개 감염병 집단발생 주간 현황 (8th week)
▶ 자세히 보기 : 질병관리본부 → 정책/사업 → 감염병감시 → 표본감시주간소식지
Figure 5. Number of waterborne and foodborne disease outbreaks reported by week, 2017-2018
0 5 15 20 25 30 10 1 3 5 7 9 11 13 15 17 19 21 23 25 27 29 31 33 35 37 39 41 43 45 47 49 51 week
2018 2017 Average no. of cases in last 5 years(2012-2016) 35
No. of outbreaks
Unit: No. of cases/sentinels
Cum: Cumulative counts from 1st week to current week in a year
† According to surveillance data, the reported cases may include all of the cases such as confirmed, suspected, and asymptomatic carrier in the group. § Cum. 5-year average is mean value calculated by cumulative counts from 1st week to current week for 5 preceding years.
※ 문의: (043)719-7118, 7132
4. Sexually Transmitted Diseases
, Republic of Korea, weeks ending February 24, 2018 (8th week)
● 2018년도 제8주 성매개감염병 표본감시기관(전국 보건소 및 의료기관 582개 참여)에서 신고기관 당 클라미디아 감염증 1.8건, 성기단순포진
1.8건, 첨규콘딜롬 1.5건, 임질 1.2건 발생을 신고함.
※ 제8주차 신고의료기관 수 : 임질 13개, 클라미디아 50개, 성기단순포진 44개, 첨규콘딜롬 22개
Gonorrhea Chlamydia Genital herpes Condyloma acuminata
Current week Cum.2018 Cum. 5-year average§ Current week Cum.2018 Cum. 5-year average§ Current week Cum.2018 Cum. 5-year average§ Current week Cum.2018 Cum. 5-year average§ 1.2 2.8 3.4 1.8 7.3 6.2 1.8 9.1 6.9 1.5 5.8 4.2
2. Respiratory viruses, Republic of Korea, Weeks ending February 24, 2018 (8th week)
● 2018년도 제8주 호흡기 검체에 대한 유전자 검사(17개 시·도 보건환경연구원 및 전국 52개 참여의료기관) 결과, 57.2%의 호흡기 바이러스가
검출되었음.
(최근 4주 평균 277개의 호흡기 검체에 대한 유전자 검사결과를 나타내고 있음) ※ 주별통계는 잠정통계이므로 변동가능
- HAdV : human Adenovirus, HPIV : human Parainfluenza virus, HRSV : human Respiratory syncytial virus, IFV : Influenza virus, HCoV : human Coronavirus, HRV : human Rhinovirus, HBoV : human Bocavirus, HMPV : human Metapneumovirus
※ the rate of detected cases between January 28. 2018. – February 24. 2018, (Average No. of detected cases is 277 in last 4 weeks) ∀ 2017 Cum. : the rate of detected cases between January 01. 2017. - December 30. 2017.
▶ 자세히 보기 : 질병관리본부 → 알림 → 주간 질병감시정보
Figure 6. Number of specimens positive for influenza by subtype, 2016-2017 to 2017-2018 flu season
0 100 120 140 160 80 60 40 20 0 20.0 10.0 40.0 30.0 60.0 70.0 80.0 90.0 50.0 100.0 120.0 180 200 No. of positives Percent positives (%) week
A(H3N2) A(not subtyped) A(H1N1)pdm09 B Percent positive
34 36373839404142434445464748495051 521 2 3 4 5 6 7 8 9101112131415161718192021222324252627282930313233 35
2018 (week)
Weekly total Detection rate (%)
No. of samples Detection rate (%) HAdV HPIV HRSV IFV HCoV HRV HBoV HMPV
5 295 72.5 5.1 1.0 3.7 49.5 7.5 3.7 0.7 1.4 6 292 66.4 2.7 1.7 2.4 41.8 9.9 5.8 0.3 1.7 7 231 70.1 1.7 1.3 5.2 43.3 10.8 3.9 0.9 3.0 8 290 57.2 2.8 1.4 4.1 30.7 10.3 4.8 0.0 3.1 Cum.※ 1,108 66.4 3.2 1.4 3.8 41.2 9.6 4.6 0.5 2.3 2017 Cum.∀ 11,915 56.6 3.7 6.3 4.6 10.9 4.4 19.4 2.0 5.3