Peripheral Blood Mononuclear Cells of Patients with
Refractory Epilepsy
Jae-Jun Ban1,2,3., Keun-Hwa Jung1,2,3., Kon Chu1,2,3*, Soon-Tae Lee1,2,3, Daejong Jeon4, Kyung-Il Park5, Hye-Jin Moon1, Hyeyun Kim6, Sunghun Kim7, Sang Kun Lee1,2,3*, Jae-Kyu Roh1,2,3
1 Department of Neurology, Laboratory for Neurotherapeutics, Seoul National University Hospital, Seoul, South Korea, 2 Program in Neuroscience, Neuroscience Research Institute of SNUMRC, Seoul National University, Seoul, South Korea, 3 Comprehensive Epilepsy Center, Seoul National University Hospital, Seoul, South Korea, 4 Department of Bio and Brain Engineering, Korea Advanced Institute of Science and Technology (KAIST), Daejeon, South Korea, 5 Departments of Neurology, Inje University Baik Hospital, Seoul, South Korea,6 Kwandong University Myongji Hospital, Goyang, South Korea, 7 Gangwon National University College of Medicine, Chuncheon, South Korea
Abstract
Background:About one third of patients with epilepsy become refractory to therapy despite receiving adequate medical treatment, possibly from multidrug resistance. P-glycoprotein, encoded by multidrug resistance protein-1 (MDR1) gene, at the blood brain barrier is considered as a major factor mediating drug efflux and contributing to resistance. Given that peripheral blood mononuclear cells (PBMNCs) express MDR1, we investigated a MDR1 status of PBMNCs in various subsets of epilepsy patients and demonstrated their association with clinical characteristics.
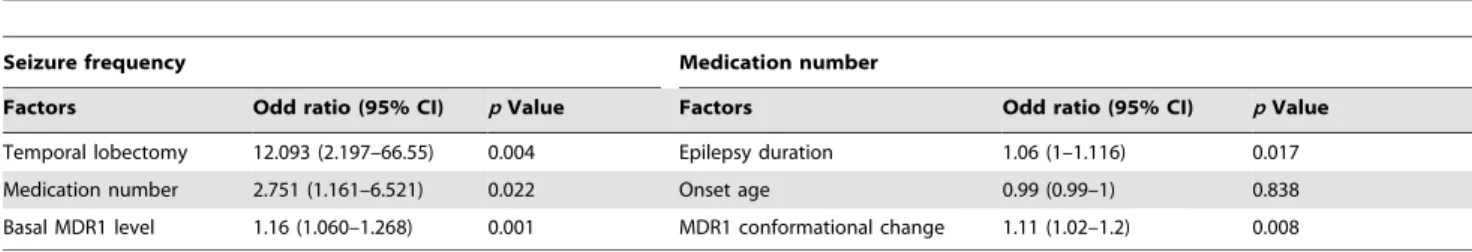
Methodology/Principal Findings: Clinical and MDR1 data were collected from 140 patients with epilepsy, 30 healthy volunteers, and 20 control patients taking anti-epileptic drugs. PBMNCs were isolated, and basal MDR1 levels and MDR1 conformational change levels were measured by flow cytometry. MDR1 profiles were analyzed according to various clinical parameters, including seizure frequency and number of medications used in epilepsy patients. Epilepsy patients had a higher basal MDR1 level than non-epilepsy groups (p,0.01). Among epilepsy patients, there is a tendency for higher seizure frequency group to have higher basal MDR1 level (p = 0.059). The MDR1 conformational change level was significantly higher in the high-medication-use group than the low-use group (p = 0.028). Basal MDR1 (OR = 1.16 [95% CI: 1.060–1.268]) and conformational change level (OR = 1.11 [95% CI: 1.02–1.20]) were independent predictors for seizure frequency and number of medications, respectively.
Conclusions/Significance:The MDR1 profile of PBMNCs is associated with seizure frequency and medication conditions in patients with epilepsy.
Citation: Ban J-J, Jung K-H, Chu K, Lee S-T, Jeon D, et al. (2012) Profiles of Multidrug Resistance Protein-1 in the Peripheral Blood Mononuclear Cells of Patients with Refractory Epilepsy. PLoS ONE 7(5): e36985. doi:10.1371/journal.pone.0036985
Editor: Christopher P. Hess, University of California San Francisco, United States of America Received December 5, 2011; Accepted April 11, 2012; Published May 14, 2012
Copyright: ß 2012 Ban et al. This is an open-access article distributed under the terms of the Creative Commons Attribution License, which permits unrestricted use, distribution, and reproduction in any medium, provided the original author and source are credited.
Funding: This study was supported by the Ministry of Health and Welfare, Republic of Korea (A090538). The funders had no role in study design, data collection and analysis, decision to publish, or preparation of the manuscript.
Competing Interests: The authors have declared that no competing interests exist. * E-mail: sangkun2923@gmail.com (SKL); stemcell.snu@gmail.com (KC)
.These authors contributed equally to this work.
Introduction
Almost one-third of patients with epilepsy cannot achieve seizure freedom and have a poor prognosis despite receiving adequate medical treatment and the administration of multiple anti-epileptic drugs (AEDs) [1]. Although the mechanism of this refractoriness remains unclear, the prediction of medically refractory epilepsy is an important concern of current epilepsy research.
Multidrug resistance protein-1 (MDR1), multidrug resistance-related proteins and breast cancer resistance proteins comprise members of the multidrug resistance protein family. MDR1, first known as a drug-resistance protein in tumor cells [2], is a 170- to 180-kDa membrane protein. MDR1 mediates ATP-dependent
drug efflux for various xenobiotics and drugs [3,4]._ENREF_2 The apical membranes of capillary endothelial cells of the blood-brain barrier express MDR1, which contributes to drug efflux from the brain to the systemic circulation. Despite the protective role of transporter proteins, AED penetration to the brain is compromised by MDR1 [5–7]. For intractable patients with epilepsy, drug resistance is likely caused by a high level of MDR1 in the brain endothelium [8–10].
Recent studies suggest that molecular profile of peripheral blood mononuclear cells (PBMNCs) could be used as biopsy material to reflect physiological condition of the body and a possible marker for predicting the treatment outcome of various diseases [11–17]. Given that human peripheral blood cells also express MDR1 proteins and play a role in brain endothelial cell turnover [18], we
hypothesized that the MDR1 profile of these cells might be related to drug resistance of epilepsy.
In this study, we examined epilepsy patients, healthy volunteers, and non-epilepsy patients taking AEDs. We also divided refractory epilepsy patients according to their seizure frequency and the number of medications required to control their seizures, which could be regarded as criteria of refractoriness of epilepsy [1,19]. For MDR1 status, we examined basal MDR1 level and conformational change level of PBMNCs by flow cytometry. Both the basal MDR1 level and conformational change level were measured using the UIC2 antibody, which binds to the MDR1 protein and has high affinity to the activated ATP-hydrolyzing form of MDR1 in the presence of substrate [20,21]. The enhanced affinity of this antibody allows for detection of cells with relatively low MDR1 expression. The basal MDR1 level, which was analyzed by a conventional flow cytometry after staining unstimulated PBMNCs, reflects the number of cells expressing high level of MDR1 protein. The MDR1 conformational change level measured in vinblastine-treated PBMNCs, which have activated MDR1, reflects the number of all cells with functional MDR1 which has the ability of actual pumping action in peripheral blood [22,23]. Several clinical parameters were assessed in association with the categorized MDR1 data.
Materials and Methods Ethics Statement
The study protocol was approved by the Scientific Review Committee and the Institutional Review Board of Seoul National University Hospital, and all enrolled subjects provided written informed consent as required by the Declaration of Helsinki.
Study Population
We studied 117 refractory and 23 seizure-free epilepsy patients who were diagnosed with temporal lobe epilepsy, and 20 control patients taking AEDs. The seizure-free epilepsy patients didn’t experience seizure for at least one year. The control with AEDs consisted of non-epilepsy patients taking AEDs because of neuropathic pain, headache and etc. The patients underwent medical follow-up at the Department of Neurology, Seoul National University Hospital, from February 2008 to December 2010. Thirty healthy volunteers were recruited for the control group. A questionnaire was developed by the authors to evaluate the patients’ demographic data and medical histories.
PBMNC Preparation and Flow-cytometric Analysis
Materials for the flow cytometry staining including MDR1 antibody (UIC2 antibody), dimethyl sulfoxide (DMSO), vinblas-tine, working solutions, and binding buffers were all included in the MDR1 shift assay kit (Chemicon International, Temecula, CA, USA). Peripheral blood samples (5cc) were obtained from all enrolled subjects. The heparinized blood samples were added to Histopaque (Sigma-Aldrich, St. Louis, MO, USA) and centrifuged at 400 6g for 30 min to separate the PBMNCs. Isolated cells were counted and centrifuged at 200 6g for 5 min. The supernatant was removed, and the pellets were resuspended to 16106cells/mL in warmed UIC2 binding buffer (1% bovine serum albumin in PBS). Basal MDR1 level assay procedure is as follows: cells were divided into two groups and treated with 5mL of DMSO respectively. The tubes were incubated at 37uC for 10 min; 25mL of the kit’s IgG2a antibody working solution was added to one group and 25mL of UIC2 antibody working solution was added to the other group. The tubes were incubated at 37uC for another 15 min and washed three times with cold UIC2 binding
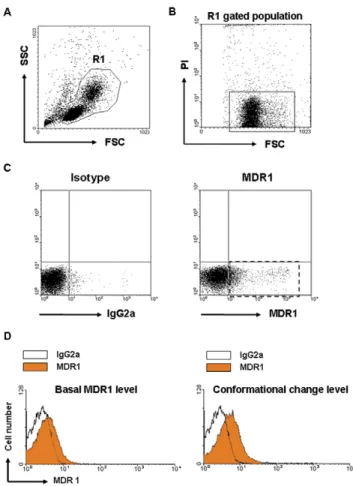
buffer at 2006g for 10 min at 4uC. The cells were resuspended in 250mL ice-cold secondary antibody working solution and incubated for 15 min at 4uC in the dark. After being washed three times, the cells were resuspended in 0.5 mL ice-cold propidium iodide staining buffer. Samples were then maintained on ice until analysis with a flow cytometer (FACSCalibur, BD Biosciences, San Jose, CA, USA), using FL2 channel for indirect UIC2 staining and FL3 channel for propidium iodide to exclude dead cells. To filter out cell debris, forward scatter and side scatter of the cells were measured and lymphocytes and monocytes regions were gated (Fig. 1A). After gating cell populations, propidium iodide negative cells were gated to wipe out dead cells (Fig. 1B). Using this cell population, baseline for gating positive population was confirmed using IgG2a isotype. UIC2 positive populations were gated using this baseline and positive cell number was counted using FL2 channel (Fig. 1C). Positive level was calculated as a percentage of UIC2 positive cell number in whole live cell population. For MDR1 conformational change level assay, we used 5mL of 22 mM vinblastine instead of DMSO and rest of the process is identical to basal MDR1 level. UIC2 antibody reacts with membrane bound MDR1 and their reactivity
Figure 1. Analysis of MDR1 profiles of PBMNCs with the flow cytometry. (A) PBMNCs were stained with MDR1 antibody and propidium iodide (PI) and examined forward scatter (FSC) and side scatter (SSC) and leukocytes were gated (R1) to exclude aggregates and debris. (B) In R1 gated population, PI positive dead cells were excluded and PI negative live cells were gated (lined box). (C) In gated cells, the MDR1-positive population was assessed using the baseline determined from a negative control of IgG2a background staining (dotted box). (D) Representative histogram figures show the basal MDR1 level (left) and conformational change level (right).
is increased when conformational change of MDR1 occurs. The basal MDR1 level reflects the number of cells expressing high level of MDR1 and the conformational change level reflects all functional MDR1 level in PBMNCs [22,23].
Statistical Analysis
Data were analyzed using SPSS version 17.0 (SPSS Inc., Chicago, IL, USA). Student’s t-test or analysis of variance with subsequent Tukey’s b-test for MDR1 conformational change level, Mann-whitheny U test or Kruskal-Wallis test for basal MDR1 level were used to compare mean values for continuous variables, and the chi-squared test was used for categorical variables. We classified refractory epilepsy patients in terms of seizure frequency. The low-frequency group had fewer than one seizure per week (n = 69, 59%) and the high-frequency group had one or more seizures per week (n = 48, 41%). We also classified the patients into those taking three or more medications (n = 63, 54%) and those
taking fewer than three (n = 54, 46%). To identify factors helping to predict high seizure frequency and medication number, multiple logistic regression analysis was performed with significant variables defined from the initial univariate analysis, and statistical significance was set at p,0.05.
Results
Patient Characteristics
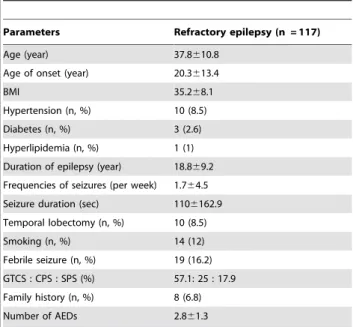
The study was carried out in 190 subjects, including 117 refractory epilepsy patients, 23 seizure-free epilepsy patients, 30 healthy volunteers, and 20 control patients taking AEDs. The baseline characteristics of the refractory epilepsy patients are summarized in Table 1. Characteristics, including age, number of AEDs and type of AEDs, of control groups are represented in Table 2.
MDR1 Profiles Among Patients
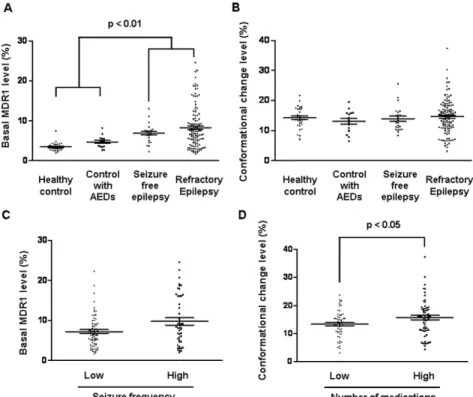
The basal MDR1 and conformational change level of MDR1 in the PBMNCs were analyzed using flow cytometry. Representative superimposed histograms of basal MDR1 level and conformation-al change level are presented (Fig. 1D). Kruskconformation-al-Wconformation-allis test confirmed significant differences in the basal MDR1 levels among groups (p,0.01). Patients with epilepsy had higher basal MDR1 levels than the healthy volunteers and control patients taking AEDs (p,0.01; Fig. 2A). The conformational change level was not significantly different among groups (Fig. 2B).
MDR1 Profiles According to Seizure Frequency
We classified refractory patients into high- and low-seizure-frequency groups (Table 3). The high-low-seizure-frequency group took more medications (3.261.4 vs. 2.661.7, p = 0.015) than the low-frequency group. The high-low-frequency group tended to have a higher basal MDR1 level (9.766.2% vs. 7.264.0%, p = 0.059) (Fig. 2C). Moreover, independent associations with seizure frequency were noted for basal MDR1 level (p = 0.001), number of medications (p = 0.022), and a history of temporal lobectomy (p = 0.004). The odds ratio of the basal MDR1 level for seizure frequency was 1.160 (95% CI, 1.060–1.268) after adjustment (Table 4).
MDR1 Profiles According to AED Intake
To evaluate the association between the MDR1 profile and drug resistance, we categorized patients into high- and low-Table 1. Refractory epilepsy patient demographics.
Parameters Refractory epilepsy (n = 117) Age (year) 37.8610.8
Age of onset (year) 20.3613.4
BMI 35.268.1
Hypertension (n, %) 10 (8.5) Diabetes (n, %) 3 (2.6) Hyperlipidemia (n, %) 1 (1) Duration of epilepsy (year) 18.869.2 Frequencies of seizures (per week) 1.764.5 Seizure duration (sec) 1106162.9 Temporal lobectomy (n, %) 10 (8.5) Smoking (n, %) 14 (12) Febrile seizure (n, %) 19 (16.2) GTCS : CPS : SPS (%) 57.1: 25 : 17.9 Family history (n, %) 8 (6.8) Number of AEDs 2.861.3
GTCS = generalized tonic-clonic seizure; CPS = complex partial seizure; SPS = simple partial seizure.
doi:10.1371/journal.pone.0036985.t001
Table 2. Control groups characteristics.
Parameters Healthy control Non-epilepsy with AEDs Seizure-free epilepsy
(n = 30) (n = 20) (n = 23)
Age (year) 37.8610.8 49.9613.6 32.3610.7
Number of AEDs 0 1.160.3 1.360.4
Type of AEDs (n) – VPA(15), PRE(2), VPA(3), CBZ(2), OCZ(5), TPM(1), VPA+PRE(2) LEV(1), TPM(2), LTG(2),
CBZ+LTG(1), CBZ+LEV(1), LEV+LTG(1), CBZ+CLO(1), TPM+CLO(1), DPH+PB(1), LEV+TPM(1), CBZ+TPM(1)
VPA = valproate; CBZ = carbamazepine; OCZ = oxcarbazepine; LEV = levetiracetam; TPM = topiramate; LTG = lamotrigine; CLO = clobazam; PB = phenobarbital; PRE = pregabalin.
medication-use groups. All variables and statistical data are shown in Table 5. The high-medication group had a younger age of onset and a longer duration of epilepsy (17.6613.2 vs. 23.3613.1 years, p = 0.02; 20.6610.8 vs. 13.5610 years, p,0.05) (Fig. 2D). The mean seizure frequency tended to be higher in the high-medication group, but it was not significant. In terms of MDR1 status, we found a higher conformational change level in the high-medication group than in the low-high-medication group (p = 0.028), whereas basal MDR1 level was not significantly different between these groups. Multiple logistic regression analysis indicated that the duration of epilepsy and the conformational change level were significant independent predictors of the number of AEDs taken (Table 4). The odds ratio of conformational change level of MDR1 for medication number was 1.11 (95% CI, 1.02–1.20).
Discussion
We assayed the MDR1 profile of PBMNCs in epilepsy patients by flow cytometry. We categorized 117 patients with refractory epilepsy according to seizure frequency and the number of medications taken. These two parameters could be regarded as criteria for the severity of refractoriness [19,24]. Basal MDR1 level and conformational change level were higher in the high-seizure frequency group and high-medication group, respectively. Multi-ple logistic regression analysis revealed these as independently related factors.
Our results suggested that the basal MDR1 level was higher in epilepsy patients compared with healthy volunteers and non-epilepsy patients taking AEDs. The AEDs were administered to non-epilepsy patients for treatment of migraine, neuropathic pain, and etc. The regimens included valproic acid, topiramate or pregabalin, and their dosage ranges were much lower than those
Figure 2. MDR1 profiles among groups and refractory epilepsy patients. Graphs represent (A) basal MDR1 level and (B) conformational change level among the groups. Graphs represent (C) basal MDR1 level between low- and high-seizure-frequency groups and (D) conformational change level between low- and high-medication-use groups in the refractory epilepsy patients. The horizontal lines represent the median level and standard error of the mean.
doi:10.1371/journal.pone.0036985.g002
Table 3. Correlation between seizure frequency and clinical parameters.
Seizure frequency
Parameters Low (n = 69) High (n = 48) p Value Frequency of seizure
(per week)
0.160.2 466.5 ,0.001 Age (year) 38611 37.5610.7 0.817 Age of onset (year) 20.8613.2 19.5613.7 0.632 Duration of epilepsy (year) 17611.8 17.7610 0.752 Number of AEDs 2.661.2 3.261.4 0.015* Seizure duration (sec) 118.86172.0 98.66150.4 0.515
BMI 35.867.6 34.368.9 0.323 Hypertension: n (%) 5 (7.2) 5 (10.4) 0.738 Diabetes: n (%) 0 (0) 3 (6.3) 0.066 Hyperlipidemia: n (%) 0 (0) 1 (2.1) 0.410 Smoking: n (%) 7 (10.1) 7 (14.6) 0.467 Temporal lobectomy: n (%) 3 (4.3) 7 (14.6) 0.089 Febrile seizure: n (%) 16 (23.2) 3 (6.3) 0.015* Family history: n (%) 4 (5.8) 4 (8.3) 0.715 Semiology: (GTCS: CPS: SPS,%) 58.2: 23.9: 17.9 55.6: 26.7: 17.8 0.943 Basal MDR1 level (%) 7.264.0 9.766.2 0.009** Conformational change level (%) 14.265.2 14.966.0 0.512
BMI = body mass index. *p,0.05,
**p,0.01.
in the refractory epilepsy patients. The lower dosage range and different type of anticonvulsants could influence lower MDR1 level of PBMNCs in non-epilepsy with AEDs than epilepsy with AEDs. However, we found no significant difference according to the types of AEDs among epilepsy patients. In this study, the high-seizure-frequency group also took more medications. This group experienced recurrent seizures despite adequate administration of multiple AEDs. Although these drugs control seizures initially, drug resistance may gradually emerge from the overexpression of MDR1, leading to refractory epilepsy [25]. Our result shows that the patients who experience more seizure tend to have more cells expressing high level of MDR1 in peripheral blood. In addition to categorizing patients according to seizure frequency, we examined high- and low-medication groups. The use of more medications
indicates an insufficient treatment outcome from a single major AED. This result suggests that the high-medication patients have more cells having functional MDR1 in PBMNCs than low-medication patients.
Our findings suggest that MDR1 profile of PBMNCs is associated with seizure severity and medication conditions in underlying refractory epilepsy patients. The mechanism of these differences remains elucidated. There have been no animal experiments for investigating peripheral MDR1 status in epilepsy. We speculate that prolonged exposure of multiple AEDs could influence individual variations of MDR1 level, since several of these drugs are believed to be substrate or inducer of MDR1 [26,27]. We classified drugs as well-known MDR1 substrate (phenobarbital, oxcarbazepine and lamotrigine) and non-substrate and analyzed the data. But we couldn’t obtain meaningful differences among drugs in epilepsy patients. Since there are many other variables such as duration of administration of each drug, and controversies about AEDs as MDR1 substrates, further research is needed to confirm this concept. It is also possible that the epilepsy influences profile of population of peripheral blood cells. A severe degree of seizures impair brain cells and this condition can influence some kind of circulating stem cells [18,28], and alternately, a subset of PBMNCs, i.e., endothelial progenitor cells might involve endothelial cell turnover in the brain of epilepsy patients.
The present findings seem to be consistent with other researches, which indicate MDR1 status is related to refractoriness in epilepsy patient. Ideally, we should investigate the MDR1 status of epilepsy patients in vivo, for example, by using positron emission tomography with radiolabeled AEDs [29,30]. However, this is costly and time consuming, whereas the MDR1 status of PBMNCs is easily analyzed in one day in the laboratory. Although our study is hampered by study population heterogeneity and low sample size, our approach is the first attempt to seek a potential blood marker associated with a variety of epilepsy phenotypes. We provide novel evidence that the MDR status in PBMNCs can reflect epilepsy phenotype, and it is potentially altered by refractory itself or long term AED medication. A prospective longitudinal study is needed to confirm the predictive value of MDR1 level.
Author Contributions
Conceived and designed the experiments: KHJ KC SKL JKR. Performed the experiments: JJB HJM SHK HYK. Analyzed the data: KHJ JJB STL DJJ KIP. Contributed reagents/materials/analysis tools: KC SKL JKR. Wrote the paper: KHJ JJB.
Table 4. Multiple logistic regression analysis of factors for the seizure frequency and medication number.
Seizure frequency Medication number
Factors Odd ratio (95% CI) p Value Factors Odd ratio (95% CI) p Value Temporal lobectomy 12.093 (2.197–66.55) 0.004 Epilepsy duration 1.06 (1–1.116) 0.017 Medication number 2.751 (1.161–6.521) 0.022 Onset age 0.99 (0.99–1) 0.838 Basal MDR1 level 1.16 (1.060–1.268) 0.001 MDR1 conformational change 1.11 (1.02–1.2) 0.008 CI = Confidence interval.
doi:10.1371/journal.pone.0036985.t004
Table 5. Correlation between medication number and clinical parameters.
Medication number
Parameters Low (n = 54) High (n = 63) p Value Number of AEDs 1.660.4 3.960.9 ,0.001 Age (year) 37.4611.6 38.2610.2 0.174 Age of onset (year) 23.3613.1 17.6613.2 0.020* Duration of epilepsy (year) 13.5610.1 20.6610.8 ,0.001** Frequency of seizure
(per week)
1.262.7 2.265.7 0.246 Seizure duration (sec) 146.46200.1 78.96114.5 0.033*
BMI 34.867.7 35.568.5 0.650 Hypertension: n (%) 3 (5.6) 7 (11.1) 0.337 Diabetes: n (%) 1 (1.9) 2 (3.2) 1 Hyperlipidemia: n (%) 0 (0) 1 (1.6) 1 Smoking: n (%) 6 (11.1) 8 (12.7) 0.792 Temporal lobectomy: n (%) 4 (7.4) 6 (9.5) 0.751 Febrile seizure: n (%) 7 (13) 12 (19) 0.374 Family history: n (%) 4 (7.4) 4 (6.3) 1 Semiology: (GTCS: CPS: SPS,%) 58.5:22.6:18.9 55.9:27.1:16.9 0.855 Basal MDR1 level (%) 8.565.1 8.065.2 0.634 Conformational change level (%) 13.364.6 15.766.3 0.028* *p,0.05, **p,0.01. doi:10.1371/journal.pone.0036985.t005
References
1. Callaghan BC, Anand K, Hesdorffer D, Hauser WA, French JA (2007) Likelihood of seizure remission in an adult population with refractory epilepsy. Ann Neurol 62: 382–389.
2. Gros P, Ben Neriah YB, Croop JM, Housman DE (1986) Isolation and expression of a complementary DNA that confers multidrug resistance. Nature 323: 728–731.
3. Fromm MF (2004) Importance of P-glycoprotein at blood-tissue barriers. Trends Pharmacol Sci 25: 423–429.
4. Schinkel AH, Jonker JW (2003) Mammalian drug efflux transporters of the ATP binding cassette (ABC) family: an overview. Adv Drug Deliv Rev 55: 3–29. 5. Loscher W, Potschka H (2005) Role of drug efflux transporters in the brain for
drug disposition and treatment of brain diseases. Prog Neurobiol 76: 22–76. 6. Robey RW, Lazarowski A, Bates SE (2008) P-glycoprotein–a clinical target in
drug-refractory epilepsy? Mol Pharmacol 73: 1343–1346.
7. Zimprich F, Sunder-Plassmann R, Stogmann E, Gleiss A, Dal-Bianco A, et al. (2004) Association of an ABCB1 gene haplotype with pharmacoresistance in temporal lobe epilepsy. Neurology 63: 1087–1089.
8. Dombrowski SM, Desai SY, Marroni M, Cucullo L, Goodrich K, et al. (2001) Overexpression of multiple drug resistance genes in endothelial cells from patients with refractory epilepsy. Epilepsia 42: 1501–1506.
9. Lazarowski A, Czornyj L, Lubienieki F, Girardi E, Vazquez S, et al. (2007) ABC transporters during epilepsy and mechanisms underlying multidrug resistance in refractory epilepsy. Epilepsia 48 Suppl 5: 140–149.
10. Tishler DM, Weinberg KI, Hinton DR, Barbaro N, Annett GM, et al. (1995) MDR1 gene expression in brain of patients with medically intractable epilepsy. Epilepsia 36: 1–6.
11. Diaz-Borjon A, Richaud-Patin Y, Alvarado de la Barrera C, Jakez-Ocampo J, Ruiz-Arguelles A, et al. (2000) Multidrug resistance-1 (MDR-1) in rheumatic autoimmune disorders. Part II: Increased P-glycoprotein activity in lymphocytes from systemic lupus erythematosus patients might affect steroid requirements for disease control. Joint Bone Spine 67: 40–48.
12. Grude P, Boleslawski E, Conti F, Chouzenoux S, Calmus Y (2002) MDR1 gene expression in peripheral blood mononuclear cells after liver transplantation. Transplantation 73: 1824–1828.
13. Senent L, Jarque I, Martin G, Sempere A, Gonzalez-Garcia Y, et al. (1998) P-glycoprotein expression and prognostic value in acute myeloid leukemia. Haematologica 83: 783–787.
14. Tsujimura S, Saito K, Nakayamada S, Tanaka Y (2007) Relevance of multidrug resistance 1 and P-glycoprotein to drug resistance in patients with systemic lupus erythematosus. Histol Histopathol 22: 465–468.
15. Mohr S, Liew CC (2007) The peripheral-blood transcriptome: new insights into disease and risk assessment. Trends Mol Med 13: 422–432.
16. Turriziani O, Gianotti N, Falasca F, Boni A, Vestri AR, et al. (2008) Expression levels of MDR1, MRP1, MRP4, and MRP5 in peripheral blood mononuclear
cells from HIV infected patients failing antiretroviral therapy. J Med Virol 80: 766–771.
17. Karsten SL, Kudo LC, Bragin AJ (2011) Use of peripheral blood transcriptome biomarkers for epilepsy prediction. Neurosci Lett 497: 213–217.
18. Hill JM, Zalos G, Halcox JP, Schenke WH, Waclawiw MA, et al. (2003) Circulating endothelial progenitor cells, vascular function, and cardiovascular risk. N Engl J Med 348: 593–600.
19. Beleza P (2009) Refractory epilepsy: a clinically oriented review. Eur Neurol 62: 65–71.
20. Collnot EM, Baldes C, Schaefer UF, Edgar KJ, Wempe MF, et al. (2010) Vitamin E TPGS P-glycoprotein inhibition mechanism: influence on confor-mational flexibility, intracellular ATP levels, and role of time and site of access. Mol Pharm 7: 642–651.
21. Mechetner EB, Schott B, Morse BS, Stein WD, Druley T, et al. (1997) P-glycoprotein function involves conformational transitions detectable by differ-ential immunoreactivity. Proc Natl Acad Sci U S A 94: 12908–12913. 22. Druley TE, Stein WD, Ruth A, Roninson IB (2001) P-glycoprotein-mediated
colchicine resistance in different cell lines correlates with the effects of colchicine on P-glycoprotein conformation. Biochemistry 40: 4323–4331.
23. Vilas-Boas V, Silva R, Gaio AR, Martins AM, Lima SC, et al. (2011) P-glycoprotein activity in human Caucasian male lymphocytes does not follow its increased expression during aging. Cytometry A 79: 912–919.
24. Kwan P, Arzimanoglou A, Berg AT, Brodie MJ, Hauser WA, et al. (2009) Definition of drug resistant epilepsy: Consensus proposal by the ad hoc Task Force of the ILAE Commission on Therapeutic Strategies. Epilepsia 51. 25. van Vliet EA, Edelbroek PM, Gorter JA (2010) Improved seizure control by
alternating therapy of levetiracetam and valproate in epileptic rats. Epilepsia 51: 362–370.
26. Luna-Tortos C, Fedrowitz M, Loscher W (2008) Several major antiepileptic drugs are substrates for human P-glycoprotein. Neuropharmacology 55: 1364–1375.
27. Zhang C, Kwan P, Zuo Z, Baum L (2011) The transport of antiepileptic drugs by P-glycoprotein. Adv Drug Deliv Rev.
28. Parfenova H, Leffler CW, Tcheranova D, Basuroy S, Zimmermann A (2010) Epileptic seizures increase circulating endothelial cells in peripheral blood as early indicators of cerebral vascular damage. Am J Physiol Heart Circ Physiol 298: H1687–1698.
29. Langer O, Bauer M, Hammers A, Karch R, Pataraia E, et al. (2007) Pharmacoresistance in epilepsy: a pilot PET study with the P-glycoprotein substrate R-[(11)C]verapamil. Epilepsia 48: 1774–1784.
30. Lubberink M, Luurtsema G, van Berckel BN, Boellaard R, Toornvliet R, et al. (2007) Evaluation of tracer kinetic models for quantification of P-glycoprotein function using (R)-[11C]verapamil and PET. J Cereb Blood Flow Metab 27: 424–433.