T
HE
I
NFLUENCES OF
S
WIRL
F
LOW ON
F
RACTIONAL
F
LOW
R
ESERVE
IN
M
ILD/
M
ODERATE/
S
EVERE
S
TENOTIC
C
ORONARY
A
RTERIAL
M
ODELS
Kyung Eun Lee, Gook Tae Kim, Ah-Jin Ryu and Eun Bo Shim*
Department of Mechanical and Biomedical Engineering, Kangwon National University
관상동맥 내의 나선형 유동이 협착도에 따라
분획 혈류 예비능에 미치는 영향에 관한 수치해석
이 경 은, 김 국 태, 류 아 진, 심 은 보*
강원대학교 기계의용공학과
Swirl flow is often found in proximal coronary arteries, because the aortic valves can induce swirl flows in the coronary artery due to vortex formation. In addition, the curvature and tortuosity of arterial configurations can also produce swirl flows. The present study was performed to investigate fractional flow reserve alterations in a post-stenotic distal part due to the presence of pre-stenotic swirl flow by computational fluid dynamics analysis for virtual stenotic models by quantifying fractional flow reserve(FFR). Simplified stenotic coronary models were divided into those with and without pre-stenotic swirl flow. Various degrees of virtual stenosis were grouped into three grades: mild, moderate, and severe, with degree of stenosis of 0 ~ 40%, 50 ~ 60%, and 70 ~ 90%, respectively. In this study, three-dimensional computational hemodynamic simulations were performed under hyperemic conditions in virtual stenotic coronary models by coupling with a zero-dimensional lumped parameter model. The results showed that the influence of pre-stenotic swirl inflow is dominant on FFR alteration in mild stenosis, whereas stenosis is dominant on FFR alteration in moderate/severe stenosis. The decrease in FFR caused by swirl flow is more significant in mild stenosis than moderate/severe stenosis. Biomechanical modeling is useful for clinicians to provide insight for medical intervention strategies. This hemodynamic-based parameter study could play a critical role in the development of a non-invasive imaging-based strategy-support system for percutaneous transluminal angioplasty in cases of mild/moderate stenosis.
Key Words : Swirling Flow(나선형 유동), Helix(나선형), Fractional Flow Reserve(혈류 분획 예비능), Stenosis(협착),
Coronary Artery(관상동맥)
Received: January 5, 2017, Revised: March 15, 2017, Accepted: March 15, 2017.
* Corresponding author, E-mail: ebshim@kangwon.ac.kr DOI http://dx.doi.org/10.6112/kscfe.2017.22.1.015 Ⓒ KSCFE 2017
1. Introduction
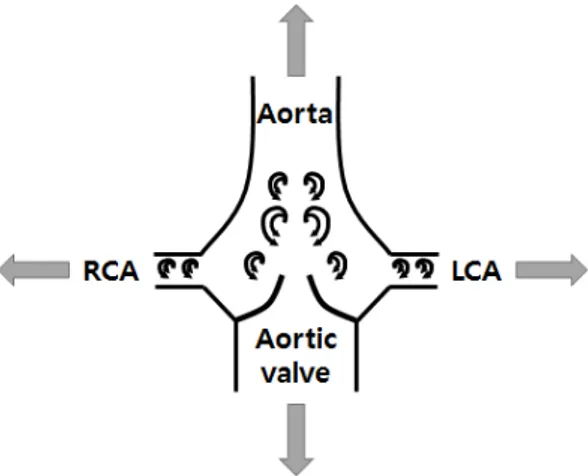
Swirling or helical flow is frequently observed in the coronary artery as well as several sites of the vascular system[1-4]. The aortic valve can induce swirling flow with vortex motions in the coronary artery, as shown in Fig. 1[4-9]. In addition, the curvature and tortuosity of
arterial configurations can also produce swirling flow, as shown in Fig. 2. Spiral flow patterns were reported in the ascending aorta in 29% and 84% of subjects at systole and diastole, respectively[6]. Accordingly, many groups have investigated the influences of swirl flows on downstream flow fields, mainly on velocity patterns and wall shear stress distributions[10-16]. These studies indicated that the common swirl/helical flow promotes blood flow transport, mass transport, mixing phenomena, and helically twisted ribbon-shaped distributions of both pressure and wall shear stress distributions.
Previously, it was considered more important to investigate the relationship between velocity and pressure
Fig. 1 Schematic diagram of longitudinal aortic root model geometry
gradient via Navier-Stokes analysis with a free traction boundary. However, the fractional flow reserve(FFR), defined as the ratio of coronary distal pressure to aortic pressure during cardiac cycle, has recently become accepted as the gold standard to evaluate stenosis severity. 0.8 of FFR is cut-off to divide into healthy people and sick people. Therefore, many groups have focused on the pressure ratio to obtain FFR value. However, few studies have evaluated the influence of swirl flows on pressure-based distributions in post-stenotic regions[16-18]. In a previous study of flow phenomena in a stenotic model with swirl flow, the swirl flow from the aortic valve was shown to induce a more marked drop in pressure than aortic stenosis[17]. Sung et al.[16] reported that the flow is affected by rotation and stenosis at same time, although only 50% stenosis models were considered suitable to elucidate the effects of rotating flow. Still, the roles of swirl flow in FFR distributions in various stenotic models remain unclear.
Here, we present clinically significant FFR associated with pressure and velocity-related mechanical factors. This study was performed to investigate how the presence of pre-stenotic swirl flow influences the post-stenotic local FFR alteration. In particular, we focus on investigating quantitative as well as qualitative characteristics of the effects of swirl flow on the FFR in various mild/ moderate/severe stenotic models using a physiologically more correct zero-dimensional(0-D)- three-dimensional(3-D) coronary circulation simulation. This multi-scale model couples a 3-D coronary artery model of computational fluid dynamics with a 0-D lumped parameter model, including coronary capillary and venous systems[19].
(a) (b)
Fig. 2 (a) Curved and twisted vascular geometry on angiography (b) Corresponding geometry reconstructed from computed tomography
2. Methodology
2.1 Numerical Model
The pre-stenotic helical model was inspired to produce swirling flow induced by aortic valve and by curved and tortuous artery morphology in Fig. 1 and Fig. 2. The simplified stenotic coronary models were divided into two groups: those with and those without pre-stenotic swirl flow. Fig. 3 shows the schematic diagram of stenotic arterial geometries in the absence(Fig. 3(a)) and presence (Fig. 3(b)) of pre-stenotic swirl flow produced through a low-amplitude helical geometry on side perspectives. Fig. 3(c) and Fig. 3(d) shows a front view of helical geometry defined by the radius of the helix , radius of the
cross-section of a circular tube , and radius of the
cross-section of the stenosis throat .
The total length of the stenotic model is 74 mm; the diameter (D) = 3 mm in Fig. 3(a) and Fig. 3(b). The length of pre-stenotic upstream() and post-stenotic downstream() are 18 mm(6D) and 50 mm, respectively. In addition, the length of the stenotic region (diameter : 2D) consists of the upstream stenosis throat () of diameter 1D and downstream stenosis throat () of diameter 1D in Fig. 3(a). Fig. 3(b) shows a
side view of stenotic arterial geometry with pre-stenotic swirl flow produced through a low-amplitude helical geometry. The helical region was characterized by an amplitude of 0.125, a pitch ratio of 4, a dimensionless curvature of 0.5, and a dimensionless torsion of 3 in Eq. (1), (2)[10,14,20]. Orthogonal views of a helically sinuous tube part and a stenotic part are shown in Fig. 3(c) and Fig. 3(d), respectively. In the stenotic part, various degrees of luminal stenosis were produced. In the
Fig. 3 Schematic diagram of stenotic arterial geometries in the absence (a) and presence (b) of pre-stenotic helical swirling flow produced through a low-amplitude helical geometry on side perspectives (c) Front view of helical geometry where and are the radii of the helix and the tube cross-section, respectively (d) Front view of the stenotic tube where and are the radii of the tube and the stenosis throat, respectively
literature, the extent of lipid growth with various degrees of stenosis was divided as follows: 0%, normal conditions; 1 ~ 49%, mild stenosis(Grades 1 and 2); 50 ~ 69%, moderate stenosis(Grade3); 70 ~ 99%, severe stenosis(Grades 4 and 5); and 100%, total occlusion [21,22]. In the present study, virtual mild, moderate, and severe grades of stenosis were defined as degree of stenosis (SD) = 0 ~ 40%, 50 ~ 60%, and 70 ~ 90%, respectively, by reducing Rs in Fig. 3(d). The SD% based
on radius or diameter is defined as SD = (2Rc - 2Rs) /
2Rc x 100%, where is the radius of virtual stenosis
throat and is the radius of circular tube without stenosis in Fig. 3(d). The shape of axisymmetric stenosis in a stenotic model is produced virtually using the following cosine curve ×
where ≤ ≤ in Fig. 3(a) and Fig. 3(b)[23]. A triangular prismatic boundary layer mesh was generated close to the vascular wall and 3-D tetrahedral
Physiological variables Values
SBP(mmHg) 120
DBP(mmHg) 80
HR(bpm) 80
Viscosity(Pa s) 0.004
Table 1 Physiological variables used in simulations
SBP = Systolic blood pressure; DBP = Diastolic blood pressure; HR = Heart rate
volume mesh generation was accomplished using the Delaunay triangulation algorithm for the rest of the domains, with approximately 1.35 x 10⁶ elements. A grid
in dependence test was conducted to ensure the independence of numerical solutions on the choice of grid size and arrangements by choosing pressure and velocity showing differences within 2%.
Dimensionless curvature =
× (1) Dimensionless torsion =
× (2)2.2 Numerical boundary conditions and assumptions The blood was assumed to be a homogeneous, laminar, viscous Newtonian fluid. Blood density was assumed to be 1060 kg/m3. The clinical patient-specific physiological data presented in Table 1 were corporated in to the multi-scale model. The viscosity was assumed to be 0.004 Pa.s. Vessels were considered as rigid conduits with a no-slip wall boundary. To study the effects of pulsatile flow on the characteristics of the coronary circulation, the simplified pressure waveforms at the inlet of the coronary arterial geometry were produced using aortic pressure
Fig. 4 Schematic diagram of simplified pressure wave forms at the inlet of the three-dimensional(3-D) coronary arterial geometry. The zero-dimensional(0-D) lumped parameter model is coupled at the outlet of the 3-D coronary arterial geometry.
waveforms, as shown in Fig. 4[19,24-28]. The pressure boundary condition based on a 0-D lumped parameter model was used at the outlet of the coronary arterial geometry in Fig. 4. The initial outlet pressure is equal to the mean arterial pressure(MAP) calculated from the systolic blood pressure(SBP) and diastolic blood pressure (DBP) by Eq. (3)[24]. The initial outlet coronary artery flow rate under hyperemic conditions was estimated as 5.2 ml/s from a 4-fold greater flow rate under basal conditions at 1.3 ml/s[24,29]. The physiological data, e.g., SBP, DBP, heart rate(HR) are listed in Table 1. A 0-D lumped parameter model consisting of resistances and capacitances was used as the outlet conditions to consider cardiovascular dynamics in the coronary vascular bed system as a whole. Total LPM resistance was obtained using Eq. (4). This was split in to the coronary arterial resistance, coronary capillary resistance, and coronary venal resistance, in dicated by , and ,
respectively. Values of = 0.32·, = 0.52·
, and Rcv = 0.16· were imposed[19,29]. Total coronary capacitance, , was split in to coronary arterial capacitance and intramyocardial capacitance
, respectively. We used the values of = 0.52
and = 0.52[19,25,29]. (intramyocardial
pressure) was used to represent the influence of intramyocardial pressure caused by cardiac contractility tissue motion = , where is left ventricular pressure and = 0.75[30].
(3) (4) 2.3 Numerical Methodology
In this study, computational hemodynamic simulations were performed under hyperemic conditions in 3-D stenotic coronary models by coupling with a 0-D lumped parameter model. Blood flow was described by a continuity equation for mass conservation and a Navier-Stokes equation for pulsatile state in Eq. (5), (6). Local 3-D numerical analyses are based on a segregated finite element method to solve the Navier Stokes equation[31-34]. The continuity equation of Eq. (5) is solved by penalization using a pressure update algorithm [31,32].
∇ ∙ , (5)
∙ ∇ ∇ ∇, (6)
where is velocity, is pressure, is density, and
is dynamic viscosity. The outlet condition of 3-D computational fluid dynamics is coupled to the inlet condition of 0-D lumped parameter model by an iteration method that updates the pressure and velocity as the iteration processes. The coupling calculation continues until the velocity and pressure between the two models converge, using a successive over-relaxation(SOR)-based iterative solver. Validation and more detailed explanations of this approach are presented by the previous studies [19,25].
3. Results
Pulsatile flows in simplified stenotic coronary models, with and without pre-stenotic swirl flow, were simulated by 0-D 3-D-coupled multi-scale modeling based on Navier-Stoke equations. We analyzed a physiologically significant biomechanical factor(FFR) respects to stenosis severity in a non-swirl flow model and a swirl flow model.
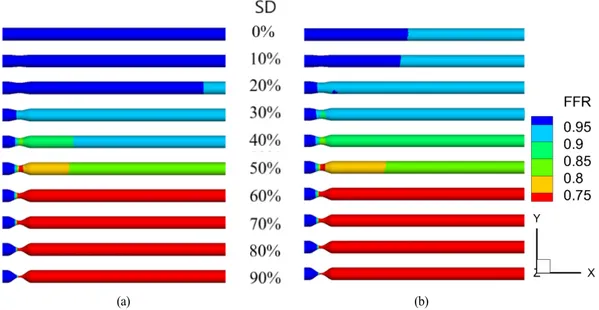
Fig. 5(a) and Fig. 5(b) show the FFR in stenotic models without and with pre-stenotic swirl flow, respectively. The general trends of the FFR distributions were similar, with FFR dropping markedly through the post-stenosis throat. Lower FFR values were observed with swirl flow compared with non-swirl flow. The
(a) (b)
Fig. 5 Fractional flow reserve (FFR) distribution in stenotic model with (a) non-swirl flow and (b) swirl flow
differences in FFR caused by pre-stenotic non-swirl flow and swirl flow were clearly observed in mild stenosis(SD < 50%), but were almost the same above SD = 50% in Fig. 5. FFR was below the clinically significant criterion of 0.8 in the post-stenosis region when SD > 50% in Fig. 5.
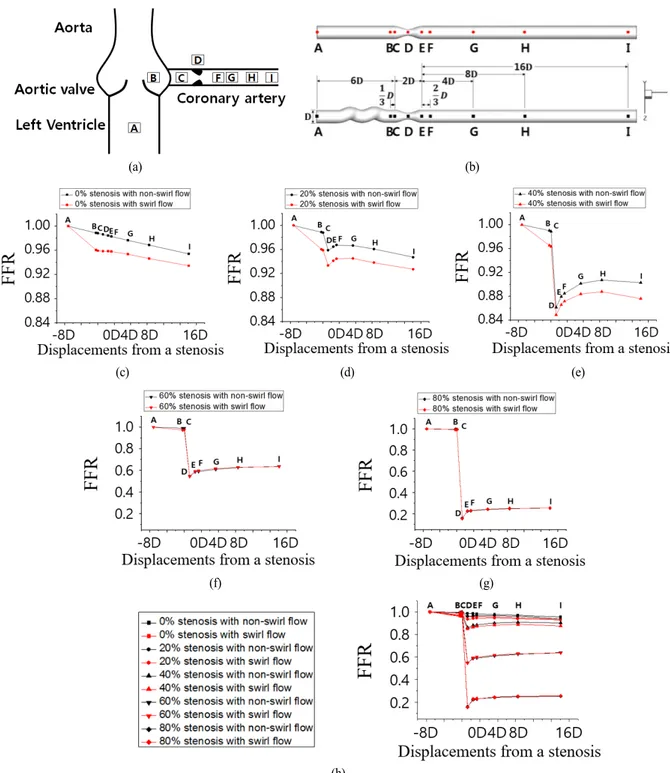
Fig. 6(a) and Fig. 6(b) show interest points from A to I along the aorta and coronary artery model. The pre-stenotic region, stenotic region, and post-stenotic region consist of (point A ~ point C), (point C ~ point E), and (point E ~ point I), respectively in Fig 6(b). The center points represent (point A) pre-stenosis upstream 6D, (point B) upstream D, (point C) start of stenosis, (point D) stenosis throat, (point E) end of stenosis, (point F) post-stenosis downstream D, (point G) downstream 4D, (point H) downstream 8D, and (point I) downstream 16D in Fig 6(b). Fig. 6(c)-(h) shows FFR at positions A ~ I along the center line (Fig. 6(b)) of coronary models for 0%, 20%, 40%, 60%, and 80% stenotic models, respectively. As shown in Fig. 6(c), in the case of the non-swirl flow (shown in black), slight reductions of FFR at A ~ I were observed in the straight model under normal conditions (SD = 0%) due to frictional viscous loss, in good agreement with the results of a previous study[35]. On the other hand, in the case of swirl flow (shown in red), the swirl flow induced notable decreases in FFR between points A and B compared with points C ~ I. The considerable reduction of FFR at point B was due to friction and momentum exchange induced by
changes in direction of flow in the helical region. That is, the main cause was the spiral change in flow direction, which was significantly dependent on the curvature, torsion, and pitch ratio. In the normal model (SD = 0%) shown in Fig. 6(c), FFR reduction caused by the swirl flow was significant in the pre-stenotic region, and a parallel downward slope of FFR was observed in the post-stenotic region. In the case of mild stenosis (SD = 20% and 40%) in Fig. 6(d), Fig. 6(e), and Fig. 6(i), viscous losses or momentum exchanges caused a slight downward slope in the first portion of the curve in the pre-stenotic regions in the graph. In addition, the pressure loss by momentum exchange was responsible for the differences in FFR at B and C. Through the upstream stenosis throat, axial velocity increased to satisfy the flow rate conservation law due to the reduction in area caused by the stenosis. Simultaneously, pressure decreased and FFR also decreased significantly in the region upstream of the stenosis (pre-stenotic throat (C ~ D)). In the region downstream of stenosis (post-stenotic throat (D ~ E)), slight FFR recovery occurred in the D ~ E region due to the small increase in area at the stenosis. FFR remained approximately equal to that at the throat of the stenosis in the post-stenotic region. Interestingly, the FFR difference (DFFR 0.02) observed in the pre-stenosis area from swirl flow remained downstream in mild stenosis. Furthermore, FFR decreased notably through the stenosis throat, as the degree of stenosis increased. In addition, the downward stepwise trend of the FFR graph was more
(a) (b)
(c) (d) (e)
(f) (g)
(h)
Fig. 6 (a) Schematic view of aorta and stenotic coronary artery with regions of interest (b) Regions of interest in the simplified stenotic coronary arterial models in the two groups (c)-(g) FFR along the centerlines of 0%, 20%, 40%, 60%, and 80% stenotic arterial models, respectively, compared to stenotic models with pre-stenotic helical swirling flow (h) FFR along the centerlines of all stenotic arterial models
(a)
(b)
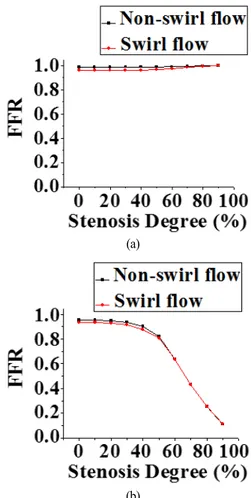
Fig. 7 Computed FFR in pre-stenotic and post-stenotic regions as a function of degree of stenosis in stenotic models with inflow without vortex(shown in red) and swirl inflow with vortex(shown in black). FFR at (a) pre-stenotic point C and (b) post-stenotic distal point I.
obvious. Similar slight downward slopes in the first portion of the FFR curve were observed in the case of moderate/severe stenosis (SD = 60% and 80%), as shown in Fig. 6(f), Fig. 6(g), and Fig. 6(i). FFR decreased markedly through the stenosis throat due to the high degree of stenosis. In the downstream stenosis throat, FFR recovered significantly. The influences of recovery and the separation energy loss were combined in the post-stenosis region, so FFR remained almost constant downstream. The FFR curves were convex in moderate/severe stenosis in Fig. 6(f) and Fig. 6(g). This trend was clearly seen with increasing degree of stenosis, as shown in Fig. 6(i). Especially, the FFR curve was almost the same between the non-swirl flow/swirl flow cases in moderate and severe stenosis, indicating that the influence of stenosis
was dominant compared with that of swirl flow.
Fig. 7 shows a graph of computed FFR in the pre-stenotic region at C in Fig. 7(a) and post-stenotic region at I in Fig. 7(b) against degree of stenosis in a stenotic model with non-swirl flow in red and with swirl flow in black. Regions C and I are the same as those in Fig. 6(b). FFR with non-swirl flow was higher than that with swirl flow in mild/moderate stenosis. FFR did not decrease markedly with swirl flow in severe stenosis, and there was no marked difference in FFR between non-swirl flow and swirl flow at C. This was because flow rate decreased markedly in severe stenosis, as indicated in a previous report[36]. FFR remained high and was constant in mild stenosis (0 ~ 40%), but decreased dramatically in moderate/severe stenosis (50 ~ 90%), as shown in Fig. 7(b). A similar downward trend was shown in both the non-swirl and swirl flow models. In the non-swirl flow case, the computed FFR as a function of degree of stenosis was similar to that reported in the relationship of maximum flow rate and degree of stenosis in a previous report[36]. FFR in the non-swirl flow model was higher by approximately 0.02 compared with that in the swirl flow model in mild stenosis. On the other hand, the values of FFR were nearly identical in both the non-swirl/swirl flow models when SD > 50%. These trends, including the FFR difference (DFFR 0.02), were identical for FFR at distal points F, G, and H in mild stenosis (data not shown). Our results indicate that swirl flow influences the decrease in FFR by approximately 0.02 in the mild stenosis model compared with the non-swirl flow model.
4. Discussions
There has been some controversy regarding the best way to achieve more physiologically correct simulation of coronary circulation, specifically, how swirl flow induced by the aortic valve and tortuous vessels influence local hemodynamics as it relates to FFR in the region distal to the stenosed vessel. The present inductive study, with the assumption of the presence or absence of pre-stenotic swirl flow in various grades of stenosis, provides a better understanding of this issue. This study was performed to investigate how pre-stenotic swirl flow affects post-stenotic distal FFR alterations and distal flow behavior under various virtual grades of stenosis progression in a patient. In the present study, we examined pulsatile flow in simplified straight stenotic and helical stenotic coronary arterial models using the 0-D 3-D-coupled Navier-Stokes
solver.
This parameter study using virtual stenotic models, with and without pre-stenotic swirl flow, yielded two interesting findings. First, FFR alterations caused by pre-stenotic non-swirl flow and swirl flow were clearly observed in mild stenosis (SD < 50%), but FFR remained nearly the same over SD = 50% (Fig. 5). These FFR distributions were quantitatively plotted according to SD in Fig. 6. The FFR variation showed a convex curve at the stenosis throat, identical to results reported previously[17]. The quantitative differences in FFR between the cases of non-swirl flow and swirl flow were relatively large in mild stenosis compared with moderate/severe stenosis. Approximately differences of 0.02 were observed in the relationship between FFR and SD between non-swirl flow and swirl flow within SD < 50%, as shown in Fig. 7. In addition, the trends between FFR and SD showed good agreement with a previous report showing the relationship between SD and maximum blood flow, which was proportional to pressure in the stenotic coronary artery [36]. In summary, the effect of swirl flow is dominant and induces a decrease in FFR in mild stenosis. The effect of stenosis is dominant in moderate/severe stenosis. These findings suggest that computed tomography (CT)-FFR values in previous computational studies that neglected the influence of swirl flow from the aortic valve may be slightly overestimated in the case of mild stenosis[37-46]. This overestimation of CT-FFR value may result in slightly lower sensitivity.
This study has several limitations. First, the effects of patient-specific physiological data (e.g., systolic pressure, diastolic pressure, heart rate, stroke volume, vortex magnitude, anatomically correct vascular configuration) were not considered in simplified modeling. Therefore, qualitative analysis of FFR could be more applicable than quantitative analysis. Next, only swirl flow with single helical geometry with one curvature and one torsion was imposed to determine the flow the influence of stenosis degree. The various curvature and torsion can induce several swirling flow patterns, e.g., one dominant single swirling flow, two symmetric swirling flows, two asymmetric swirling flows, and multi-swirling flows produced by aortic flow condition by aortic valves. Therefore, the influences of various swirl flow patterns on FFR alteration and hemodynamics should be investigated in future studies. However, these limitations do not significantly influence the major findings of this study.
To sum up, pulsatile flow in a 3-D stenotic tube, with and without swirl flow due to the pre-stenotic helical
geometry, was studied taking into consideration the combined effects of swirl flow and degree of stenosis. In mild stenotic models, the role of swirl flow in reducing FFR was verified by computational comparative simulation studies using pre-stenotic straight and helical models. The results indicated that the presence of pre-stenotic swirl flow notably alters FFR and induces reduction of FFR in mild stenotic geometries. The influence of pre-stenotic swirl flow was not significant as the degree of stenosis increased. However, the effects of stenosis were dominant on FFR than those of swirl flow in the moderate/severe stenotic models. These hemodynamic-based parameter studies could play a critical role in non-invasive imaging-based diagnostic decision-making processes in cases of mild/moderate stenosis. In addition, biomechanical modeling may be applicable to optimize the strategy of percutaneous transluminal angioplasty, and thus obtain better sensitivity that is the percentage of sick people with FFR 0.8 who are correctly identified as sick.
Acknowledgements
This work were supported by the Ministry of Science, ICT and Future Planning under Grant No. 2015K000245.
References
[1] 1996, Frazin, L.J., Vonesh, M.J., Chandran, K.B., Shipkowitz, T., Yaacoub, A.S. and McPherson, D.D., "Confirmation and Initial Documentation of Thoracic and Abdominal Aortic Helical Flow: An Ultrasound Study," Journal of the American Society for Artificial Internal Organs, Vol.42, No.6, pp.951-956.
[2] 2007, Frydrychowicz, A., Winterer, J.T., Zaitsev, M., Jung, B., Henning, J., Langer, M. and Markl, M., "Visualization of iliac and proximal femoral artery hemodynamics using time-resolved 3-D phase contrast MRI at 3T," Journal of Magnetic Resonance Imaging, Vol.25, No.5, pp.1085-1092.
[3] 2001, Kaazempur-Mofrad, M.R. and Ethier, C.R., "Mass transport in an anatomically realistic human right coronary artery," Annals of Biomedical Engineering, Vol.29, No.2, pp.121-127.
[4] 1993, Kilner, P.J., Yang, G.Z., Mohiaddin, R.H., Firmin, D.N. and Longmore, D.B., "Helical and retrograde secondary flow patterns in the aortic arch studied by three-directional magnetic resonance velocity mapping," Circulation, Vol.88, No.5,
pp.2235-2247.
[5] 2014, Ha, H. and Lee, S.J., "Effect of swirling inlet condition on the flow field in a stenosed arterial vessel model," Medical Engineering & Physics, Vol.36, No.1, pp.119-128.
[6] 2003, Houston, J.G., Gandy, S.T., Sheppard, D.G., Dick, J.B., Belch, J.J. and Stonebridge, P.A., "Two-dimensional flow quantitative MRI of aortic arch blood flow patterns: Effect of age, sex, and presence of carotid atheromatous disease on prevalence of spiral blood flow," Journal of Magnetic Resonance Imaging, Vol.18, No.2, pp.169-174.
[7] 2009, Liu, X., Pu, F., Fan, Y., Deng, X., Li, D. and Li, S., "A numerical study on the flow of blood and the transport of LDL in the human aorta: the physiological significance of the helical flow in the aortic arch," American Journal of Physiology-Heart and Circulatory Physiology, Vol.297, No.1, pp.H163-H170.
[8] 2008, Verhey, J.F. and Bara, C., "Influence on fluid dynamics of coronary artery outlet angle variation in artificial aortic root prosthesis," Biomed Engineering Online, Vol.7, No.9, pp.1-9.
[9] 2011, Morbiducci, U., Ponzini, R., Rizzo, G., Cadioli, M., Esposito, A., Montevecchi, F.M. and Redaelli, A., "Mechanistic insight into the physiological relevance of helical blood flow in the human aorta: an in vivo study," Biomechanics and Modeling in Mechanobiology, Vol.10, No.3, pp.339-355.
[10] 2011, Lee, K.E., Lee, J.S. and Yoo, J.Y., "A numerical study on steady flow in helically sinuous vascular prostheses," Medical Engineering & Physics, Vol.33, No.1, pp.38-46.
[11] 2015, Liu, X., Sun, A., Fan, Y. and Deng, X., "Physiological significance of helical flow in the arterial system and its potential clinical applications," Annals of Biomedical Engineering, Vol.43, No.1, pp.3-15.
[12] 2009, Paul, M.C. and Larman, A., "Investigation of spiral blood flow in a model of arterial stenosis," Medical Engineering & Physics, Vol.31, No.9, pp.1195-1203.
[13] 1996, Caro, C.G., Doorly, D.J., Tarnawski, M., Scott, K.T., Long, Q. and Dumoulin, C.L., "Non-planar curvature and branching of arteries and non-planar-type flow," Proceedings of the Royal Society of London A: Mathematical, Physical and Engineering Sciences. The Royal Society, Vol.452, No.1944, pp.185-197.
[14] 2013, Caro, C.G., Seneviratne, A., Heraty, K.B., Monaco, C., Burke, M.G., Krams, R., Chang, C.C., Coppola, G. and Gilson, P., "Intimal hyperplasia following implantation of helical-centreline and straight-centreline stents in common carotid arteries in healthy pigs: influence of intraluminal flow," Journal of the Royal Society Interface, Vol.10, No.89, p.20130578.
[15] 2009, Cookson, A.N., Doorly, D.J. and Sherwin, S.J., "Mixing through stirring of steady flow in small amplitude helical tubes," Annals of Biomedical Engineering, Vol.37, No.4, pp.710-721.
[16] 2009, Sung, K.H., Ro, K.C. and Ryou, H.S., "Numerical investigation on the blood flow characteristics considering the axial rotation in stenosed artery," Korea-Australia Rheology Journal, Vol.21, No.2, pp.119-126.
[17] 2013, Keshavarz-Motamed, Z., Garcia, J. and Kadem, L., "Fluid dynamics of coarctation of the aorta and effect of bicuspid aortic valve," PLoS One, Vol.8, No.8, p.e72394.
[18] 2004, Stonebridge, P.A., Buckley, C., Thompson, A. and Dick, J., "Non spiral and spiral (helical) flow patterns in stenoses: in vitro observations using spin and gradient echo magnetic resonance imaging (MRI) and computational fluid dynamic modeling," International Angiology, Vol.23, No.3, p.276.
[19] 2014, Kwon, S.S., Chung, E.C., Park, J.S., Kim, G.T., Kim, J.W., Kim, K.H., Shin, E.S. and Shim, E.B., "A novel patient-specific model to compute coronary fractional flow reserve," Progress in Biophysics and Molecular Biology, Vol.116, No.1 pp.48-55.
[20] 2015, Iori, F., Grechy, L., Corbett, R.W., Gedroyc, W., Duncan, N., Caro, C.G. and Vincent, P.E., "The effect of in-plane arterial curvature on blood flow and oxygen transport in arterio-venous fistulae," Physics of Fluids, Vol.27, No.3, p.031903.
[21] 2008, Achenbach, S., "Quantification of Coronary Artery Stenoses by Computed Tomography," JACC: Cardiovascular Imaging, Vol.1, pp.472-474.
[22] 2013, Cury, R.C., Feuchtner, G.M., Batlle, J.C., Peña, C.S., Janowitz, W., Katzen, B.T. and Ziffer, J.A., "Triage of patients presenting with chest pain to the emergency department: implementation of coronary CT angiography in a large urban health care system," American Journal of Roentgenology, Vol.200, No.1, pp.57-65.
characteristics in models of arterial stenosis I. steady flow," Journal of biomechanics, Vol.6, No.4, pp.395-410.
[24] 2012, Klabunde, R., "Cardiovascular Physiology concepts," The 2nd Edition, Lippincott Williams & Wilkins.
[25] 2016, Lee, K.E., Kim, G.T., Lee, J.S., Chung, J.H., Shin, E.S. and Shim, E.B., "A patient-specific virtual stenotic model of the coronary artery to analyze the relationship between fractional flow reserve and wall shear stress," International Journal of Cardiology, Vol.222, pp.799-805.
[26] 1992, Kelly, R. and Fitchett, D., "Noninvasive determination of aortic input impedance and external left ventricular power output: a validation and repeatability study of a new technique," Journal of the American College of Cardiology, Vol.20, No.4, pp.952-963.
[27] 2006, Laurent, S., Cockcroft, J., Van Bortel, L., Boutouyrie, P., Giannattasio, C., Hayoz, D., Pannier, B., Vlachopoulos, C., Wilkinson, I. and Struijker-Boudier, H., "Expert consensus document on arterial stiffness: methodological issues and clinical applications," Eur Heart J, Vol.27, No.21, pp.2588-2605.
[28] 2005, Verbeke, F., Segers, P., Heireman, S., Vanholder, R., Verdonck, P. and Van Bortel, L.M., "Noninvasive assessment of local pulse pressure: importance of brachial-to-radial pressure amplification," Hypertension, Vol.46, No.1, pp.244-248.
[29] 2012, Sankaran, S., Moghadam, M.E., Kahn, A.M., Tseng, E.E., Guccione, J.M. and Marsden, A.L., "Patient-specific multiscale modeling of blood flow for coronary artery bypass graft surgery," Annals of Biomedical Engineering, Vol.40, No.10, pp.2228-2242. [30] 1990, Schreiner, W., Neumann, F. and Mohl, W.,
"The role of intramyocardial pressure during coronary sinus interventions: a computer model study," IEEE Transactions on Biomedical Engineering, Vol.37, No.10, pp.956-967.
[31] 1998, Du Toit, C.G., "Finite element solution of the Navier-Stokes equations for incompressible flow using a segregated algorithm," Computer Methods in Applied Mechanics and Engineering, Vol.151, No.1-2, pp.131-141.
[32] 1993, Haroutunian, V. Engelman, M.S. and Hasbani, I., "Segregated finite element algorithms for the numerical solution of large-scale incompressible flow problems," International Journal for Numerical
Methods in Fluids, Vol.17, No.4, pp.323-348.
[33] 1994, Shim, E.B. and Chang, K.S., "Three-dimensional vortex flow past a tilting disc valve using a segregated finite element scheme," Computational Fluid Dynamics Journal, Vol.3, pp.205-222.
[34] 1997, Shim, E.B. and Chang, K.S., "Numerical analysis of three-dimensional Bjork Shiley valvular flow in an aorta," Journal of Biomechanical Engineering, Vol.119, No.1, pp.45-51.
[35] 1998, White, F.M., "Fluid mechanics. 4Th Ed," McGraw-Hill Higher Education.
[36] 1974, Gould, K.L., Lipscomb, K. and Hamilton, G.W., "Physiologic basis for assessing critical coronary stenosis: instantaneous flow response and regional distribution during coronary hyperemia as measures of coronary flow reserve," The American Journal of Cardiology, Vol.33, No.1, pp.87-94.
[37] 2010, Bark, D.L. and Ku, D.N., "Wall shear over high degree stenoses pertinent to atherothrombosis," Journal of Biomechanics, Vol.43, No.15, pp.2970-2977.
[38] 1998, Baumgart, D., Haude, M., Goerge, G., Ge, J., Vetter, S., Dagres, N., Heusch, G. and Erbel, R., "Improved assessment of coronary stenosis severity using the relative flow velocity reserve," Circulation, Vol.98, No.1, pp.40-60.
[39] 2014, Gaur, S., Bezerra, H.G., Lassen, J.F., Christiansen, E.H., Tanaka, K., Jensen, J.M., Oldroyd, K.G., Leipsic, J., Achenbach, S. and Kaltoft, A.K., "Fractional flow reserve derived from coronary CT angiography: Variation of repeated analyses," Cardiovascular Computed Tomography, Vol.8, No.4, pp.307-314.
[40] 2011, Koo, B.K., Erglis, A., Doh, J.H., Daniels, D.V., Jegere, S., Kim, H.S., Dunning, A., DeFrance, T., Lansky, A. and Leipsic, J., "Diagnosis of ischemia-causing coronary stenoses by noninvasive fractional flow reserve computed from coronary computed tomographic angiograms: results from the prospective multicenter DISCOVER-FLOW(Diagnosis of Ischemia-Causing Stenoses Obtained Via Noninvasive Fractional Flow Reserve) study," The American College of Cardiology, Vol.58, No.19, pp.1989-1997.
[41] 2013, Nakazato, R., Park, H.B., Berman, D.S., Gransar, H., Koo, B.K., Erglis, A., Lin, F.Y., Dunning, A.M., Budoff, M.J. and Malpeso J., "Noninvasive fractional flow reserve derived from
computed tomography angiography for coronary lesions of Intermediate Stenosis Severity Results from the DeFACTO Study," Circulation: Cardiovascular Imaging, Vol.6, No.6, pp.881-889.
[42] 2014, Nørgaard, B.L., Leipsic, J., Gaur, S., Seneviratne, S., Ko, B.S., Ito, H., Jensen, J.M., Mauri, L., De Bruyne, B. and Bezerra, H., "Diagnostic performance of noninvasive fractional flow reserve derived from coronary computed tomography angiography in suspected coronary artery disease: the NXT trial (Analysis of Coronary Blood Flow Using CT Angiography: Next Steps)," The American College of Cardiology, Vol.63, No.12, pp.1145-1155.
[43] 2014, Renker, M., Schoepf, U.S., Wang, R., Meinel, F.G., Rier, J.D., Bayer, R.R., Möllmann, H., Hamm, C.W., Steinberg, D.H. and Baumann, S., "Comparison of Diagnostic Value of a Novel Noninvasive Coronary Computed Tomography Angiography Method Versus Standard Coronary Angiography for Assessing
Fractional Flow Reserve," The American Journal of Cardiology, Vol.114, No.9, pp.1303-1308.
[44] 2002, Shalman, E., Rosenfeld, M., Dgany, E. and Einav, S., "Numerical modeling of the flow in stenosed coronary artery. The relationship between main hemodynamic parameter," Computers in Biology and Medicine, Vol.32, No.5, pp.329-344.
[45] 2013, Taylor, C.A., Fonte, T.A. and Min, J.K., "Computational fluid dynamics applied to cardiac computed tomography for noninvasive quantification of fractional flow reserve: scientific basis," Journal of the American College of Cardiology, Vol.61, No.22, pp.2233-2241.
[46] 1995, Tron, C., Donohue, T.J., Bach, R.G., Aguirre, F.V., Caracciolo, E.A., Wolford, T.L., Miller, D.D. and Kern, M.J., "Comparison of pressure-derived fractional flow reserve with poststenotic coronary flow velocity reserve for prediction of stress myocardial perfusion imaging," Journal of American Heart, Vol.130, No.4. pp.723-733.