Healthy Life Expectancy and Health Gains in Cardiovascular Diseases Management in Korea
Young-Ho Jung, Research Fellow 2012
Korea Institute for Health and Social Affairs All rights reserved. No Part of this book may be reproduced in any form without permission in writing from the publisher
Korea Institute for Health and Social Affairs Jinhungro 235, Eunpyeong-gu, Seoul 122-705, Korea
http://www.kihasa.re.kr
Contents
CHAPTER 1Introduction··· 3
CHAPTER 2 Life Expectancy and Healthy Life Expectancy ··· 11
1. Life Expectancy in Korea ··· 11
2. Methods of Health-Adjusted Life Expectancy ··· 14
3. Health-Related Quality of Life ··· 15
4. Health-Adjusted Life Expectancy in Korea ··· 21
CHAPTER 3 Gains in HALE after Eliminating Stroke and Risk Factors··· 29
1. Methods ··· 29
2. Diabetes-eliminated HALE Gains ··· 31
3. Hypertension-eliminated HALE Gains ··· 36
Contents
CHAPTER 4Summary and Conclusion··· 55
1. Differences between Life Expectancy and Health-Adjusted Life Expectancy ··· 55 2. Policy Implications and Suggestions ··· 59
Contents
List of Tables
Table 1- 1 Healthy life expectancy under HP2020 ··· 5
Table 1- 2 Estimated goals for HP2020 ··· 6
Table 2- 1 Life table: Overall ··· 12
Table 2- 2 Life table for male ··· 13
Table 2- 3 Life table for female ··· 14
Table 2- 4 Health profile: 2009 ··· 16
Table 2- 5 Health profile by age group ··· 17
Table 2- 6 Health profile by gender ··· 18
Table 2- 7 EQ-5D tariff in Korea ··· 19
Table 2- 8 EQ-5D index for Korean adults ··· 20
Table 2- 9 Health-related quality of life for Korean adults by gender and age ··· 20
Table 2-10 Utility weight for people aged below 20 ··· 21
Table 2-11 Life expectancy and health-adjusted life expectancy ··· 22
Table 2-12 Differences between LE and HALE ··· 22
Table 2-13 Health-adjusted life expectancy: Male ··· 24
Table 2-14 Health-adjusted life expectancy: Female ··· 25
Table 3-1 Mortality caused by diabetes: 2009 ··· 32
Contents
Table 3-3 HALE after eliminating diabetes ··· 34 Table 3-4 Differences between LE and HALE
after diabetes deletion ··· 35 Table 3-5 Mortality due to hypertension ··· 37 Table 3-6 Life expectancy in the absence of
hypertension-related deaths ··· 38 Table 3-7 HALE in the absence of
hypertension-related diseases ··· 39 Table 3-8 Difference between LE and HALE after
deletion of hypertension-related diseases ··· 40 Table 3-9 Mortality caused by stroke ··· 41 Table 3-10 Life expectancy after stroke deletion ··· 42 Table 3-11 Health-adjusted life expectancy
after stroke deletion ··· 43 Table 3-12 Differences between LE and HALE
after stroke deletion ··· 44 Table 3-13 Mortality caused by heart diseases ··· 45 Table 3-14 Life expectancy after cause deletion of
heart diseases ··· 46 Table 3-15 Health-adjusted life expectancy
Contents
Table 3-16 Difference between life expectancy and HALE after cause deletion of heart diseases ··· 48 Table 3-17 Mortality caused by cardio-cerebrovascular diseases ··· 49
Table 3-18 Life expectancy after cause deletion of
cardio-cerebrovascular diseases ··· 50 Table 3-19 Health-adjusted life expectancy after cause deletion
of cardio-cerebrovascular diseases ··· 51 Table 3-20 Difference between life expectancy and HALE after cause
deletion of cardio-cerebrovascular diseases ··· 52 Table 4-1 Life expectancy by gender and age in Korea ··· 55 Table 4-2 Differences between LE and HALE in Korea ···· 56 Table 4-3 Differences between LE and HALE
by age and sex ··· 56 Table 4-4 Increments in life expectancy and HALE
after deletion of major causes ··· 58
List of Figures
Ch
apt
er
01
3
Chapter 1
Introduction
Life expectancy in Korea rose by 17.2 years from 62.2 years in 1970 to 79.4 years in 2007, on the order of the OECD average, while infant mortality rate dropped to less than one-tenth from 45.0 per 1,000 in 1970 to 4.1 in 2006.1) However, healthy life expectancy in Korea, a summary measure that combines information on mortality and morbidity, is around 68.6 years, which is still quite low compared to 75 years in Japan and 71.8 years in German.2) Therefore, despite the remarkable progress achieved, Korean health promotion policy should be further strengthened.
Recognizing that it is important to improve the quality of life through health promotion, the Korean government has made effort to facilitate health promotion programs by, above all, enacting the National Health Promotion Law in 1995 and developing and implementing health promotion policies under the law. Advanced countries as well as Korea have established health promotion goals and pursued health promotion strategies on the national level since the 1980s, for example, ‘Healthy People 2000,’ ‘Healthy People 2010,’ and ‘Healthy People 2020’ of the United States; ‘The Health of the Nation (2000)’ and
1) Jung, Young-Ho mimeo, Korea Institute for Health and Social Affairs, 2010 2) Jung, Young-Ho, mimeo, Korea Institute for Health and Social Affairs, 2010
Healthy Life Expectancy and Health Gains in Cardiovascular Diseases Management in Korea
4
‘Our Healthier Nation (2010)’ of the United Kingdom; ‘People’s Health Promotion Campaign,’ ‘Active 80 Health Plan,’ and ‘Health Japan 21,’ of Japan; and ‘Better Health Commission’ of Australia.
Meanwhile, the Ministry of Health and Welfare recently (June 2, 2011) announced the Third National Health Promotion Plan (HP2020, ’11-20) with the goal of increasing the healthy life expectancy of Koreans to 75 by 2020. The health plan was conceived as a long-term plan for a ten-year period, considering that the effects of health promotion programs materialize over a long period, and the target age for 2020 was calculated based on available indices. Healthy life expectancy as proposed in HP2020 was calculated by deducting from the average life expectancy the period in which people are unable to lead a healthy and normal living due to diseases or injuries. Healthy life expectancy. It shows how long people can expect to live in good health, not just how long they can live. There are various ways of estimating healthy life expectancy. In the Third National Health Promotion Plan, WHO’s healthy life expectancy index was used, and Korean healthy life expectancy was estimated at 75 under HP 2020 in consideration of the trends of healthy life expectancy in advanced countries and the increase in healthy life expectancy in Korea.
Chapter 1_Introduction
5
Table 1-1 Healthy life expectancy under HP2020
1998 2001 2005 2007 HP2010 goal
HP2020 goal Korean Total 74.8 76.5 78.6 79.6 72.0 75.0 average life Male 71.1 72.8 75.1 76.1 69.7 73.2 expectancy Female 78.5 80 81.9 82.7 74.2 76.6
WHO Total 65.0 67.4 - 71.0 -
-healthy life Male 62.3 64.5 - 68.0 - -expectancy Female 67.7 70.3 - 74.0 -
-Source: Third National Health Promotion Plan (2011~2020), Ministry of Health and Welfare and the Korea Institute for Health and Social Affairs
Developed with the overarching goals of increasing healthy life expectancy and promoting health equity, HP2020 comprises health promotion goals and detailed strategies in six fields; realization of healthy living, management of chronic diseases, health management for population groups, management of infectious diseases, safety and health management, and business system management.
The health promotion goals and detailed strategies were developed for the establishment of preventive health promotion system based on the belief that prevention of diseases can help improve quality of life, enhance human resources, and reduce people’s health care expenses, and ultimately, contribute to the progress and economic growth of the country. In this relation, key indices were selected and the 2020 goals for these indices were determined. The following table shows estimated goals for various indices chosen under the overall goal of the healthy life expectancy of 75.
Healthy Life Expectancy and Health Gains in Cardiovascular Diseases Management in Korea
6
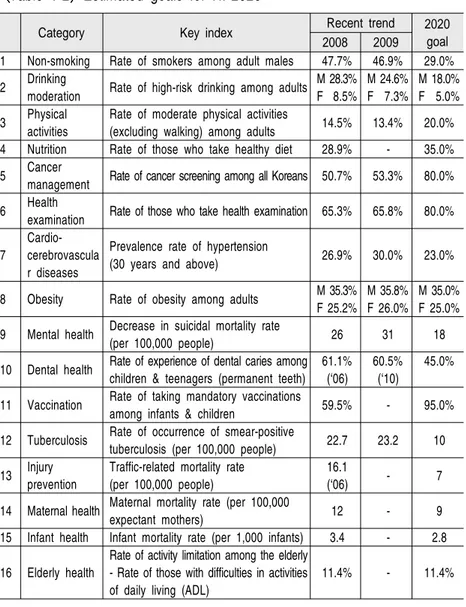
Table 1-2 Estimated goals for HP2020
Category Key index Recent trend 2020 goal 2008 2009
1 Non-smoking Rate of smokers among adult males 47.7% 46.9% 29.0% 2 Drinking moderation Rate of high-risk drinking among adults M 28.3%F 8.5% M 24.6%F 7.3% M 18.0%F 5.0% 3 Physical
activities
Rate of moderate physical activities
(excluding walking) among adults 14.5% 13.4% 20.0% 4 Nutrition Rate of those who take healthy diet 28.9% - 35.0% 5 Cancer
management Rate of cancer screening among all Koreans 50.7% 53.3% 80.0% 6 Health
examination Rate of those who take health examination 65.3% 65.8% 80.0% 7
Cardio-cerebrovascula r diseases
Prevalence rate of hypertension
(30 years and above) 26.9% 30.0% 23.0% 8 Obesity Rate of obesity among adults M 35.3%
F 25.2%
M 35.8% F 26.0%
M 35.0% F 25.0% 9 Mental health Decrease in suicidal mortality rate (per 100,000 people) 26 31 18 10 Dental health Rate of experience of dental caries among
children & teenagers (permanent teeth) 61.1%
(‘06)
60.5% (‘10)
45.0%
11 Vaccination Rate of taking mandatory vaccinations
among infants & children 59.5% - 95.0% 12 Tuberculosis Rate of occurrence of smear-positive tuberculosis (per 100,000 people) 22.7 23.2 10 13 Injury
prevention
Traffic-related mortality rate (per 100,000 people)
16.1
(‘06) - 7 14 Maternal health Maternal mortality rate (per 100,000
expectant mothers) 12 - 9 15 Infant health Infant mortality rate (per 1,000 infants) 3.4 - 2.8 16 Elderly health
Rate of activity limitation among the elderly - Rate of those with difficulties in activities of daily living (ADL)
11.4% - 11.4%
Source: Third National Health Promotion Plan (2011~2020), Ministry of Health and Welfare and the Korea Institute for Health and Social Affairs
Chapter 1_Introduction
7 This study attempted to analyze life expectancy and health life expectancy in relation to chronic diseases. More specifically, we hoped to promote understanding of these indices by examining health indices in detail. By using the numbers of the dead and the total population announced by Statistics Korea, we calculated the life expectancy of Korean people. Then, we estimated healthy life expectancy based on the life expectancy that we drew for the study and the results of the Korea Health Panel, a nationwide survey on the quality of life with the focus on health. In addition, we attempted to estimate by how much life expectancy and healthy life expectancy would increase in the absence of deaths attributable to major chronic diseases. For this, we used the methodology proposed by Sullivan.
Ch
apt
er
02
Life Expectancy and Healthy
Life Expectancy
11
Chapter 2
Life Expectancy and Health Life Expectancy
1. Life Expectancy in Korea
Life table is a table that summarizes the process in which a particular birth cohort ages and dies out under the assumption of the current mortality levels of various age groups. Statistics Korea produces a life table each year based on the population of the year (as of July 1) and death registration records. It shows the average period of further survival, death probability for different age groups and the probability of a person of one age group age into an older age group, under the supposition that the pattern and level of mortality for the age group are retained. A life table that divides cohorts by one year is called a complete life table, and one that divides cohorts by five years is called an abridged life table.
In this study, we calculated life expectancy as a preparation for drawing healthy life expectancy. Life expectancy refers to the number of years of survival that a person aged is expected to live in the future, and it is calculated according to the following process: First, calculate the death probability that indicates the probability of a person aged dying without reaching the age of . Second, after calculating the number of deaths, calculate the number of survivors by subtracting the number of deaths from the total population. In others, the number of survivors means the number of people alive at the age of , or the number
Healthy Life Expectancy and Health Gains in Cardiovascular Diseases Management in Korea 12 Age Death probability Number of survivors Number of deaths Stationary population Total years of survival Life expectancy 0 0.0034 100,000 1,500 99,712 8,067,147 80.67 1 - 4 0.0009 99,661 405 398,468 7,967,435 79.95 5 - 9 0.0007 99,573 384 497,684 7,568,967 76.01 10 - 14 0.0007 99,501 441 497,339 7,071,283 71.07 15 - 19 0.0015 99,435 1,073 496,792 6,573,944 66.11 20 - 24 0.0024 99,282 1,507 495,814 6,077,151 61.21 25 - 29 0.0033 99,044 2,544 494,410 5,581,338 56.35 30 - 34 0.0039 98,721 3,040 492,636 5,086,927 51.53 35 - 39 0.0052 98,334 4,718 490,384 4,594,291 46.72 40 - 44 0.0080 97,820 7,000 487,149 4,103,908 41.95 45 - 49 0.0125 97,040 10,970 482,164 3,616,758 37.27 50 - 54 0.0180 95,825 13,988 474,817 3,134,595 32.71 55 - 59 0.0249 94,102 13,394 464,648 2,659,777 28.26 60 - 64 0.0371 91,758 16,113 450,287 2,195,129 23.92 65 - 69 0.0608 88,357 24,020 428,347 1,744,841 19.75 of people expected to live to reach the age of as the group of 100,000 people who were born simultaneously decreases due to mortality. Third, calculate the survival probability and draw stationary population for each age group; then, add the number of population of those older than the respective age group to draw the total years for which survivors at age are expected to live until they reach the age of , or the stationary population beyond the particular age. Finally, divide the total years of survival until all survivors at the age of are expected to die by the number of survivors to calculate life expectancy.
Based on the above process, life expectancy at birth in 2009 was 80.67 years. This was similar to the life expectancy of 80.55 for Korean men and women announced by the Statistics Korea in 2009.
Table 2-1 Life table: Overall
Chapter 2_Life Expectancy and Healthy Life Expectancy 13 Age Death probability Number of survivors Number of deaths Stationary population Total years of survival Life expectancy 70 - 74 0.1000 82,982 31,975 394,156 1,316,495 15.86 75 - 79 0.1652 74,681 34,553 342,552 922,338 12.35 80 - 84 0.2746 62,340 33,981 268,910 579,786 9.30 85 - 89 0.4318 45,224 27,439 177,301 310,876 6.87 90 or above 1.0000 25,696 17,934 133,575 133,575 5.20
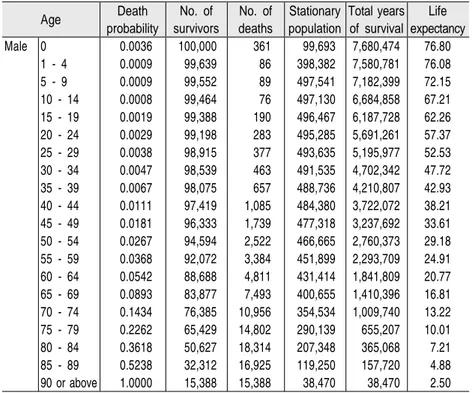
Life expectancy for men was 76.99 years at birth and 38.21 years at 40. Meanwhile, life expectancy for women was 83.77 years at birth, 44.01 years at 40 and 25.11 years at 60.
Table 2-2 Life table for male
(Unit: people, years) Age Death probability No. of survivors No. of deaths Stationary population Total years of survival Life expectancy Male 0 0.0036 100,000 361 99,693 7,680,474 76.80 1 - 4 0.0009 99,639 86 398,382 7,580,781 76.08 5 - 9 0.0009 99,552 89 497,541 7,182,399 72.15 10 - 14 0.0008 99,464 76 497,130 6,684,858 67.21 15 - 19 0.0019 99,388 190 496,467 6,187,728 62.26 20 - 24 0.0029 99,198 283 495,285 5,691,261 57.37 25 - 29 0.0038 98,915 377 493,635 5,195,977 52.53 30 - 34 0.0047 98,539 463 491,535 4,702,342 47.72 35 - 39 0.0067 98,075 657 488,736 4,210,807 42.93 40 - 44 0.0111 97,419 1,085 484,380 3,722,072 38.21 45 - 49 0.0181 96,333 1,739 477,318 3,237,692 33.61 50 - 54 0.0267 94,594 2,522 466,665 2,760,373 29.18 55 - 59 0.0368 92,072 3,384 451,899 2,293,709 24.91 60 - 64 0.0542 88,688 4,811 431,414 1,841,809 20.77 65 - 69 0.0893 83,877 7,493 400,655 1,410,396 16.81 70 - 74 0.1434 76,385 10,956 354,534 1,009,740 13.22 75 - 79 0.2262 65,429 14,802 290,139 655,207 10.01 80 - 84 0.3618 50,627 18,314 207,348 365,068 7.21 85 - 89 0.5238 32,312 16,925 119,250 157,720 4.88 90 or above 1.0000 15,388 15,388 38,470 38,470 2.50
Healthy Life Expectancy and Health Gains in Cardiovascular Diseases Management in Korea
14
Table 2-3 Life table for female
Age Death probability No. of survivors No. of deaths Stationary population Total years of survival Life expectancy Female 0 0.0031 100,000 314 99,733 8,292,273 82.92 1 - 4 0.0009 99,686 91 398,560 8,192,540 82.18 5 - 9 0.0005 99,594 54 497,838 7,793,980 78.26 10 - 14 0.0006 99,541 55 497,566 7,296,142 73.30 15 - 19 0.0011 99,486 111 497,150 6,798,576 68.34 20 - 24 0.0019 99,375 189 496,399 6,301,425 63.41 25 - 29 0.0027 99,185 266 495,261 5,805,026 58.53 30 - 34 0.0031 98,919 307 493,828 5,309,765 53.68 35 - 39 0.0037 98,612 365 492,149 4,815,937 48.84 40 - 44 0.0047 98,247 460 490,087 4,323,789 44.01 45 - 49 0.0067 97,787 659 487,289 3,833,702 39.20 50 - 54 0.0091 97,128 886 483,428 3,346,412 34.45 55 - 59 0.0130 96,243 1,253 478,081 2,862,985 29.75 60 - 64 0.0204 94,990 1,938 470,105 2,384,904 25.11 65 - 69 0.0360 93,052 3,348 456,892 1,914,799 20.58 70 - 74 0.0665 89,705 5,967 433,606 1,457,907 16.25 75 - 79 0.1282 83,738 10,733 391,856 1,024,302 12.23 80 - 84 0.2326 73,005 16,982 322,569 632,446 8.66 85 - 89 0.3937 56,023 22,059 224,967 309,877 5.53 90 or above 1.0000 33,964 33,964 84,910 84,910 2.50
2. Methods of Health-Adjusted Life Expectancy
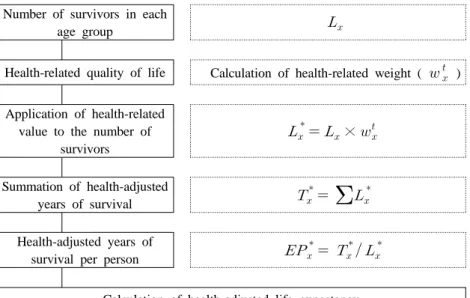
To calculate health-adjusted life expectancy (HALE), life expectancy is estimated in the above-mentioned way, and then, the weighted value of health-related quality of life is calculated and applied to the number of survivors. Next, the sum of the health-adjusted years of survival is divided by the number of survivors to draw life health-adjusted life expectancy.
Chapter 2_Life Expectancy and Healthy Life Expectancy
15
Figure 2-1 Methods for health-adjusted life expectancy
Number of survivors in each
age group
Health-related quality of life Calculation of health-related weight ( ) Application of health-related
value to the number of survivors × Summation of health-adjusted years of survival
Health-adjusted years ofsurvival per person
Calculation of health-adjusted life expectancy
3. Health-Related Quality of Life
To calculate health-adjusted life expectancy, health-related quality of life should be applied to life expectancy. We used the report published by the Korea Health Panel in 2009.
The Korea Health Panel is a survey conducted by a consortium set up by the Korea Institute for Health and Social Affairs and the National Health Insurance Corporation, and it has generated annual data on individual health conditions, medical service use, medical expenses, etc. with 7,866 households as the original and ongoing sample since 2008. The survey covers information
Healthy Life Expectancy and Health Gains in Cardiovascular Diseases Management in Korea
16
on emergency service usage, hospitalization, outpatient service usage, chronic diseases, smoking, drinking, mobility, mental health, and quality of life.
Korea Health Panel uses EQ-5 for assessing health-related quality of life. EQ-5D is made of the five categories of “mobility”, “self-care”, “daily activities”, “pain/discomfort”, and “anxiety/depression”, with each category divided into three levels (no difficulty, slight difficulty, severe difficulty).
The overall results of the EQ-5D survey is shown in <Table 2-4> below. The No.1 health problem that the most number of respondents aged 18 and above admitted to suffer from was pain/discomfort, and the percentage of those on levels 2 and 3 was 28.11% and 1.43%, respectively. Next, respondents chose anxiety/depression (13.24%/0.49%), mobility (11.71%/0.23%), usual activities (7.14%/0.35%), and self-care (1.94%/0.20%) as their health problems in order of difficulty.
Table 2-4 Health profile: 2009
Mobility Self-care Usual activities Pain/ discomfort Anxiety/ depression Level 1 88.07 97.86 92.50 70.45 86.27 Level 2 11.71 1.94 7.14 28.11 13.24 Level 3 0.23 0.20 0.35 1.43 0.49
Age distribution of the five categories of EQ-5D is presented in <Table 2-5>. As expected, the respondents' subjective health conditions in the categories of mobility, self-care, usual activities, pain/discomfort, and anxiety/depression appeared to deteriorate
Chapter 2_Life Expectancy and Healthy Life Expectancy
17 as they get older. We could see that those aged 60 or older were especially vulnerable to pain/discomfort and mobility, with around 61% of respondents aged 70 years or above, and 44% of those in their 60s replying that they had experienced difficulty from pain/discomfort. Those who had slight or severe difficulties in mobility accounted for 21.85% among those in their 60s and 43.88% among those aged 70 or older.
Table 2-5 Health profile by age group
(Unit: %) 18-29 30-39 40-49 50-59 60-69 70+ Mobility Level 1 98.46 98.49 96.53 90.12 78.15 56.12 Level 2 1.54 1.51 3.40 9.74 21.61 42.68 Level 3 0.00 0.00 0.07 0.13 0.24 1.20 Self-care Level 1 99.88 99.64 99.30 98.47 96.52 91.31 Level 2 0.12 0.32 0.66 1.39 3.28 7.61 Level 3 0.00 0.04 0.04 0.13 0.20 1.08 Usual Level 1 98.59 98.45 97.42 93.53 86.04 75.21 activities Level 2 1.41 1.51 2.44 6.29 13.42 23.21 Level 3 0.00 0.04 0.15 0.18 0.54 1.59 Pain/ Level 1 88.01 84.21 78.26 68.16 56.00 38.93 discomfort Level 2 11.56 15.47 20.93 30.85 41.16 56.94 Level 3 0.43 0.32 0.81 0.99 2.84 4.12 Anxiety/ Level 1 86.36 89.34 88.93 87.34 83.64 78.63 depression Level 2 13.21 10.30 10.74 12.30 15.73 20.36 Level 3 0.43 0.36 0.33 0.36 0.64 1.01
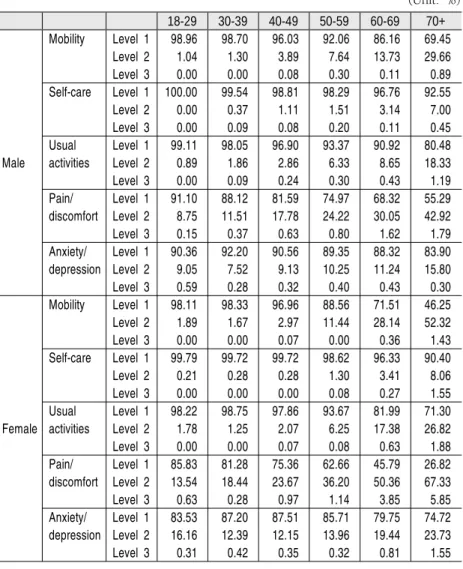
Health profile for men and women divided into age groups showed that health problems increased on the whole as they grew older, and that women had poorer overall health conditions compared to men.
Healthy Life Expectancy and Health Gains in Cardiovascular Diseases Management in Korea
18
Table 2-6 Health profile by gender
(Unit: %) 18-29 30-39 40-49 50-59 60-69 70+ Male Mobility Level 1 98.96 98.70 96.03 92.06 86.16 69.45 Level 2 1.04 1.30 3.89 7.64 13.73 29.66 Level 3 0.00 0.00 0.08 0.30 0.11 0.89 Self-care Level 1 100.00 99.54 98.81 98.29 96.76 92.55 Level 2 0.00 0.37 1.11 1.51 3.14 7.00 Level 3 0.00 0.09 0.08 0.20 0.11 0.45 Usual Level 1 99.11 98.05 96.90 93.37 90.92 80.48 activities Level 2 0.89 1.86 2.86 6.33 8.65 18.33 Level 3 0.00 0.09 0.24 0.30 0.43 1.19 Pain/ Level 1 91.10 88.12 81.59 74.97 68.32 55.29 discomfort Level 2 8.75 11.51 17.78 24.22 30.05 42.92 Level 3 0.15 0.37 0.63 0.80 1.62 1.79 Anxiety/ Level 1 90.36 92.20 90.56 89.35 88.32 83.90 depression Level 2 9.05 7.52 9.13 10.25 11.24 15.80 Level 3 0.59 0.28 0.32 0.40 0.43 0.30 Female Mobility Level 1 98.11 98.33 96.96 88.56 71.51 46.25 Level 2 1.89 1.67 2.97 11.44 28.14 52.32 Level 3 0.00 0.00 0.07 0.00 0.36 1.43 Self-care Level 1 99.79 99.72 99.72 98.62 96.33 90.40 Level 2 0.21 0.28 0.28 1.30 3.41 8.06 Level 3 0.00 0.00 0.00 0.08 0.27 1.55 Usual Level 1 98.22 98.75 97.86 93.67 81.99 71.30 activities Level 2 1.78 1.25 2.07 6.25 17.38 26.82 Level 3 0.00 0.00 0.07 0.08 0.63 1.88 Pain/ Level 1 85.83 81.28 75.36 62.66 45.79 26.82 discomfort Level 2 13.54 18.44 23.67 36.20 50.36 67.33 Level 3 0.63 0.28 0.97 1.14 3.85 5.85 Anxiety/ Level 1 83.53 87.20 87.51 85.71 79.75 74.72 depression Level 2 16.16 12.39 12.15 13.96 19.44 23.73 Level 3 0.31 0.42 0.35 0.32 0.81 1.55
To draw EQ-5D index, it is necessary to develop EQ-5D tariff. In Korea, a study on developing the weighted value for health-related quality of life (EQ-5D) of Korean people was
Chapter 2_Life Expectancy and Healthy Life Expectancy
19 reported as shown in the table below (Kang Eun-jeong et al., 20063); the Korea Center for Disease Control and Prevention, 2007; Cho Min-woo et al., 20084)).
Table 2-7 EQ-5D tariff in Korea
Kang et al. (2006) CDC (2007) Cho et al. (2008) Mobility level 2 0.003* 0.096 0.056 level 3 0.274 0.418 0.404 Self-care level 2 0.058 0.046 0.081 level 3 0.078 0.136 0.399 Usual activities level 2 0.045 0.051 0.084 level 3 0.134 0.208 0.301 Pain/discomfort level 2 0.049 0.037 0.076 level 3 0.132 0.151 0.297 Anxiety/depression level 2 0.044 0.043 0.077 level 3 0.102 0.158 0.391 Constant 0.164 0.050 0.019 N3 0.345 0.050 -0.242 I2sq1) 0.014 - -R-squared 0.4321 - 0.074
Note: 1) Square of (the number for level 2 - 1) *) Statistically nonsignificant on the 5% level
EQ-5D index is drawn by taking the utility weights calculated using the regression coefficient in the above table as dependent variables, treating the values of five categories (levels 1 to 3) as dummy variables and applying the weights to the 243 combinations of health conditions as shown in the following formula.
3) Kang Eun-jeong et al., A Valuation of Health Status Using EQ-5D, Korea Institute for Health and Social Affairs & Management Center for Health Promotion, 2006 4) Cho et al. Estimating Quality Weights for EQ-5D Health States with the Time
Healthy Life Expectancy and Health Gains in Cardiovascular Diseases Management in Korea
20
Health condition = b0 + b1 × mobility_level2 + b2 × mobility_level3 + b3 × self-care_level2 + b4 × self-care_level3 + ... In this study, the result of drawing EQ-5D index by applying EQ-5D tariff showed EQ-5D index of Model 2 to be highest at 0.945, followed by 0.940 of Model 3 and 0.903 of Model 1. The results show that EQ-5D index is lower for men than for women in general.
Table 2-8 EQ-5D index for Korean adults
Mean SD Min Max
Result of Model 1 0.903 0.155 -1.3 1.0 application of Model 2 0.945 0.098 -0.3 1.0 Korean weight Model 3 0.940 0.104 0.1 1.0
Note: Model 1 applied regression coefficient from Kang, et al.(2006), Model 2 applied that from CDC (2007) and Model 3 applied that from Cho, et al.(2008) to the Korea Health Panel, and all the subjects are adults aged 18 and above.
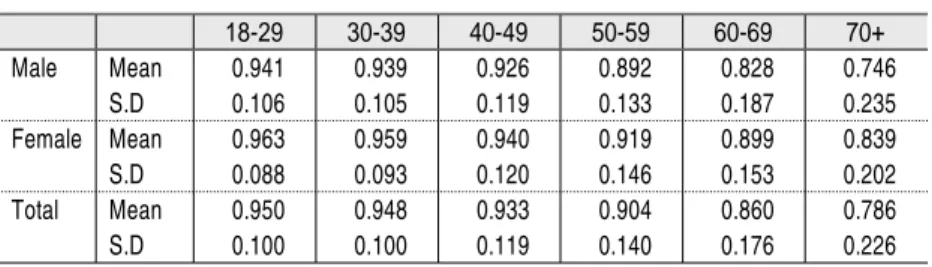
Table 2-9 Health-related quality of life for Korean adults by gender and age
18-29 30-39 40-49 50-59 60-69 70+ Male Mean 0.941 0.939 0.926 0.892 0.828 0.746 S.D 0.106 0.105 0.119 0.133 0.187 0.235 Female Mean 0.963 0.959 0.940 0.919 0.899 0.839 S.D 0.088 0.093 0.120 0.146 0.153 0.202 Total Mean 0.950 0.948 0.933 0.904 0.860 0.786 S.D 0.100 0.100 0.119 0.140 0.176 0.226
Note: Regression coefficient from Kang et al.(2006) was applied.
Among previous studies introducing regression coefficient for Korean adults, we chose the regression coefficient from Kang, et al.(2008) to draw health-adjusted life expectancy of Korean adults. As the EQ-5D questionnaire used by the Korea Health Panel was
Chapter 2_Life Expectancy and Healthy Life Expectancy
21 developed for people aged 18 and above, we referred to Manuel (2004) for utility weight for people aged between 0 and 19.
Table 2-10 Utility weight for people aged below 20
Male Female Total
0 0.97640 0.97460 0.97549
1 - 4 0.97640 0.97460 0.97549 5 - 9 0.97000 0.98570 0.97783 10 - 14 0.94780 0.94360 0.94574 15 - 19 0.93510 0.92870 0.93192
Note: Manuel DG, Schultz SE (2004)
4. Health-Adjusted Life Expectancy in Korea
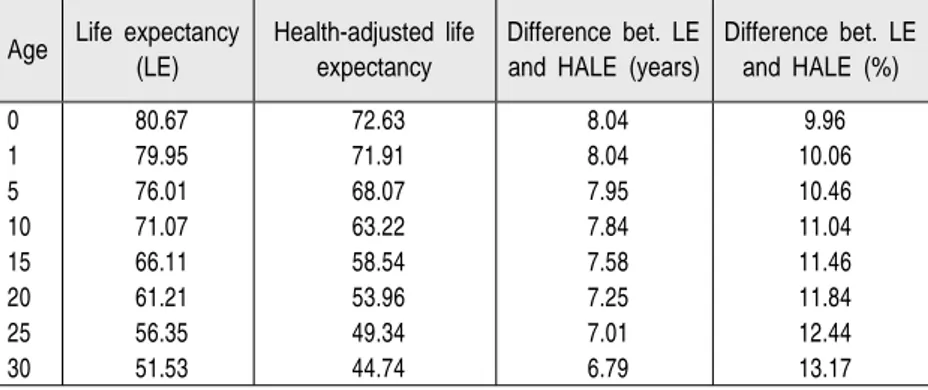
Health-adjusted life expectancy drawn based on EQ-5D appeared to be 72.63 in 2009. Men's health-adjusted life expectancy was 71.38 while women's was 73.37. The difference in life expectancy between men and women was 6.12 years, and the difference in health-adjusted life expectancy was 1.99 years. The fact that the difference in health-adjusted life expectancy between men and women was much smaller than the difference in life expectancy shows that women are in a comparatively worse condition in terms of the years in which they lead healthy lives.
Healthy Life Expectancy and Health Gains in Cardiovascular Diseases Management in Korea
22
Age Life expectancy (LE)
Health-adjusted life expectancy
Difference bet. LE and HALE (years)
Difference bet. LE and HALE (%) 0 80.67 72.63 8.04 9.96 1 79.95 71.91 8.04 10.06 5 76.01 68.07 7.95 10.46 10 71.07 63.22 7.84 11.04 15 66.11 58.54 7.58 11.46 20 61.21 53.96 7.25 11.84 25 56.35 49.34 7.01 12.44 30 51.53 44.74 6.79 13.17
Table 2-11 Life expectancy and health-adjusted life expectancy
(Unit: years) Male Female Total Life expectancy at age 0 76.80 82.92 80.67 Health-adjusted life expectancy at age 0 71.38 73.37 72.63 Difference in life expectancy between men and women 6.12
Difference in health-adjusted life expectancy between men
and women 1.99
Concerning health-adjusted life expectancy for different age groups, the figure for a person aged 0 was 72.63, while that for a 30-year-old person was 44.74 and that for a 60-year-old was 18.88. The difference between health-adjusted life expectancy and life expectancy was 8.04 for a person aged 0, 6.79 for a person aged 30 and 5.04 for a person aged 60.
Health-adjusted life expectancy took up 90.04% of life expectancy at birth. For a 65-year-old person, the number of years she/he would spend in ill health accounted for 23.45% of the life expectancy.
Table 2-12 Differences between LE and HALE
Chapter 2_Life Expectancy and Healthy Life Expectancy
23 Age Life expectancy
(LE)
Health-adjusted life expectancy
Difference bet. LE and HALE (years)
Difference bet. LE and HALE (%) 35 46.72 40.16 6.56 14.05 40 41.95 35.64 6.32 15.06 45 37.27 31.21 6.06 16.27 50 32.71 26.94 5.77 17.64 55 28.26 22.82 5.45 19.27 60 23.92 18.88 5.04 21.08 65 19.75 15.12 4.63 23.45 70 15.86 11.77 4.09 25.79 75 12.35 8.84 3.51 28.39 80 9.30 6.33 2.97 31.98 85 6.87 4.03 2.84 41.32 90 5.20 2.13 3.07 58.99
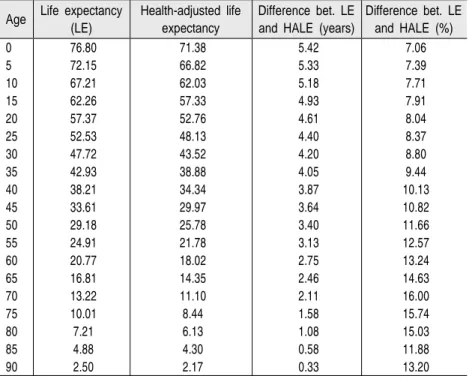
There was a difference of 5.42 years between men's life expectancy and health-adjusted life expectancy (76.80 years and 71.38 years, respectively) at birth. Also, the proportion of health-adjusted life expectancy in life expectancy was 92.94%, which means 7.06% of their life would be spent in poor health conditions related to, for example, chronic diseases. Health-adjusted life expectancy at 45 for men was 34.34 years, and its difference from the life expectancy was 3.64 years. For men aged 65, health-adjusted life expectancy was 14.35 years and its gap with the life expectancy was 2.46 years.
Healthy Life Expectancy and Health Gains in Cardiovascular Diseases Management in Korea
24
Table 2-13 Health-adjusted life expectancy: Male
Age Life expectancy (LE)
Health-adjusted life expectancy
Difference bet. LE and HALE (years)
Difference bet. LE and HALE (%) 0 76.80 71.38 5.42 7.06 5 72.15 66.82 5.33 7.39 10 67.21 62.03 5.18 7.71 15 62.26 57.33 4.93 7.91 20 57.37 52.76 4.61 8.04 25 52.53 48.13 4.40 8.37 30 47.72 43.52 4.20 8.80 35 42.93 38.88 4.05 9.44 40 38.21 34.34 3.87 10.13 45 33.61 29.97 3.64 10.82 50 29.18 25.78 3.40 11.66 55 24.91 21.78 3.13 12.57 60 20.77 18.02 2.75 13.24 65 16.81 14.35 2.46 14.63 70 13.22 11.10 2.11 16.00 75 10.01 8.44 1.58 15.74 80 7.21 6.13 1.08 15.03 85 4.88 4.30 0.58 11.88 90 2.50 2.17 0.33 13.20
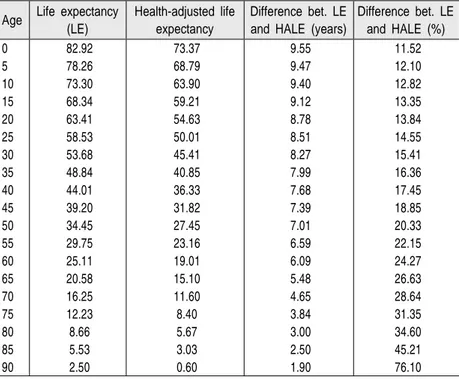
The difference between life expectancy and health-adjusted life at birth for women was 9.55 years. The proportion of health-adjusted life expectancy om life expectancy was 88.48%, which was smaller than men's 92.94%. This shows that women suffer from diseases and health deterioration for longer periods than men.
Health-adjusted life expectancy at 45 was 31.82 years, shorter than the 34.34 years for men. On the other hand, health-adjusted life expectancy for women aged 65 was 15.10 years, slightly longer than the 14.35 years for men of the same age. This implies that women at age 65 would spend around 26.63% of their
Chapter 2_Life Expectancy and Healthy Life Expectancy
25 remaining life in ill health.
Table 2-14 Health-adjusted life expectancy: Female
Age Life expectancy (LE)
Health-adjusted life expectancy
Difference bet. LE and HALE (years)
Difference bet. LE and HALE (%) 0 82.92 73.37 9.55 11.52 5 78.26 68.79 9.47 12.10 10 73.30 63.90 9.40 12.82 15 68.34 59.21 9.12 13.35 20 63.41 54.63 8.78 13.84 25 58.53 50.01 8.51 14.55 30 53.68 45.41 8.27 15.41 35 48.84 40.85 7.99 16.36 40 44.01 36.33 7.68 17.45 45 39.20 31.82 7.39 18.85 50 34.45 27.45 7.01 20.33 55 29.75 23.16 6.59 22.15 60 25.11 19.01 6.09 24.27 65 20.58 15.10 5.48 26.63 70 16.25 11.60 4.65 28.64 75 12.23 8.40 3.84 31.35 80 8.66 5.67 3.00 34.60 85 5.53 3.03 2.50 45.21 90 2.50 0.60 1.90 76.10
Ch
apt
er
03
Gains in HALE after
Eliminating Stroke and Risk
29
Chapter 3
Gains in HALE after Eliminating Stroke and
Risk Factors
1. Methods
The National Health Promotion Plan 2020 has set as one of its main goals the prevention of cardio-cerebrovascular diseases through improvement of self-care ability and prolonged treatment of predisposing diseases including hypertension, diabetes, and hyperlipidemia. Also, it aims to reduce deaths and disabilities related to cardio-cerebrovascular diseases through proper actions and treatment in pre-hospital and hospital stages when these diseases occur.
With continued increase in prevalence rates of hypertension and diabetes, which are predisposing diseases of cardio-cerebrovascular diseases, individual and social burdens created by these diseases are also growing. Although cardio-cerebrovascular diseases are not frequently observed in people younger than 30, their occurrence rapidly increases after 60 years of age and men tend to get these diseases at younger ages than women (British Heart Foundation, 2008). Likewise, cardio-cerebrovascular diseases are affected by non-modifiable factors such as age and sex, as well as modifiable factors such as cholesterol, smoking, drinking, hypertension, exercise and diabetes. Factors that affect cardio-cerebrovascular diseases include common diseases such as hypertension, diabetes and hyperlipidemia, and habitual factors such as smoking, drinking,
Healthy Life Expectancy and Health Gains in Cardiovascular Diseases Management in Korea
30
physical activities, and eating habits. Sociopsychological factors and environmental factors also influence cardio-cerebrovascular diseases. For example, Shinton and Beevers (1989) presented the result of meta-analysis on the relationship between smoking and strokes, and showed that the relative risk of strokes for smokers was at 1.5 (95% confidence interval 1.4~1.6). Relative risks for specific diseases were 1.9 for cerebral infarction and 2.9 for subarachnoid hemorrhage. In terms of different age groups, relative risk for people less than 55 was 2.9, while that for people between 55 and 75 was 1.8 and that for those older than 75 was 1.1. In addition, people who used to smoke appeared to have relative risk of 1.2 in all age groups.
In this part of the study, we would like to analyze the expected effects of the management of predisposing diseases to stroke through EQ-5D index, which was proposed as the overall goal of HP 2020. In this relation, we examined the increments in life expectancy and health-adjusted life expectancy when cause deletion was made.
Cause-deleted life table is made by assuming that a specific cause was completely deleted through prevention or treatment of the disease and calculating the mortality or death probability.
As a result of cause deletion, we can draw the healthy life expectancy adjusted by health-related quality of life in the case people live with diseases other than the specific disease that was prevented or treated. In this case, the figure is influenced by the number of patients with the specific disease, and thus, the weighted value of health-related quality of life, where the specific cause has been deleted is calculated according to the following formula:
Chapter 3_Gains in HALE after Eliminating Stroke and Risk Factors 31 × EQ: Cause-deleted EQ EQt: Total EQ
EQc: EQ of the specific cause (disease) Pc: Prevalence of the specific cause
By applying the weighted value of health-related quality of life to life table and analyzing it in the above-mentioned way, cause-deleted health-adjusted life expectancy can be drawn.
2. Diabetes-eliminated HALE Gains
Diabetes leads to enormous costs related to the disease and deaths, and it brings considerable burden to the quality of life of those afflicted. Diabetes can be accompanied by various complications and premature deaths. In the long term, diabetes can lead to circulatory problems, renal failure and eye troubles, while at the same time, deteriorating the quality of life and increasing the use of medical services. Preventable hospitalization enhances diabetes complications. Moreover, diabetes patients are reported to experience severe limitation of activities and to be less healthy compared to those without the disease. Indices that measure health conditions of population groups are highly important means for development of health policies. Health-adjusted life expectancy (HALE) is a relatively new criterion showing people's health conditions in relation to mortality
Healthy Life Expectancy and Health Gains in Cardiovascular Diseases Management in Korea
32
rate and morbidity rate. HALE is drawn by excluding years spent in unhealthy state or with diseases from life expectancy. Diabetes is an important factor in evaluating a health index because it has potential influence on mortality and morbidity rates.
The following table shows the rate of mortality caused by diabetes in 2009. Mortality due to diabetes was 114.73 per 1,000 people for those in the 70-74 age group and 292.39 for those in the 80-84 age group, and men were found to have higher rate of mortality caused by diabetes than women.
Table 3-1 Mortality caused by diabetes: 2009
(Unit: 100,000 people)
Age
Male Female Total
No. of deaths Mortality rate No. of deaths Mortality rate No. of deaths Mortality rate 0 0 0.00 0 0.00 0 0.00 1 - 4 0 0.00 0 0.00 0 0.00 5 - 9 1 0.07 0 0.00 1 0.04 10 - 14 1 0.06 1 0.06 2 0.06 15 - 19 0 0.00 3 0.18 3 0.09 20 - 24 1 0.06 4 0.27 5 0.16 25 - 29 6 0.30 12 0.63 18 0.46 30 - 34 19 0.96 11 0.58 30 0.77 35 - 39 41 1.78 15 0.68 56 1.24 40 - 44 93 4.19 35 1.63 128 2.93 45 - 49 235 10.60 58 2.71 293 6.73 50 - 54 355 18.30 87 4.55 442 11.47 55 - 59 387 29.27 136 10.20 523 19.69 60 - 64 479 46.00 200 18.31 679 31.83 65 - 69 704 80.11 513 49.55 1,217 63.58 70 - 74 927 143.40 815 93.48 1,742 114.73 75 - 79 805 229.63 1,049 172.38 1,854 193.30 80 - 84 528 320.68 1,033 279.78 1,561 292.39 85 - 89 281 409.45 614 340.16 895 359.25 90 or above 96 482.70 212 289.08 308 330.38
Chapter 3_Gains in HALE after Eliminating Stroke and Risk Factors
33 Life expectancy at birth was measured to increase by 0.41 years to 81.08 years in the absence of diabetes-induced deaths. Life expectancy at birth for men was measured to be 76.80 years, which was found to increase by 0.35 years to 77.15 years in the absence of diabetes-related deaths. Life expectancy at birth for women, 82.92 years, would increase to 83.25 years in the absence of diabetes-related deaths.
Table 3-2 Life expectancy after eliminating diabetes
(Unit: years)
Age Life expectancy
Diabetes-deleted life
expectancy Increment Male Female Total Male Female Total Male Female Total 0 76.80 82.92 80.67 77.15 83.25 81.08 0.35 0.32 0.41 1 76.08 82.18 79.95 76.43 82.51 80.36 0.35 0.32 0.41 5 72.15 78.26 76.01 72.50 78.58 76.43 0.35 0.33 0.41 10 67.21 73.30 71.07 67.56 73.62 71.48 0.35 0.33 0.41 15 62.26 68.34 66.11 62.61 68.66 66.53 0.35 0.33 0.41 20 57.37 63.41 61.21 57.72 63.74 61.63 0.35 0.32 0.41 25 52.53 58.53 56.35 52.88 58.85 56.77 0.35 0.32 0.42 30 47.72 53.68 51.53 48.07 54.00 51.94 0.35 0.32 0.42 35 42.93 48.84 46.72 43.29 49.16 47.14 0.35 0.32 0.41 40 38.21 44.01 41.95 38.56 44.33 42.37 0.35 0.32 0.41 45 33.61 39.20 37.27 33.96 39.53 37.68 0.35 0.32 0.41 50 29.18 34.45 32.71 29.52 34.77 33.12 0.34 0.32 0.41 55 24.91 29.75 28.26 25.23 30.06 28.66 0.32 0.31 0.39 60 20.77 25.11 23.92 21.07 25.41 24.30 0.30 0.30 0.38 65 16.81 20.58 19.75 17.08 20.87 20.10 0.27 0.29 0.36 70 13.22 16.25 15.86 13.45 16.50 16.19 0.23 0.25 0.32 75 10.01 12.23 12.35 10.19 12.43 12.62 0.18 0.20 0.27 80 7.21 8.66 9.30 7.33 8.79 9.50 0.12 0.13 0.20 85 4.88 5.53 6.87 4.94 5.59 7.01 0.06 0.06 0.14 90 2.50 2.50 5.20 2.50 2.50 5.29 0.00 0.00 0.09
Healthy Life Expectancy and Health Gains in Cardiovascular Diseases Management in Korea
34
In the absence of diabetes deaths, HALE at birth would rise by 0.58 years to 73.21 years. This shows the absence of diabetes would increase HALE more than life expectancy in general, by 0.58 and 0.41 respectively. In the case of men, HALE at birth was 71.38, and it increased by 0.45 to 71.38 after cause deletion of diabetes. HALE at birth for women, 73.37, rose by 0.66 years to 74.03 in the absence of diabetes deaths.
Table 3-3 HALE after eliminating diabetes
(Unit: years) Age HALE (A) Diabetes-deleted HALE (B) Increment (B-A)
Male Female Male Female Male Female 0 71.38 73.37 71.83 74.03 0.45 0.66 1 70.66 72.63 71.12 73.29 0.45 0.67 5 66.82 68.79 67.27 69.46 0.45 0.67 10 62.03 63.90 62.48 64.57 0.45 0.67 15 57.33 59.21 57.79 59.88 0.45 0.67 20 52.76 54.63 53.22 55.30 0.46 0.67 25 48.13 50.01 48.59 50.62 0.46 0.60 30 43.52 45.41 43.96 45.97 0.44 0.57 35 38.88 40.85 39.31 41.38 0.43 0.53 40 34.34 36.33 34.77 36.85 0.43 0.52 45 29.97 31.82 30.40 32.34 0.43 0.52 50 25.78 27.45 26.20 27.96 0.42 0.52 55 21.78 23.16 22.19 23.62 0.41 0.46 60 18.02 19.01 18.40 19.44 0.38 0.43 65 14.35 15.10 14.70 15.53 0.35 0.43 70 11.10 11.60 11.39 11.98 0.29 0.38 75 8.44 8.40 8.64 8.71 0.21 0.31 80 6.13 5.67 6.30 5.76 0.17 0.10 85 4.30 3.03 4.41 3.10 0.11 0.07 90 2.17 0.60 2.17 0.60 0.00 0.00
Chapter 3_Gains in HALE after Eliminating Stroke and Risk Factors
35 Age
Difference (years) of life spent in ill health
Difference (%) of life spent in ill health Male Female Male Female
0 5.32 9.21 6.89 11.07 1 5.32 9.22 6.95 11.17 5 5.23 9.12 7.21 11.61 10 5.08 9.06 7.52 12.30 15 4.82 8.78 7.70 12.79 20 4.51 8.43 7.81 13.23 25 4.29 8.24 8.12 13.99 30 4.12 8.03 8.56 14.87 35 3.97 7.78 9.18 15.83 40 3.79 7.48 9.83 16.88 45 3.56 7.19 10.47 18.18 50 3.32 6.81 11.25 19.58 55 3.05 6.44 12.07 21.42 60 2.67 5.97 12.67 23.50 65 2.38 5.33 13.94 25.57 70 2.06 4.52 15.30 27.41 75 1.55 3.73 15.20 29.97 80 1.03 3.03 14.00 34.47 85 0.53 2.49 10.74 44.59 90 0.33 1.90 13.20 76.10
As shown above, the difference between life expectancy and health-adjusted life expectancy at birth in the absence of diabetes deaths was 7.87 years. Also, the proportion of their life in ill health was 9.71%. For men, the difference between life expectancy and HALE at the time of cause deletion of diabetes was 5.32, while that for women was larger at 9.21. The difference between life expectancy and HALE for men at age 65 was 2.38 after cause deletion of diabetes and 5.33 for women of the same age, with the proportion of years in ill health within remaining life at 13.94% for men and 25.57% for women.
Table 3-4 Differences between LE and HALE after diabetes deletion
Healthy Life Expectancy and Health Gains in Cardiovascular Diseases Management in Korea
36
3. Hypertension-eliminated HALE Gains
Hypertension is one of the major risk factors for cardiovascular diseases. As demonstrated by WHO’s report in 2002, 50% of cardiovascular diseases and 75% of strokes are caused by increases in blood pressure. Thus, hypertension is considered one of the key risk factors that bring deaths and disabilities.
Hypertension often leads to premature deaths or reduced life. Due to the high morbidity among the population with hypertension, reports on deaths and life expectancy are not sufficient to show the burden of the chronic disease. This report presents results related to health-adjusted life expectancy. HALE is an index that can be used as a health standard of people. Life expectancy is average years of survival during which people are expected to live, but HALE is life expectancy that reflects quality of living related to health. This integrates morbidity rate and mortality rate as a single index for people's health, and indicates the average years during which a person can live in healthy state. Assessment of the difference between life expectancy and HALE of people who suffer from hypertension and those who don’t, proportion of years in unhealthy state and reduced lifespan helps us to understand how hypertension changes people’s lives on the whole. In 2009, the rate of mortality caused by diseases related to hypertension was 32.60 per 100,000 for people aged between 70 and 74, and 199.49 for those aged between 80 and 84. Women’s mortality per 100,000 people due to diseases related to hypertension was lower than men's before 75, but after 75, women’s mortality related to hypertension exceeded men’s.
Chapter 3_Gains in HALE after Eliminating Stroke and Risk Factors
37
Table 3-5 Mortality due to hypertension
(Unit: 100,000 people)
Age
Male Female Total
No. of deaths Mortality rate No. of deaths Mortality rate No. of deaths Mortality rate 0 0 0.00 0 0.00 0 0.00 1 - 4 0 0.00 0 0.00 0 0.00 5 - 9 0 0.00 0 0.00 0 0.00 10 - 14 0 0.00 0 0.00 0 0.00 15 - 19 0 0.00 0 0.00 0 0.00 20 - 24 0 0.00 0 0.00 0 0.00 25 - 29 3 0.15 0 0.00 3 0.08 30 - 34 3 0.15 2 0.11 5 0.13 35 - 39 8 0.35 6 0.27 14 0.31 40 - 44 15 0.68 8 0.37 23 0.53 45 - 49 32 1.44 8 0.37 40 0.92 50 - 54 59 3.04 22 1.15 81 2.10 55 - 59 76 5.75 36 2.70 112 4.22 60 - 64 100 9.60 43 3.94 143 6.70 65 - 69 140 15.93 115 11.11 255 13.32 70 - 74 223 34.50 272 31.20 495 32.60 75 - 79 243 69.32 488 80.19 731 76.22 80 - 84 265 160.95 800 216.67 1,065 199.49 85 - 89 230 335.14 806 446.53 1,036 415.85 90 or above 125 628.52 620 845.41 745 799.14
In the absence of hypertension-related deaths, life expectancy at birth was estimated to increase by 0.22 years to 80.90 years on average, by 0.10 years to 76.90 years for men, and by 0.17 years to 83.07 years for women.
Healthy Life Expectancy and Health Gains in Cardiovascular Diseases Management in Korea
38
Table 3-6 Life expectancy in the absence of hypertension-related deaths
(Unit: years)
Age Life expectancy
Life expectancy in the absence of hypertension-related
deaths
Increment
Male Female Male Female Male Female 0 76.80 82.92 76.90 83.09 0.10 0.17 1 76.08 82.18 76.18 82.35 0.10 0.17 5 72.15 78.26 72.25 78.42 0.10 0.17 10 67.21 73.30 67.31 73.46 0.10 0.17 15 62.26 68.34 62.36 68.50 0.10 0.17 20 57.37 63.41 57.47 63.58 0.10 0.17 25 52.53 58.53 52.63 58.69 0.10 0.17 30 47.72 53.68 47.82 53.84 0.10 0.17 35 42.93 48.84 43.03 49.00 0.10 0.17 40 38.21 44.01 38.31 44.18 0.10 0.17 45 33.61 39.20 33.71 39.37 0.10 0.17 50 29.18 34.45 29.28 34.62 0.10 0.17 55 24.91 29.75 25.01 29.91 0.10 0.17 60 20.77 25.11 20.86 25.27 0.10 0.17 65 16.81 20.58 16.91 20.74 0.09 0.16 70 13.22 16.25 13.31 16.41 0.09 0.16 75 10.01 12.23 10.09 12.38 0.08 0.15 80 7.21 8.66 7.28 8.79 0.07 0.12 85 4.88 5.53 4.93 5.60 0.05 0.07 90 2.50 2.50 2.50 2.50 0.00 0.00
HALE at birth in the absence of hypertension-related diseases was found to rise by 0.95 years to 73.59 years, an increase greater than in the case of life expectancy. The absence of hypertension-related deaths was measured to increase HALE at birth by 0.44 years to 71.82 years for men and by 0.83 years to 74.20 years for women.
Chapter 3_Gains in HALE after Eliminating Stroke and Risk Factors
39
Table 3-7 HALE in the absence of hypertension-related diseases
(Unit: years)
Age HALE
HALE in the absence of hypertension-related
deaths
Increment Male Female Male Female Male Female 0 71.38 73.37 71.82 74.20 0.44 0.83 1 70.66 72.63 71.11 73.46 0.44 0.83 5 66.82 68.79 67.26 69.63 0.44 0.84 10 62.03 63.90 62.47 64.73 0.44 0.84 15 57.33 59.21 57.77 60.05 0.44 0.84 20 52.76 54.63 53.21 55.47 0.44 0.84 25 48.13 50.01 48.58 50.85 0.45 0.84 30 43.52 45.41 43.97 46.25 0.45 0.84 35 38.88 40.85 39.33 41.69 0.45 0.84 40 34.34 36.33 34.79 37.17 0.45 0.84 45 29.97 31.82 30.43 32.66 0.46 0.85 50 25.78 27.45 26.22 28.29 0.44 0.84 55 21.78 23.16 22.24 23.96 0.46 0.80 60 18.02 19.01 18.45 19.80 0.43 0.79 65 14.35 15.10 14.76 15.90 0.41 0.80 70 11.10 11.60 11.54 12.29 0.43 0.69 75 8.44 8.40 8.70 9.09 0.26 0.70 80 6.13 5.67 6.55 6.26 0.42 0.60 85 4.30 3.03 4.55 3.46 0.25 0.43 90 2.17 0.60 2.27 0.92 0.10 0.32
As seen above, the difference between life expectancy at birth and HALE at birth in the absence of hypertension-related diseases was 7.31 years. The proportion of life in ill health was around 9.04%. The difference was 5.08 years for men and 8.89 years for women. In the case of men aged 65, the difference between the two life expectancies after the cause deletion was 2.14, while the difference for women of the same age was 4.84. The proportion of life that they should spend in ill health was 12.69% for men aged 65 and 23.33% for women of the same age.
Healthy Life Expectancy and Health Gains in Cardiovascular Diseases Management in Korea
40
Table 3-8 Difference between life expectancy and HALE after deletion of hypertension-related diseases
(Unit: years)
Age
Difference (years) of life spent in ill health
Difference (%) of life spent in ill health Male Female Male Female
0 5.08 8.89 6.61 10.70 1 5.08 8.89 6.66 10.80 5 4.99 8.80 6.90 11.22 10 4.84 8.73 7.19 11.88 15 4.58 8.45 7.35 12.34 20 4.27 8.10 7.42 12.75 25 4.05 7.84 7.70 13.36 30 3.85 7.60 8.06 14.11 35 3.71 7.31 8.61 14.92 40 3.52 7.01 9.19 15.86 45 3.28 6.71 9.73 17.04 50 3.06 6.33 10.44 18.28 55 2.77 5.96 11.07 19.91 60 2.41 5.47 11.57 21.65 65 2.14 4.84 12.69 23.33 70 1.77 4.12 13.29 25.11 75 1.39 3.29 13.79 26.54 80 0.73 2.52 10.01 28.72 85 0.38 2.14 7.67 38.22 90 0.23 1.58 9.19 63.22
4. Stroke-eliminated HALE Gains
Concerning the mortality caused by cerebrovascular diseases in 2009, it was 260.09 per 100,000 for people aged from 70 to 74, and 900.06 for those aged from 80 to 84. Men appeared to have higher mortality rate caused by cerebrovascular diseases than women.
Chapter 3_Gains in HALE after Eliminating Stroke and Risk Factors
41
Table 3-9 Mortality caused by stroke
(Unit: 100,000 people)
Age
Male Female Total
No. of deaths Mortality rate No. of deaths Mortality rate No. of deaths Mortality rate 0 6 2.61 2 0.94 8 1.81 1 - 4 1 0.11 3 0.34 4 0.22 5 - 9 3 0.22 1 0.08 4 0.15 10 - 14 5 0.29 1 0.06 6 0.18 15 - 19 8 0.43 6 0.37 14 0.40 20 - 24 18 1.10 6 0.40 24 0.77 25 - 29 17 0.85 24 1.27 41 1.05 30 - 34 45 2.28 32 1.68 77 1.99 35 - 39 151 6.57 51 2.32 202 4.49 40 - 44 257 11.57 118 5.48 375 8.57 45 - 49 472 21.29 196 9.17 668 15.34 50 - 54 587 30.26 305 15.94 892 23.15 55 - 59 667 50.45 255 19.12 922 34.72 60 - 64 915 87.86 457 41.85 1,372 64.31 65 - 69 1,612 183.43 904 87.32 2,516 131.45 70 - 74 2,231 345.11 1,718 197.05 3,949 260.09 75 - 79 2,167 618.14 2,663 437.60 4,830 503.59 80 - 84 1,877 1,139.99 2,933 794.37 4,810 900.96 85 - 89 1,178 1,716.50 2,325 1,288.07 3,503 1,406.09 90 or above 431 2,167.14 1,187 1,618.56 1,618 1,735.59
Note: Cerebrovascular diseases (I60-I69)
Life expectancy after cause deletion of cerebrovascular diseases at age 0 was 81.86, 1.19 up from the general life expectancy of 80.67. For men, life expectancy in general of 76.80 at age 0 was expected to rise by 0.91 to 77.71 after cause deletion of cerebrovascular diseases. In the case of women, life expectancy of 82.92 at age 0 was estimated to increase to 83.77 after the cause deletion, showing an increment of 0.84.
Healthy Life Expectancy and Health Gains in Cardiovascular Diseases Management in Korea
42
Table 3-10 Life expectancy after stroke deletion
(Unit: years)
Age Life expectancy
Life expectancy after
cause deletion Increment Male Female Male Female Male Female 0 76.80 82.92 77.71 83.77 0.91 0.84 1 76.08 82.18 76.99 83.03 0.91 0.85 5 72.15 78.26 73.06 79.10 0.91 0.85 10 67.21 73.30 68.12 74.14 0.91 0.85 15 62.26 68.34 63.17 69.18 0.91 0.85 20 57.37 63.41 58.28 64.26 0.91 0.85 25 52.53 58.53 53.44 59.37 0.91 0.85 30 47.72 53.68 48.63 54.52 0.91 0.85 35 42.93 48.84 43.85 49.68 0.91 0.84 40 38.21 44.01 39.11 44.85 0.90 0.84 45 33.61 39.20 34.50 40.04 0.89 0.83 50 29.18 34.45 30.06 35.28 0.87 0.82 55 24.91 29.75 25.77 30.55 0.86 0.80 60 20.77 25.11 21.59 25.89 0.83 0.79 65 16.81 20.58 17.60 21.33 0.79 0.75 70 13.22 16.25 13.93 16.95 0.71 0.70 75 10.01 12.23 10.61 12.83 0.60 0.59 80 7.21 8.66 7.66 9.09 0.45 0.42 85 4.88 5.53 5.12 5.74 0.24 0.21 90 2.50 2.50 2.50 2.50 0.00 0.00
Health-adjusted life expectancy at 0 was 72.63, while after cause deletion of cerebrovascular diseases, it grew by 0.97 to 73.60. The increment in life expectancy after the cause deletion was 1.19 compared to that of 0.97 in HALE, indicating that life expectancy increased further than HALE. Among men aged 0, HALE in general was 71.38, and it rose by 1.04 to 72.42 by deleting the cause of cerebrovascular diseases. As for women, HALE of 73.37 at age 0 grew to 74.38 after the cause deletion, with an increment of 1.01.
Chapter 3_Gains in HALE after Eliminating Stroke and Risk Factors
43
Table 3-11 Health-adjusted life expectancy after stroke deletion
(Unit: years)
Age HALE
HALE after cause
deletion Increment Male Female Male Female Male Female 0 71.38 73.37 72.42 74.38 1.04 1.01 1 70.66 72.63 71.70 73.64 1.04 1.01 5 66.82 68.79 67.86 69.80 1.04 1.01 10 62.03 63.90 63.06 64.91 1.04 1.01 15 57.33 59.21 58.37 60.23 1.04 1.01 20 52.76 54.63 53.80 55.65 1.04 1.01 25 48.13 50.01 49.17 51.03 1.04 1.01 30 43.52 45.41 44.56 46.42 1.04 1.01 35 38.88 40.85 39.92 41.86 1.04 1.01 40 34.34 36.33 35.37 37.34 1.03 1.01 45 29.97 31.82 30.99 32.81 1.02 0.99 50 25.78 27.45 26.78 28.43 1.00 0.98 55 21.78 23.16 22.75 24.13 0.97 0.97 60 18.02 19.01 18.91 19.97 0.89 0.95 65 14.35 15.10 15.22 15.99 0.86 0.89 70 11.10 11.60 11.89 12.44 0.79 0.84 75 8.44 8.40 9.10 9.12 0.67 0.72 80 6.13 5.67 6.57 5.95 0.45 0.28 85 4.30 3.03 4.55 3.17 0.24 0.14 90 2.17 0.60 2.17 0.60 0.00 0.00
As seen above, the difference between life expectancy and health-adjusted life expectancy after cause deletion of cerebrovascular diseases was 8.26 years at age 0, which means that these people would spend an average of 8.26 years of their life in ill health. The proportion of life in ill health was estimated to be around 10.09%. In men’s case, the difference between life expectancy and HALE after cause deletion of cerebrovascular diseases was 5.30 years, and in women’s case, the difference was 9.39 years, which was much larger than men’s. For men
Healthy Life Expectancy and Health Gains in Cardiovascular Diseases Management in Korea
44
aged 65, the difference between the two types of life expectancies after cause deletion of cerebrovascular diseases was 2.38, while in the case of women of the same age, the difference was 5.35. The proportion of remaining years in ill health was 13.54% for men and 25.06% for women at this age.
Table 3-12 Differences between LE and HALE after stroke deletion
(Unit: years, %)
Age
Difference (years) of life spent in ill health
Difference (%) of life spent in ill health Male Female Male Female
0 5.30 9.39 6.82 11.21 1 5.29 9.39 6.87 11.31 5 5.20 9.30 7.12 11.76 10 5.06 9.23 7.42 12.46 15 4.80 8.96 7.60 12.95 20 4.48 8.61 7.69 13.40 25 4.27 8.35 7.99 14.06 30 4.07 8.10 8.37 14.86 35 3.92 7.82 8.95 15.75 40 3.74 7.52 9.56 16.76 45 3.51 7.23 10.18 18.06 50 3.28 6.85 10.90 19.40 55 3.02 6.42 11.70 21.02 60 2.68 5.93 12.43 22.89 65 2.38 5.35 13.54 25.06 70 2.04 4.51 14.64 26.63 75 1.51 3.71 14.22 28.89 80 1.09 3.14 14.24 34.53 85 0.58 2.57 11.26 44.77 90 0.33 1.90 13.20 76.10
Meanwhile, mortality caused by heart diseases in 2009 was 119.93 per 100,000 people for people aged between 70 and 74,
Chapter 3_Gains in HALE after Eliminating Stroke and Risk Factors
45 and 405.15 for those between 80 and 84. Men showed higher rate of mortality caused by heart diseases compared to women.
Table 3-13 Mortality caused by heart diseases
(Unit: 100,000 years)
Age
Male Female Total
No. of deaths Mortality rate No. of deaths Mortality rate No. of deaths Mortality rate 0 0 0.00 0 0.00 0 0.00 1 - 4 0 0.00 0 0.00 0 0.00 5 - 9 1 0.07 1 0.08 2 0.08 10 - 14 0 0.00 0 0.00 0 0.00 15 - 19 4 0.22 4 0.25 8 0.23 20 - 24 3 0.18 1 0.07 4 0.13 25 - 29 19 0.95 2 0.11 21 0.54 30 - 34 44 2.23 3 0.16 47 1.21 35 - 39 111 4.83 14 0.64 125 2.78 40 - 44 227 10.22 34 1.58 261 5.97 45 - 49 369 16.64 49 2.29 418 9.60 50 - 54 536 27.63 95 4.97 631 16.38 55 - 59 563 42.59 97 7.27 660 24.85 60 - 64 610 58.58 188 17.21 798 37.40 65 - 69 897 102.07 363 35.06 1,260 65.83 70 - 74 1,065 164.74 756 86.71 1,821 119.93 75 - 79 980 279.55 1,178 193.58 2,158 225.00 80 - 84 827 502.28 1,336 361.84 2,163 405.15 85 - 89 531 773.74 1,083 599.99 1,614 647.85 90 or above 431 2,167.14 1,187 1,618.56 1,618 1,735.59
Note: Ischemic heart diseases (I20-I25)
Life expectancy in general was 80.67 for people aged 0, but after cause deletion of heart diseases, it rose by 0.64 to 81.31. For men of age 0, the overall life expectancy of 76.80 was expected to grow by 0.49 to 77.30. In the case of women aged 0, their life expectancy of 82.92 increased to 83.27 after the
Healthy Life Expectancy and Health Gains in Cardiovascular Diseases Management in Korea
46
cause deletion, showing an increment of 0.35.
Table 3-14 Life expectancy after cause deletion of heart diseases
(Unit: years)
Age Life expectancy
Life expectancy after
cause deletion Increment Male Female Male Female Male Female 0 76.80 82.92 77.30 83.27 0.49 0.35 1 76.08 82.18 76.58 82.54 0.50 0.35 5 72.15 78.26 72.64 78.61 0.50 0.35 10 67.21 73.30 67.70 73.65 0.50 0.35 15 62.26 68.34 62.75 68.69 0.50 0.35 20 57.37 63.41 57.87 63.76 0.50 0.35 25 52.53 58.53 53.03 58.88 0.50 0.35 30 47.72 53.68 48.22 54.03 0.50 0.35 35 42.93 48.84 43.43 49.19 0.49 0.35 40 38.21 44.01 38.69 44.36 0.49 0.35 45 33.61 39.20 34.08 39.56 0.47 0.35 50 29.18 34.45 29.64 34.80 0.46 0.35 55 24.91 29.75 25.34 30.09 0.43 0.35 60 20.77 25.11 21.16 25.45 0.40 0.34 65 16.81 20.58 17.18 20.91 0.36 0.33 70 13.22 16.25 13.53 16.56 0.31 0.31 75 10.01 12.23 10.28 12.50 0.26 0.26 80 7.21 8.66 7.41 8.85 0.20 0.19 85 4.88 5.53 4.99 5.63 0.11 0.10 90 2.50 2.50 2.50 2.50 0.00 0.00
Note: Ischemic heart diseases (I20-I25)
Cause deletion of heart diseases is estimated to bring an increment of 0.50 in HALE from 72.63 to 73.14 at age 0. Increment in life expectancy after the cause deletion was 0.64, which was bigger than 0.50 of that in HALE. Men's HALE at age 0 was 71.38, and it grew 0.43 to 71.82 after the cause of heart diseases was deleted. For women, whose HALE was 73.37 at age 0,
Chapter 3_Gains in HALE after Eliminating Stroke and Risk Factors
47 the cause deletion led to an increase of 0.40 to 73.76.
Table 3-15 Health-adjusted life expectancy after cause deletion of heart diseases
(Unit: years) Age HALE HALE after cause deletion Increment
Male Female Male Female Male Female 0 71.38 73.37 71.82 73.76 0.43 0.40 1 70.66 72.63 71.10 73.02 0.43 0.40 5 66.82 68.79 67.25 69.19 0.44 0.40 10 62.03 63.90 62.46 64.30 0.44 0.40 15 57.33 59.21 57.77 59.61 0.44 0.40 20 52.76 54.63 53.20 55.03 0.44 0.40 25 48.13 50.01 48.57 50.41 0.44 0.40 30 43.52 45.41 43.96 45.81 0.44 0.40 35 38.88 40.85 39.31 41.25 0.43 0.40 40 34.34 36.33 34.76 36.73 0.43 0.40 45 29.97 31.82 30.39 32.21 0.42 0.40 50 25.78 27.45 26.18 27.84 0.40 0.39 55 21.78 23.16 22.16 23.54 0.38 0.38 60 18.02 19.01 18.37 19.38 0.35 0.37 65 14.35 15.10 14.69 15.45 0.33 0.35 70 11.10 11.60 11.41 11.92 0.30 0.32 75 8.44 8.40 8.66 8.68 0.23 0.28 80 6.13 5.67 6.29 5.83 0.16 0.16 85 4.30 3.03 4.44 3.13 0.14 0.10 90 2.17 0.60 2.17 0.60 0.00 0.00
Note: Ischemic heart diseases (I20-I25)
As shown above, difference between life expectancy and health-adjusted life expectancy after cause deletion of heart diseases was 8.18 years for people aged 0, which means that they would spend 8.18 years of their life in ill health. The proportion of life spent in ill health was estimated at around 10.06%. In men’s case, the difference between life expectancy and HALE
Healthy Life Expectancy and Health Gains in Cardiovascular Diseases Management in Korea
48
after the cause deletion was 5.48 while that for women was 9.51, with women showing larger difference. Difference between the two life expectancies for men aged 65 after cause deletion of heart diseases was 2.49 compared to that of women at 5.45, and the proportions of remaining years that they should spend in ill health were 14.49% for men and 26.09% for women at age 65.
Table 3-16 Difference between life expectancy and HALE after cause deletion of heart diseases
(Unit: years, %)
Age
Difference (years) of life spent in ill health
Difference (%) of life spent in ill health Male Female Male Female
0 5.48 9.51 7.09 11.42 1 5.48 9.51 7.16 11.53 5 5.39 9.42 7.42 11.99 10 5.24 9.36 7.75 12.70 15 4.99 9.08 7.95 13.22 20 4.67 8.73 8.07 13.69 25 4.46 8.47 8.41 14.38 30 4.26 8.23 8.84 15.22 35 4.12 7.94 9.48 16.15 40 3.93 7.64 10.16 17.21 45 3.70 7.34 10.84 18.56 50 3.46 6.97 11.67 20.01 55 3.19 6.55 12.57 21.78 60 2.79 6.06 13.20 23.83 65 2.49 5.45 14.49 26.09 70 2.12 4.64 15.70 28.01 75 1.61 3.82 15.69 30.55 80 1.11 3.02 15.05 34.16 85 0.55 2.50 10.94 44.41 90 0.33 1.90 13.20 76.10
Note: Ischemic heart diseases (I20-I25)
Mortality caused by cardio-cerebrovascular diseases in 2009 was 498.18 per 100,000 people in the 70-74 age group and
Chapter 3_Gains in HALE after Eliminating Stroke and Risk Factors
49 1,858.68 in the 80-84 age group. In addition, men appeared to have higher rate of mortality per 100,000 people from cardio-cerebrovascular diseases than women.
Table 3-17 Mortality caused by cardio-cerebrovascular diseases
(Unit: 100,000 people)
Age
Male Female Total
No. of deaths Mortality rate No. of deaths Mortality rate No. of deaths Mortality rate 0 21 9.15 18 8.43 39 8.80 1 - 4 4 0.43 9 1.02 13 0.71 5 - 9 7 0.51 11 0.86 18 0.68 10 - 14 15 0.86 8 0.51 23 0.69 15 - 19 29 1.56 19 1.16 48 1.38 20 - 24 45 2.75 15 1.00 60 1.91 25 - 29 101 5.05 47 2.48 148 3.80 30 - 34 172 8.72 59 3.10 231 5.96 35 - 39 394 17.15 103 4.68 497 11.05 40 - 44 676 30.43 210 9.75 886 20.25 45 - 49 1,144 51.59 322 15.07 1,466 33.66 50 - 54 1,504 77.54 519 27.13 2,023 52.51 55 - 59 1,610 121.78 498 37.35 2,108 79.38 60 - 64 1,988 190.90 881 80.67 2,869 134.48 65 - 69 3,155 359.01 1,719 166.05 4,874 254.64 70 - 74 4,183 647.06 3,381 387.79 7,564 498.18 75 - 79 4,071 1,161.26 5,217 857.30 9,288 968.40 80 - 84 3,597 2,184.63 6,326 1,713.32 9,923 1,858.68 85 - 89 2,420 3,526.26 5,384 2,982.78 7,804 3,132.49 90 or above 990 4,977.88 3,377 4,604.77 4,367 4,684.37
Concerning life expectancy after cause deletion of cardio-cerebrovascular diseases, it was 80.67 for people aged 0, while after the cause deletion, it increased 2.87 years to 83.55. For men of age 0, life expectancy after cause deletion of cardio-vascular diseases was expected to rise 1.97 years from
Healthy Life Expectancy and Health Gains in Cardiovascular Diseases Management in Korea
50
76.80 to 78.78. For women aged 0, the general life expectancy of 82.92 was estimated to grow to 84.74, with an increment of 1.81 years.
Table 3-18 Life expectancy after cause deletion of cardio-cerebrovascular diseases
(Unit: years)
Age Life expectancy
Life expectancy after
cause deletion Increment Male Female Male Female Male Female 0 76.80 82.92 78.78 84.74 1.97 1.81 1 76.08 82.18 78.06 84.00 1.97 1.81 5 72.15 78.26 74.12 80.07 1.97 1.81 10 67.21 73.30 69.18 75.11 1.97 1.81 15 62.26 68.34 64.23 70.14 1.97 1.81 20 57.37 63.41 59.34 65.22 1.97 1.80 25 52.53 58.53 54.50 60.33 1.97 1.80 30 47.72 53.68 49.68 55.48 1.96 1.80 35 42.93 48.84 44.89 50.64 1.95 1.80 40 38.21 44.01 40.14 45.80 1.93 1.80 45 33.61 39.20 35.50 40.99 1.89 1.78 50 29.18 34.45 31.02 36.22 1.84 1.77 55 24.91 29.75 26.69 31.48 1.78 1.74 60 20.77 25.11 22.46 26.81 1.69 1.70 65 16.81 20.58 18.41 22.22 1.59 1.64 70 13.22 16.25 14.65 17.78 1.43 1.53 75 10.01 12.23 11.24 13.56 1.22 1.33 80 7.21 8.66 8.14 9.65 0.93 0.99 85 4.88 5.53 5.39 6.04 0.51 0.51 90 2.50 2.50 2.50 2.50 0.00 0.00
Health-adjusted life expectancy of 72.63 at age 0 appeared to increase 3.02 years to 75.66 after cause deletion of cardio-cerebrovascular diseases. While life expectancy grew by 2.87 years after the cause deletion, HALE grew by 3.02 years, indicating that HALE rose further than life expectancy. HALE
Chapter 3_Gains in HALE after Eliminating Stroke and Risk Factors
51 for men at age 0 was 71.38, and after the cause deletion, it increased to 73.69, with a gain of 2.31 years in life. For women, HALE of 73.37 at age 0 increased to 75.56 after the cause deletion of cardio-cerebrovascular diseases, rising by 2.19 years.
Table 3-19 Health-adjusted life expectancy after cause deletion of cardio-cerebrovascular diseases
(Unit: years)
Age HALE
HALE after cause
deletion Increment Male Female Male Female Male Female 0 71.38 73.37 73.69 75.56 2.31 2.19 1 70.66 72.63 72.97 74.82 2.31 2.19 5 66.82 68.79 69.13 70.98 2.31 2.19 10 62.03 63.90 64.34 66.09 2.31 2.19 15 57.33 59.21 59.64 61.41 2.31 2.19 20 52.76 54.63 55.07 56.83 2.31 2.19 25 48.13 50.01 50.44 52.21 2.31 2.19 30 43.52 45.41 45.83 47.60 2.31 2.19 35 38.88 40.85 41.17 43.04 2.29 2.19 40 34.34 36.33 36.60 38.51 2.27 2.18 45 29.97 31.82 32.21 33.99 2.24 2.18 50 25.78 27.45 27.96 29.60 2.18 2.15 55 21.78 23.16 23.91 25.25 2.13 2.09 60 18.02 19.01 20.04 21.04 2.02 2.03 65 14.35 15.10 16.27 17.06 1.91 1.96 70 11.10 11.60 12.89 13.39 1.79 1.79 75 8.44 8.40 9.84 10.00 1.40 1.60 80 6.13 5.67 7.31 6.91 1.18 1.25 85 4.30 3.03 4.94 3.80 0.64 0.77 90 2.17 0.60 2.27 0.81 0.10 0.21
As shown above, difference between life expectancy and HALE after cause deletion of cardio-cerebrovascular diseases was 7.89 years for people aged 0, which means that they would spend 7.89 years in poor health. The proportion of years spent in
Healthy Life Expectancy and Health Gains in Cardiovascular Diseases Management in Korea
52
unhealthy state was estimated at around 9.44%. Among men, the difference between life expectancy and health-adjusted life expectancy was 5.09 years after the cause deletion, which was smaller compared to 9.17 years for women. The difference between the two life expectancies was 2.14 years for men aged 65 and 5.15 years for women, with the proportion of remaining years in ill health at 11.62% for men and 23.20% for women.
Table 3-20 Difference between life expectancy and HALE after cause deletion of cardio-cerebrovascular diseases
(Unit: years, %)
Age
Difference (years) of life spent in ill health
Difference (%) of life spent in ill health Male Female Male Female
0 5.09 9.17 6.46 10.83 1 5.08 9.18 6.51 10.92 5 4.99 9.08 6.74 11.34 10 4.85 9.02 7.01 12.00 15 4.59 8.74 7.15 12.46 20 4.27 8.39 7.20 12.87 25 4.06 8.13 7.45 13.47 30 3.86 7.88 7.77 14.21 35 3.72 7.60 8.28 15.01 40 3.53 7.29 8.80 15.92 45 3.29 6.99 9.27 17.06 50 3.06 6.62 9.87 18.27 55 2.78 6.24 10.43 19.81 60 2.42 5.77 10.79 21.52 65 2.14 5.15 11.62 23.20 70 1.76 4.39 12.01 24.70 75 1.40 3.56 12.43 26.24 80 0.84 2.74 10.27 28.36 85 0.45 2.24 8.43 37.07 90 0.23 1.69 9.19 67.60