Validation of the 15-item Brief Inventory of
Swallowing Ability (BISA-15) for Older Adults
Based on a Rasch Analysis
HyangHee Kima,b, Ga-Young Kima
aGraduate Program in Speech and Language Pathology, Yonsei University, Seoul, Korea
bDepartment and Institute of Rehabilitation Medicine, Yonsei University College of Medicine, Seoul, Korea
Correspondence: HyangHee Kim, PhD Graduate Program in Speech and Language Pathology, Yonsei University College of Medicine, 50-1 Yonsei-ro, Seodaemun-gu, Seoul 03722, Korea Tel: +82-2-2228-3900 Fax: +82-2-2227-7984 E-mail: h.kim@yonsei.ac.kr Received: March 30, 2020 Revised: May 1, 2020 Accepted: May 1, 2020
This research has been supported by the National Research Foundation of Korea (NRF) Grant funded by the Ministry of Science and ICT for convergent research in development program for convergence R&D over Science and Technology Liberal Arts (NRF-2017M3C1B6070665).
This study has been partially presented at the annual congress of the European Society for Swallowing Disorders (ESSD), Dublin, Ireland, September 25-29, 2018.
Objectives: Aging-related changes in swallowing functions have rapidly become prevalent among the elderly. Self-reported questionnaires are often conducted to observe how peo-ple perceive their swallowing functions, and to report the swallowing-associated quality-of-life. This study was conducted to demonstrate the use of Rasch analysis for validating the pre-developed self-reported questionnaire to assess swallowing functions for commu-nity-dwelling older adults. Methods: A total of 479 older adults (men=238, mean age±SD= 75.6± 7.17 years) were enrolled. Twenty-six items with respect to swallowing functions were completed by the participants. Each item investigated symptom frequency or sever-ity on a 5-point Likert scale. A Rasch analysis using the WINSTEP® program was undertaken
to establish validity and reliability of the questionnaire. Results: From the item fit statistics analysis, 11 out of 26 items were shown to be misfits to the model. Thus, the 15-item Brief Inventory of Swallowing Ability (BISA-15) was derived and demonstrated a unidimensional scale based on the dimensionality and item fit statistics. The overall item reliability was ex-cellent. The person reliability was lower than the required threshold. The rating scales needed to collapse into three categories both in frequency and severity (i.e., never, sometimes/mod-erate, often/severe). Conclusion: The BISA-15 can be utilized to detect degree of aberra-tions in swallowing that transit from normal to subclinical stage in older adults. Future stud-ies are warranted to further clarify the utility of the BISA-15 in a wide range of age in the el-derly as well as in the various clinical populations.
Keywords: Self-report, Swallowing, Mastication, Aged, Rasch analysis, Older adults, BISA-15
Population aging is global concern. The number of people aged 65 or older is approximately 7.37 million in Korea, accounted for 14.3% of its total population in 2018, and the percentage of elderly is expected to increase steadily by 41% in 2060 (Statistic Korea, 2018). The greying population brings about a wide variety of health care issues. In particular, presbyphagia, a term that refers to aging-related changes in swallowing functions, has rapidly become prev-alent among the elderly. In recent research, some reported preva-lence of presbyphagia as high as 15% among the community-dwell-ing older adults (Madhavan, LaGorio, Crary, Dahl, & Carnaby,
2016). Thus, it is imperative to look into the swallowing functions when evaluating health risks for the elderly.
Self-reported questionnaires are often conducted to see how targeted people perceive their swallowing functions, and to report swallowing-associated quality-of-life (Morisaki, 2017). To date, there have been numerous questionnaires developed based on classical test theory (CTT). Classical test theory is ‘a traditional quantitative approach to testing the reliability and validity of a scale based on its items’ (Cappelleri et al., 2014). However, one of limitations in CTT is that it describes reliability and validity based
upon the total test as a whole thus characteristics of items are not examined in detail. For example, an assessment scale has been de-veloped to evaluate the risk of chewing and swallowing problems among frail community-dwelling elderly persons (Miura, Kariya-su, Yamasaki, & Arai, 2007) and the test was evaluated merely with Cronbach’s alpha coefficient and via factor analysis, one of the CTT methods. Moreover, upon applying a Rasch analysis on pdeveloped self-reported questionnaires on swallowing, it was re-ported that they are lacking in their construct validity and internal consistency (Cordier et al., 2017; Cordier et al., 2018; Wilmskoetter et al., 2019). Despite this, Eating Assessment Tool-10 (EAT-10) is one of the more widely used questionnaire tool to measure swal-lowing function as well as associated quality-of-life, however it has been criticized by some researchers for its lack of validity in this regard (Cordier et al., 2017).
On the other hand, item response theory (IRT) is a reportedly more powerful and effective methodology to improve the reliabili-ty of a questionnaire by providing internal consistency and struc-tural validity (Cordier et al., 2017). Contrary to CTT, the IRT mod-el reveals the probability of an individual obtaining a correct re-sponse on a test item. It also provides the distinct benefit of a visu-ally appealing person-item map, which suggests to what extent the items cover the targeted range of the underlying scale and whether the items align with the target patient population (Cappelleri et al., 2014).
Among several swallowing assessment tools published to date, the self-reported questionnaire included in the Swallowing Moni-toring & Assessment Protocol (SMAP) has been validated in terms of content validity (Kim, Kim, & Lee, 2018) and concurrent validi-ty (Kim et al., 2019). One important distinction between our work and the other questionnaires is that the former was designed spe-cifically for measuring and monitoring swallowing functions in community-dwelling older individuals by focusing on symptoms observed before and during the preclinical stage. Since reported prevalence rate of swallowing complaints among older adults may vary depending on item contents and numbers of a questionnaire (González-Fernández, Humbert, Winegrad, Cappola, & Fried 2014; Holland et al., 2011; Inui et al., 2017), item analyses are of partucular importance to detect swallowing problems and to refer individuals with these problems for further evaluation.
Within this context, the present study aimed to evaluate the self-reported questionnaire items on swallowing functions for the elderly via Rasch analysis in order to explore the psychometric properties of the evaluation tool before its wide usage. By doing so, we would be able to reduce to an adequate number of the ques-tionnaire items which could be sensitive enough to detect dyspha-gia symptoms presented by the community-dwelling older adult before and during preclinical stage in otherwise healthy elderly.
METHODS
ParticipantsThe participants in this study were part (i.e., between February 2017 and December 2018) of an ongoing larger project of swallow-ing in older adults, includswallow-ing an experimental pilot study between October 24, 2016 and July 31, 2017 as well as the main research (Stage I) between November 1, 2017 and July 31, 2019 (Kim et al., 2018; Kim et al., 2019). A total of 479 individuals (men= 238) were recruited through the convenient sampling procedure from senior welfare community centers in the metropolitan area of Seoul and Gyeonggi Province. The subject eligibility criteria were as follows: 1) 65 years of age or older; 2) independently living; and 3) provid-ing a consent to the study. The mean age was 75.6 years (SD=7.17) and mean years of education were 10.2 (SD=4.97). They had mean score of 25.3 (SD= 4.54) on the Korean-Mini Mental State Exami-nation (K-MMSE, Kang, 2006) (Table 1).
Procedures
Approval from the Institutional Review Board (IRB) was ob-tained prior to conducting the study. Before carrying on data col-lection, the researchers obtained written consent from each indi-Table 1. Participant Characteristics (n= 479)
Measures N (%) M (SD) Age 75.6 (7.17) Sex Men 238 (49.7) Women 241 (50.3) Years of education 10.2 (4.97) K-MMSE score 25.3 (4.54)
K-MMSE=Korean-Mini Mental State Examination (Kang, 2006); N=number; M=mean; SD= standard deviation.
vidual who expressed their willingness to participate after explain-ing the purpose and procedure of the study. One-on-one interview using structured self-reported questionnaire was completed. Measurement
The measurement tools used in this study were newly developed to identify swallowing and chewing problems of elderly people liv-ing in the community (Kim et al., 2018; Kim et al., 2019). The items were constructed building upon previous studies and the content and concurrent validities were verified. Each item investigated symptom frequency (0=Never, 1=Seldom, 2=Sometimes, 3= Of-ten, 4=Always) or severity (0=Never, 1=Mild, 2=Moderate, 3= Severe, 4=Very severe) on a 5-point Likert scale.
Statistical Analysis
The Rasch model was applied in order to assess the reliability and validity of the questionnaire using WINSTEPS® version 4.4.6
(Linacre, 2019a). In this study, the joint maximum likelihood esti-mation was used as a rating scale estiesti-mation because the question-naire consisted of a Likert scale and employed the same rating scale for all items.
Dimensionality and item fit statistics
Dimensionality is determined by 1) identifying potentially prob-lematic items evidenced by negative point-measure correlations; 2) using Rasch fit values to identify misfit items; and 3) conducting a Rasch factor analysis using the Principal Component Analysis method of Residuals (PCAR) (Linacre, 1998). Point-measure cor-relations were examined for the sake of identifying potentially misfit items, as well as to ensure all items were in a positive direc-tion indicating they had the potential to contribute to the overall construct (Bond & Fox, 2015). The item fit statistics that describe how accurately or predictably the responses pertaining to that item fit the model. In order to judge the item fit, four categories of fit statistics were measured. The infit and outfit statistics consist of both mean squares (MNSQ) and z-standardized scores (Z-STD). Acceptable item MNSQ values range from 0.6 to 1.4 for infit and outfit statistics with Z-STD scores between -2 and +2 (Bond & Fox, 2015). A value of MNSQ greater than 1.4 indicates that the item in the questionnaire fails to define the same construct as the
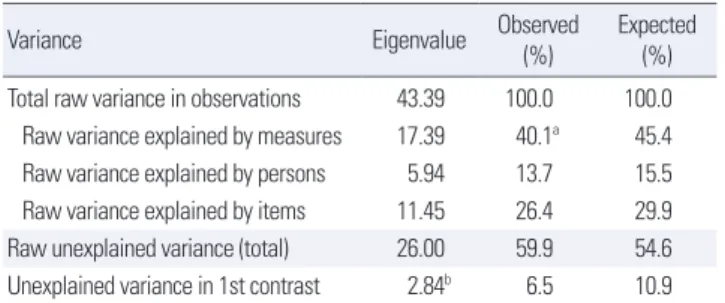
others (and is deemed “underfit”), an MNSQ value less than 0.6 occurs when the model predicts better data than expected, but does not always damage the model (deemed to be “overfit”) (Bond & Fox, 2015). PCAR is used to discover secondary dimensions ob-served in the unexplained variance after the Rasch dimension has been removed from ordinal data. In this study, the following two criteria were used to verify unidimensionality via PCAR: 1) >40% variance of the data is explained by the Rasch dimension (variance explained) and 2) eigenvalue of the 1st contrast is lower than 2 (Cor-dier et al., 2017; Linacre, 2019b).
Reliability
The person reliability index refers to the Cronbach alpha coeffi-cient, which indicates the replicability of subject ordering if the sample of persons was given another set of items that measured the same construct. The person separation (if the outlying mea-sures are accidental) and person separation index (PSI)/strata (if the outlying measures represent true performances; [(4*person separation)/3] are used to arrange people. The PSI/strata of 3 is needed to consistently identify three different levels (low, medium, high) of performance (the minimum level required to attain a reli-ability of 0.9) (Linacre, 2019b). The item relireli-ability index indicates the internal consistency reliability of multi-item scales. In general, a separation index ≥3.0 and separation reliability ≥0.9 are con-sidered excellent (Bond & Fox, 2015).
Rating scale
The rating scale diagnostics were determined as follows: 1) aver-age measures were used for the vertical arrangement (lowest score to highest); 2) outfit MNSQ was less than 2.0; 3) the difference in the thresholds between adjacent categories was between 1.0 and 5.0 logits. When the rating scale was identified as inappropriate, adjacent categories were combined and the data reanalyzed (Bond & Fox, 2015).
RESULTS
Dimensionality and item fit statistics
All items demonstrated positive point-measure correlation di-rections. From the item fit statistics analysis, 11 out of 26 items
were shown to be misfits to the model. Underfit of either infit or outfit scores (MNSQ>1.4 or Z-STD>2.0) was observed for the following items (No. 1, 2, 3, 4) as shown (in boldface) in Table 2: “It is hard to sip water or drink with a straw”, “It is harder to smell (food) than before”, “There has been a decrease in the amount of food I eat”, and “My mouth is usually dry or I feel thirsty”. Overfit of either infit or outfit scores (MNSQ<0.6 or Z-STD<-2.0) was shown for the following items (No. 8, 10, 16, 21, 23, 25, 26): “It is hard to swallow water or liquid”, “My throat hurts when I swallow food”, “I feel like something is stuck in my throat when I eat”, “Chew-ed food gets stuck in my throat makes it difficult to breathe”, “My pronunciation has become sloppier than before”, “It is hard to swal-low saliva”, and “It is difficult to swalswal-low chewed food”. Thus, 11
out of 26 items have been removed. As a result of dimensionality with PCAR, the Rasch dimension explained 40.1% of the variance with >40% considered a strong measurement of dimension. But
Table 2. Item fit statistics for 26 items of the self-reported questionnaire
No. Item Logit SE Infit Outfit measurePoint
MNSQ Z-STD MNSQ Z-STD
1. It is hard to drink with a straw. 0.25 0.08 3.08 9.9 3.94 9.9 0.23
2. It is hard to smell (food) than before. -0.18 0.07 1.6 5.56 1.5 3.28 0.42
3. There has been a decrease in the amount of food I eat. -1.14 0.05 1.13 1.93 1.4 4.08 0.51 4. My mouth is usually dry or I feel thirsty. -1.04 0.05 1.16 2.19 1.24 2.45 0.52
5. Water or food comes out of my nose. 0.89 0.11 1.17 1.17 0.83 -0.77 0.4
6. It is hard to chew food. -0.46 0.06 1.16 1.88 0.92 -0.69 0.55
7. I have chewing problems. -0.83 0.06 1.14 1.93 1.15 1.42 0.55
8. It is hard to swallow water or liquid. 0.91 0.11 1.12 0.86 0.55 -2.46 0.44
9. I get out of breath when I eat. 0.86 0.11 1.09 0.69 0.68 -1.65 0.43
10. My throat hurts when I swallow food. 1.28 0.14 1.06 0.37 0.56 -2.00 0.39
11. I spill when I drink water from a cup. 0.38 0.09 1.05 0.44 0.7 -1.95 0.51
12. It is hard to eat dry food (e.g., crackers). -0.54 0.06 1.05 0.67 0.9 -0.90 0.57
13. My voice has changed compared to the past. -0.83 0.06 1.05 0.75 1.02 0.23 0.57
14. It is hard to swallow pills. 0.07 0.08 1.02 0.19 0.8 -1.41 0.52
15. Some food remains under my tongue after eating. -0.05 0.07 1.00 0.07 0.76 -1.78 0.53
16. I feel like something is stuck in my throat when I eat. 0.25 0.08 1.00 0.07 0.64 -2.57 0.54
17. It is hard to breathe. 0.17 0.08 0.98 -0.15 0.85 -0.98 0.49
18. It takes longer to eat at home than before. -0.60 0.06 0.98 -0.18 0.94 -0.47 0.56
19. I choke on water or liquid. -0.62 0.06 0.9 -1.35 0.98 -0.11 0.57
20. Some food spills out of my mouth while chewing. 0.31 0.09 0.95 -0.44 0.71 -1.95 0.51
21. Chewed food gets stuck in my throat and makes it difficult to breathe. 0.64 0.10 0.95 -0.37 0.55 -2.81 0.50
22. I have swallowing problems. -0.04 0.07 0.9 -1.09 0.82 -1.31 0.55
23. My pronunciation has become sloppier than before. -0.89 0.06 0.85 -2.19 0.87 -1.41 0.6
24. I spill food as I put it in my mouth. -0.01 0.08 0.84 -1.65 0.78 -1.59 0.54
25. It is hard to swallow saliva. 0.76 0.11 0.81 -1.47 0.41 -3.74 0.51
26. It is difficult to swallow chewed food. 0.46 0.09 0.79 -1.84 0.49 -3.52 0.54
Mean 0.0 0.08 1.11 0.7 0.96 -0.5
Misfit items using the criterion of both 0.6< Infit or Outfit MNSQ< 1.4 and -2.0< Infit or Outfit Z-STD< 2.0 are shown in boldface. MNSQ= mean square; SE= standard error; Z-STD= Z-standard.
Table 3. Standardized residual variance
Variance Eigenvalue Observed (%) Expected (%) Total raw variance in observations 43.39 100.0 100.0 Raw variance explained by measures 17.39 40.1a 45.4
Raw variance explained by persons 5.94 13.7 15.5 Raw variance explained by items 11.45 26.4 29.9 Raw unexplained variance (total) 26.00 59.9 54.6 Unexplained variance in 1st contrast 2.84b 6.5 10.9 a>40% variance of the data is explained by the Rasch dimension (variance explained), bEigenvalue of the 1st contrast is lower than 2.
Table 4. Item and person summary statistics
Reli-ability Sepa-ration StrataPSI/a Mean SE
Infit Outfit MNSQ Z-STD MNSQ Z-STD Item 0.98 7.36 - 0.09 0.66 1.11 0.70 0.96 -0.50 Person 0.74 1.68 2.24 0.60 1.01 1.04 0.20 0.96 0.00
aPerson Separation Index (PSI)/strata= (4*person separation)/3, A person strata of,
“3” is needed to consistently identify three different levels (low, medium, high) of performance (the minimum level required to attain a reliability of 0.9).
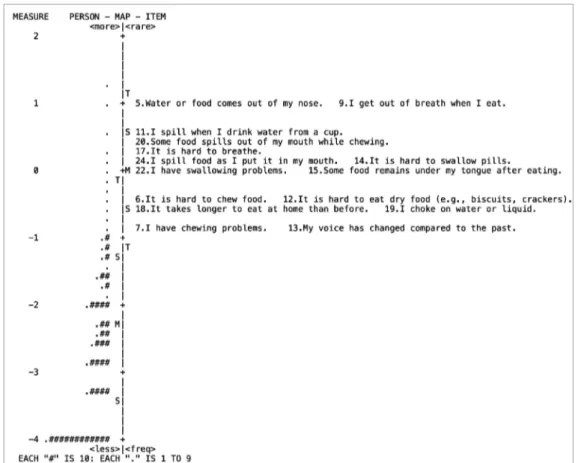
Figure 1. Wright map of 15 items.
the eigenvalue of the 1st contrasts was 2.84, suggesting the exis-tence of a secondary component in the data (Table 3). Therefore, we further investigated into the disattenuated correlations between the person measures in the clusters of items. The disattenuated correlations of our data were all 1.0. Out of the 15 items, 2 items (e.g., No. 7, “I have chewing problem”, and No. 13, “My voice has changed compared to the past”) represent the most frequently re-ported problems among the older adults. The least rere-ported items were No. 5, “Water or food comes out of my nose” and No. 9, “I get out of breath when I eat”, meaning that the majority of subjects scored these items as no problem (Figure 1).
Separation reliability
The summary fit statistics pertaining to item and person ability demonstrated good fit to the model based on both infit and outfit statistics, featuring an excellent reliability estimate for items (0.98). The person reliability measure was an acceptable level (0.74) with a person strata of 2.24, which is slightly lower than the required
minimum person separation index of 3 to reliably separate people into distinct strata of ability (Table 4).
Rating scale
The self-reported questionnaire is a 5-point rating scale featur-ing increasfeatur-ing category order (i.e., 0 through 4), but the average measure scores do not increase monotonically. Goodness of fit statistics were all acceptable, except for category 4 (outfit MNSQ= 6.18). Examination of the Rasch-Andrich thresholds revealed dis-ordered thresholds, with the threshold for categories 0-1 (none to
Table 6. The 15-item Brief Inventory of Swallowing Ability (BISA-15)
No. Items Frequency/ severity 0 1 2
Never Sometimes/moderate Often/severe 1. Water or food comes out of my nose.
2. It is hard to chew (hard) food. 3. I get out of breath when I eat. 4. I spill when I drink water from a cup. 5. It is hard to eat dry food (e.g., crackers). 6. My voice has changed, compared to the past. 7. It is hard to swallow pills.
8. Some food remains under my tongue after eating. 9. It is hard to breathe.
10. It takes longer to eat (at home) than before. 11. I choke on water or liquid.
12. Some food spills out of my mouth while chewing. 13. I spill food as I put it in my mouth.
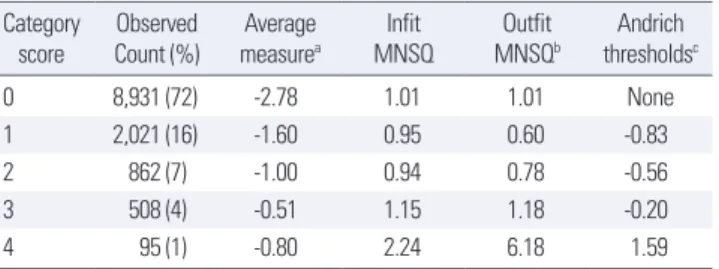
14. I have chewing problems. 15. I have swallowing problems. Table 5. Diagnostics for problematic rating scale
Category
score Count (%)Observed measureAverage a MNSQInfit MNSQOutfit b thresholdsAndrich c
0 8,931 (72) -2.78 1.01 1.01 None
1 2,021 (16) -1.60 0.95 0.60 -0.83
2 862 (7) -1.00 0.94 0.78 -0.56
3 508 (4) -0.51 1.15 1.18 -0.20
4 95 (1) -0.80 2.24 6.18 1.59
aAverage measure scores increased monotonically as the category increased, b
Out-fit MNSQ have to be less than 2.0, cThreshold calibration should progress
mono-tonically and difference in thresholds between adjacent categories was between 1.0 and 5.0 logits.
-0.83), 1-2 (-0.83 to -0.56), and 2-3 (-0.20 to 1.59) advancing by <1.0 (Table 5). These findings indicate that consideration should be given to collapsing categories, in which rating scale use should be reexamined.
Taken together, the 15-item BISA (Brief Inventory of Swallow-ing Ability) was derived as shown in Table 6 (refer to Appendix 1 & 2 for the evaluation sheets of English and Korean versions, re-spectively). The rating scale is divided into three categories, 0 (nev-er), 1 (sometimes), and 2 (often) depending on frequency domain. Severity was categorized into 0 (never), 1 (moderate), and 2 (se-vere). The total score ranges from 0 (no impairment) to 30 (most severe disability).
CONCLUSION
This study was aimed at validating a pre-developed self-report-ed questionnaire (Kim et al., 2018, 2019) to assess swallowing func-tions for community-dwelling older adults via the Rasch analysis. The questionnaire demonstrated a one-dimensional tool based on the dimensionality and item fit statistics. The overall item reliabil-ity was excellent, within the suitable parameters. The person reli-ability was, however, rather lower than the required criterion of 3, because of a small variation in the swallowing performance among the aged individuals. This issue could be resolved if a wide range of age group is included in the study because “oldest older” adults, aged 85+ years, could exhibit severe forms of swallowing problems (Inuma et al., 2017). The rating scales revealed disorder, indicating that consideration should be given to collapsing categories and a re-analysis done depending on the frequency distribution.
To determine the item fit statistics, the infit and outfit MNSQ statistics were calculated, which specify how well each item fits the Rasch model. In our study, a total of 11 items were mis-fitting: Four items had high MNSQ values showing that these items were not homogeneous with the other items, while 7 indicated low MNSQ values implying that the items were duplicates of the others (Bond & Fox, 2015). These items might have exhibited a ceiling effect in healthy older adults (Cordier et al., 2017). The most frequently
re-ported item, “I have chewing problems” had been often rere-ported in literature over the past decades (Ikebe et al., 2012; Takagi et al., 2017). In a similar vein, “My voice has changed compared to the past” was revealed as one of the more frequent complaints among older adults (Martins, Gonçalvez, Pessin, & Branco, 2014). Voice change may be ascribed to a laryngeal dysfunction in older adults (Lee, Choi, Choi, & Kim, 2018), resulting in frequent aspiration and/or choking (Zhang et al., 2016). On the other hand, the least observed items, “Water or food comes out of my nose” and “I get out of breath when I eat” might imply an underlying pathology impacting swallowing functions.
As a result of the analysis of the dimensionality, the Rasch di-mension explained 40.1% of the variance in the data, with 40% is being considered as a strong measurement of dimension (Cordier et al., 2017). However, the eigenvalue of the 1st contrast was 2.84, which is slightly above the expected value (Linacre, 2019b). There-fore, we further investigated into the disattenuated correlations between the person measures in the clusters of items. The disat-tenuated correlations of our data were all 1.0, indicating that, sta-tistically, all the clusters of items were measuring the same thing (Linacre, 2019b). Thus, we could conclude that the BISA-15 is rea-sonably unidimensional.
The Rasch model reliability was assessed by using reliability of the person separation. In this study, people were classified using a person strata because the outlying measures were considered for true performances. PSI/strata in our data was 2.24, which is slight-ly lower than the required criterion of 3. This finding suggested that people were not being separated into at least three levels (high, medium, low) of ability. The reason for low person reliability could be the need for more items to separate the high and low performanc-es, or to introduce a broader sample of people ability (Linacre, 2019b). In this paper, the interpretation is that there was a small variation in the swallowing abilities of the community-dwelling older adults.
Finally, the rating scale confirmed problems in the average mea-sures, outfit MNSQ, and step calibration. The first obvious issue was in category 4 which had only 95 observations in all. This meant that severe swallowing problems were not well reported in the com-munity-dwelling elderly of the current study. The very low count in comparison to all others must be a reason for caution. This issue was reflected in the average measure values and outfit MNSQ. The
average measures for category 3 and 4 were disordered, and the outfit MNSQ of category 4 was above the threshold. There was also evidence that the interval between the thresholds calibration was too small, demonstrating no distinctive difference in the swal-lowing functions between the older adults. One potential solution would be trying collapsing the rating scale categories. If category 3 and 4 were dropped into category 2 (e.g., 01222 then 01234) in con-sideration of the uniform frequency distribution, our rating scale diagnostics may be expected to improve.
The BISA-15 is a clinically useful tool that can be utilized to screen older adults with swallowing and/or chewing difficulties in larger community settings and public health programs since it requires minimal training to administer and is easy to score, and therefore can rapidly screen large numbers of persons. Based on the results of this study, there are several areas of research that can be identi-fied for the continued development of the BISA-15. The first relates to setting the cut-off score, which is expected to be specifically useful for swallowing screening in older people. Another impor-tant area for further development would be testing the reliability and validity of the rating on other clinical groups, such as those with strokes and movement disorders.
In summary, these evidence-based items of protocol of the cur-rent study are promising in that they support the importance of study subject specificity. Although various patient groups had been targeted in most of the currently available swallowing evaluation protocols, this protocol is focused on community-dwelling older adults. The items of the current research can be utilized to detect degree of aberrations in swallowing that transit from normal to subclinical stage. Future research is warranted to further clarify the validity of these items in a large cohort study.
REFERENCES
Bond, T. G., & Fox, C. M. (2015). Applying the Rasch model: Fundamental
measurement in the human sciences (3rd ed.). New York: Taylor & Francis.
Cappelleri, J. C., Lundy, J. J., & Hays, R. D. (2014). Overview of classicial test theory and item response theory for the quantitative assessment of items in developing patient-reported outcomes measures. Clinical Therapeutics,
36(5), 648-662.
Spey-er, R. (2017). Evaluating the psychometric properties of the Eating Assess-ment Tool (EAT-10) using Rasch analysis. Dysphagia, 32(2), 250-260. Cordier, R., Speyer, R., Schindler, A., Michou, E., Heijnen, B. J., Baijens, L., …
Joosten, A. V. (2018). Using Rasch analysis to evaluate the reliability and validity of the Swallowing Quality of Life Questionnaire: an item response theory approach. Dysphagia, 33(4), 441-456.
González-Fernández, M., Humbert, I., Winegrad, H., Cappola, A. R., & Fried, L. P. (2014). Dysphagia in old-old women: prevalence as determined ac-cording to self-report and the 3-ounce water swallowing test. Journal of
the American Geriatric Society, 62(4), 716-720.
Holland, G., Jayasekeran, V., Pendleton, N., Horan, M., Jones, M., & Hamdy, S. (2011). Prevalence and symptom profiling of oropharyngeal dysphagia in a community dwelling of an elderly population: a self-reporting ques-tionnaire survey. Diseases of the Esophagus, 24(7), 476-480.
Inui, A., Takahashi, I, Kurauchi, S., Soma, Y., Oyama, T., Tamura, Y., …& Ko-bayashi, W. (2017). Oral conditions and dysphagia in Japanese, communi-ty-dwelling middle- and older- aged adults, independent in daily living.
Clinical Interventions in Aging, 12, 515-521.
Ikebe, K., Matsuda, K. I., Kagawa, R., Enoki, K., Okada, T., Yoshida, M., & Maeda, Y. (2012). Masticatory performance in older subjects with varying degrees of tooth loss. Journal of Dentistry, 40(1), 71-76.
Iinuma, T., Hirata, T., Arai, Y., Takayama, M., Abe, Y., Fukumoto, M., ... & Gionhaku, N. (2017). Perceived swallowing problems and mortality risk in very elderly people ≥ 85 years old: results of the Tokyo Oldest Old Sur-vey on Total Health study. Gerodontology, 34(3), 313-319.
Kang. Y. W. (2006). A normative study of the Korean-Mini Mental State Ex-amination (K-MMSE) in the elderly. The Korean Journal of Psychology:
General, 25(2), 1-12.
Kim, H., Kim, G. Y., & Lee, H. J. (2018). Content validity of the swallowing monitoring and assessment protocol for the elderly. Communication
Sci-ences & Disorders, 23(4), 1042-1054.
Kim, H., Lee, H. J., Pyo, H. Y., Kim, J. W., Choi, S. H., Choi, H., ... & Im, I. (2019). Concurrent validity of the swallowing monitoring & assessment protocol for the elderly. Communication Sciences & Disorders, 24(2), 507-517.
Lee, S. H., Choi, H. S., Choi, S. H., & Kim, H. (2018). Voice quality of normal
elderly people after a 3oz water-swallow test: an acoustic analysis.
Phonet-ics and Speech Sciences, 10(2), 69-76.
Linacre, J. M. (1998). Detecting multidimensionality: which residual data-type works best? Journal of Outcome Measurement, 2(3), 266-283. Linacre, J. (2019a). WINSTEPS Rasch measurement computer program
(Ver-sion 4.4.5). Chicago, IL: WINSTEPS.com
Linacre, J. (2019b). A user’s guide to WINSTEPS Rasch-Model computer
pro-grams: program manual 4.4.6. Retrieved from https://www.winsteps.com/
winman/copyright.htm.
Madhavan, A., LaGorio, L. A., Crary, M. A., Dahl, W. J., & Carnaby, G. D. (2016). Prevalence of and risk factors for dysphagia in the community dwelling elderly: a systematic review. The Journal of Nutrition, Health &
Aging, 20(8), 806-815.
Martins, R. H. G., Gonçalvez, T. M., Pessin, A. B. B., & Branco, A. (2014). Ag-ing voice: presbyphonia. AgAg-ing Clinical and Experimental Research, 26(1), 1-5.
Miura, H., Kariyasu, M., Yamasaki, K., & Arai, Y. (2007). Evaluation of chew-ing and swallowchew-ing disorders among frail community-dwellchew-ing elderly in-dividuals. Journal of Oral Rehabilitation, 34(6), 422-427. doi: 10.1111/j.1365-2842.2007.01741.x
Morisaki, N. (2017). Relationship between swallowing functions and health-related quality of life among community-dwelling dependent older indi-viduals. Japan Journal of Nursing Science, 14(4), 353-363.
Statistic Korea. (2018). 2018 Elderly statistics. Retrieved from http://kostat. go.kr/portal/korea/kor_nw/2/6/1/index.board?bmode=read&aSeq=370779. Takagi, D., Watanabe, Y., Edahiro, A., Ohara, Y., Murakami, M., Murakami,
K., ... & Hirano, H. (2017). Factors affecting masticatory function of com-munity-dwelling older people: investigation of the differences in the rele-vant factors for subjective and objective assessment. Gerodontology, 34(3), 357-364.
Wilmskoetter, J., Boniha, H., Hong, I., Hazelwood, R. J., Martin-Harris, B., & Velozo, C. (2019). Construct validity of the Eating Assessment Tool (EAT-10). Disability and Rehabilitation, 41(5), 549-559.
Zhang, J., Zhou, Y., Wei, N., Yang, B., Wang, A., Zhou, H., ... & Villegas, B. (2016). Laryngeal elevation velocity and aspiration in acute ischemic stroke patients. PLoS one, 11(9), e0162257.
Appendix 2. The 15-item Brief Inventory of Swallowing Ability (BISA-15) (Korean version) No. 문 항 빈도/정도 0 1 2 전혀 그렇지 않다 그렇다 자주/많이 그렇다1) 1. 물이나 음식이 코로 넘어온다. 2. (딱딱한) 음식을 씹기가 힘들다. 3. 평소에 식사할 때 숨이 차다. 4. 컵으로 물 마실 때 흘린다. 5. 마른 음식(예: 크래커)을 먹기가 힘들다. 6. 예전에 비해 말하는 목소리가 변했다. 7. 알약을 넘기기가 힘들다. 8. 음식을 먹은 후에 혀밑에 음식물이 남아있다. 9. 평소에 숨 쉬는 것이 힘들다. 10. 예전에 비해 (집에서의) 식사 시간이 오래 걸린다. 11. 물이나 액체에 사레가 걸린다. 12. 음식을 씹으면서 흘린다. 13. 음식을 입에 넣으면서 흘린다. 14. 나에게 씹는 문제가 있다. 15. 나에게 삼키는 문제가 있다. 소계: 총계: /30 1)빈도나 정도 측면에서 ‘자주 그렇다’ 또는/또한 ‘많이 그렇다’라고 보고시 체크함.
Citation: Kim, H., & Kim, G. Y. (2020). Validation of the 15-item Brief Inventory of Swallowing Ability (BISA-15) for older adults based on a Rasch analysis. Communication Sciences & Disorders, 25(2), 489-498.
Appendix 1. The 15-item Brief Inventory of Swallowing Ability (BISA-15) (English version)
No. Item Frequency/ Severity
0 1 2
Not at all Sometimes/Moderate1)
Often/ Severe2)
1. Water or food comes out of my nose. 2. It is hard to chew (hard) food. 3. I get out of breath when I eat. 4. I spill when I drink water from a cup. 5. It is hard to eat dry food (e.g., crackers). 6. My voice has changed, compared to the past. 7. It is hard to swallow pills.
8. Some food remains under my tongue after eating. 9. It is hard to breathe.
10. It takes longer to eat (at home) than before. 11. I choke on water or liquid.
12. Some food spills out of my mouth while chewing. 13. I spill food as I put it in my mouth.
14. I have chewing problems. 15. I have swallowing problems.
Subtotal:
Total: /30 1)Upon reporting “sometimes” and/or “moderate” to a given item, 2)Upon reporting “often” and/or “severe” to a given item.
Citation: Kim, H., & Kim, G. Y. (2020). Validation of the 15-item Brief Inventory of Swallowing Ability (BISA-15) for older adults based on a Rasch analysis. Communication Sciences & Disorders, 25(2), 489-498.
국문초록
라쉬분석에 기반한 노년층 15문항 삼킴기능 간단평가(BISA-15)의 타당성 검증 김향희1,2·김가영1 1연세대학교 대학원 언어병리학협동과정, 2연세대학교 의과대학 재활의학교실 및 재활의학연구소 배경 및 목적:노화에따른삼킴기능의변화는노년층에서가파르게만연되고있는현상이다. 따라서자가설문조사를통해지역사회 노년층스스로의삼킴기능과삼킴관련삶의질을어떻게인식하는지를확인하는것이필요하다. 이연구에서는기개발된삼킴기능 26 문항의자가보고설문지에대해추가적인타당성확보를위하여라쉬분석을실시하고자하였다. 방법:총 479명의노인들(남자:여자 = 238:241, 평균연령 75.6±7.17세)을대상으로 26개의문항이포함된설문평가를실시하였다. 라쉬모델을적용하기위하여 WINSTEP®프로그램(버전4.4.6)을활용해문항들의타당성과신뢰성을확인하였다. 결과:문항적합통계(item fit statistics)를통해, 26개중 11개문 항이모델에적합하지않음을확인하였으며, 최종도출된 15-문항삼킴기능간단평가(Brief Inventory of Swallowing Ability, BISA-15)
는차원수(dimensionality)와문항적합통계측면에서일차원적(unidimensional) 구성을확인할수있었다. 전반적인문항신뢰도는우
수하였으나, 대상자신뢰도(person reliability)는다소낮았다. 평정척도(rating scales)는일부범주를통합한후재분석되어세범주로
축소되었다. 논의 및 결론:라쉬분석을통해확인된 BISA-15은정상에서임상전단계로전이되는삼킴기능을탐지하는데활용될수있
을것이다. 향후, 노년층에서좀더폭넓은연령대및다양한환자군에게도구유용성이검증되는연구가필요한것으로사료된다.
핵심어: 자가보고, 삼킴, 씹기, 노인, 라쉬분석
이 논문은 2017년도 정부(과학기술정보통신부)의 재원으로 한국연구재단-과학기술인문사회융합연구사업의 지원을 받아 수행된 연구임
(NRF-2017M3C1B6070665).
본 논문의 일부 내용은 European Society for Swallowing Disorders (ESSD) 연례학술대회(아일랜드 더블린) (2018. 9.25~29)에서 발표되었음.
참고문헌
강연욱(2006). K-MMSE (Korean-Mini Mental State Examination)의 노인 규준 연구. 한국심리학회지: 일반, 25(2), 1-12. 김향희, 김가영, 이현정(2018). 노년층 삼킴 평가 프로토콜의 내용타당도. Communication Sciences & Disorders, 23(4), 1042-1054.
김향희, 이현정, 표화영, 김정완, 최성희, 최현주, 유희천, 남석인, 임익재(2019). 노년층 삼킴 평가 프로토콜의 공인타당도. Communication Sciences & Disorders, 24(2), 507-517.
이솔희, 최홍식, 최성희, 김향희(2018). 3온스 물 삼킴검사 이후 정상 노년층의 음질 변화: 음향학적 분석. 말소리와 음성과학, 10(2), 69-76.