Temporal gene expression pattern
in podocyte exposed to high glucose
Seung Hyeok Han
Department of Medicine
Temporal gene expression pattern
in podocyte exposed to high glucose
Directed by Professor Shin-Wook Kang
Doctoral Dissertation submitted to the Department of
Medicine, the Graduate School of Yonsei University
in partial fulfillment of the requirements for the degree
of Doctor of Philosophy
Seung Hyeok Han
This certifies that the Doctoral Dissertation of
Seung Hyeok Han is approved.
---
Thesis Supervisor : Shin-Wook Kang
---
(Kyung-Sup Kim: Thesis Committee Member#1)
---
(Jeon Han Park: Thesis Committee Member#2)
---
(Sang Hwa Yang: Thesis Committee Member#3)
---
(Bong Soo Cha: Thesis Committee Member#4);
The Graduate School
Yonsei University
ACKNOWLEDGEMENTS
Thanks the Lord, finally you made this possible. I want to give a
very special thanks to Prof. Shin-Wook Kang who guided me in every
step of the thesis with a warm and delicate attention. Also, thanks to
Prof. Sang Hwa Yang who gave me a great help in microarray
experiment, Prof. Kyung-Sup Kim, Prof. Jeon Han Park, and Prof.
Bong Soo Cha who generously offered guidance and supports.
In addition, I really appreciate Jin Ji Li, Jin Ju Kim, Dong Sub Jung,
Seung Jae Kwak, and Je Hyun Park. Without their help, the outcome
of this thesis could not be made. My colleagues, Jung Eun Lee, Dong
Ki Kim, Tae Hee Lee, and Sung Jin Moon, I am deeply grateful to
them for being supportive to me.
I
’d like to thank to my parents and parents-in-law. They’ve always
encouraged me with love. At last, I want to give my love to my wife
who has always been beside me whenever I needed her.
I
’d like to dedicate this paper to all of you with all of my heart.
Thanks everyone.
<TABLE OF CONTENTS>
ABSTRACT --- 1
I. INTRODUCTION --- 5
II. MATERIALS AND METHODS --- 7
A. Podocyte culture --- 7
B. RNA isolation --- 8
C. Mouse oligonucleotide microarray hybridization --- 8
D. Real-time PCR --- 9
E. Western blot analysis --- 12
F. Animals --- 13
G. Immunohistochemistry --- 13
H. Statistical analysis --- 15
III. RESULTS A. Gene expression profile --- 16
B. Real-time PCR --- 27
C. Western blot analysis --- 30
D. Animal data --- 32
E. Immunohistochemistry --- 33
IV. DISCUSSION --- 38
REFERENCES --- 48
LIST OF FIGURES
Figure 1. Cluster analysis of differentially expressed genes identified by microarray analysis of NG- and HG-treated podocytes --- 24 Figure 2. Real-time PCR for the selected genes (cluster A-C) in NG- and
HG-treated podocytes --- 28 Figure 3. Real-time PCR for the selected genes (clusters D-F) in NG- and
HG-treated podocytes --- 29 Figure 4. Western blot analysis for the selected genes identified based on the results of microarray and real-time PCR --- 31 Figure 5A. Immunohistochemical staining for HO-1, VEGF-A, TSP-1, and thrombomodulin at 6 weeks after DM induction --- 34 Figure 5B. Immunohistochemical staining for ACE2 and PPAR-γ at 6 weeks after DM induction --- 35 Figure 6A. Immunohistochemical staining for HO-1, VEGF-A, TSP-1, and thrombomodulin at 12 weeks after DM induction --- 36 Figure 6B. Immunohistochemical staining for ACE2 and PPAR-γ at 12 weeks after DM induction --- 37
LIST OF TABLES
Table 1. Sequences of primers --- 11
Table 2. Genes up- or down-regulated at 2, 6, 24 and 48 hr under high
glucose condition --- 18
Table 3. The list of genes showing pattern of clusters A-C --- 25
Table 4. The list of genes showing pattern of clusters D-F --- 26
Table 5. Animal data at 6 weeks and 12 weeks after DM induction ---32
ABSTRACT
Temporal gene expression pattern
in podocyte exposed to high glucose
Seung Hyeok Han
Department of Medicine
The Graduate School, Yonsei University
(Directed By Professor Shin-Wook Kang)
Background: Recent studies demonstrate that podocyte injury is an early feature of diabetic nephropathy, leading to proteinuria and glomerulosclerosis. Although ROS, mechanical stretch, anigotensin II, and TGF-ß have been reported to be involved in podocyte injury in diabetic nephropathy, the molecular mechanisms of podocyte injury are not fully understood. Furthermore, global gene expression patterns specific to podocyte cultured under diabetic conditions have not been explored. This study was designed to investigate the effects of high glucose on time dependent gene expression
profile in podocyte.
Method: Conditionally immortalized mouse podocytes were cultured under permissive conditions at 33℃ with γ-interferon and subcultured, and then allowed to differentiate at 37℃ without γ-interferon. After confirming differentiation of podocytes and serum restriction for 24 hours, podocytes were exposed to medium containing 5.6 mM glucose (LG), LG + 24.4 mM mannitol (LG+M), and 30 mM glucose (HG). RNA and protein were obtained at 2, 6, 24, and 48 hours after exposure, then oligonucleotide microarray was conducted using mouse 38k chip in triplicate at each time point. The results obtained by direct comparative analysis between LG- and HG-treated podocytes were further confirmed by real-time PCR and Western blot. In addition, immunohistochemistry with renal tissues from 6- and 12-weeks streptozotocin-induced diabetic (DM) and control rats was performed to verify the in vitro results.
Results: The microarray identified 3,256 differentially expressed genes having at least a 1.5-fold difference at one time point in expression level and concordant log ratios between the two groups, and they were classified into 11 clusters. Three of the 11 clusters consisted of persistently up-regulated genes at each time point. These clusters included genes encoding thrombospondin-1 (TSP-1), superoxide dismutase-1 (SOD-1), thrombomodulin, thymosin ß-10,
vascular endothelial growth factor (VEGF)-A, α-actinin-4, and heme oxygenase-1 (HO-1). In addition, three clusters of genes which were persistently down-regulated at each time point were observed. These clusters included genes encoding angiotensin-converting enzyme-2 (ACE2), peroxisomal proliferator activator-gamma (PPAR-γ) and -alpha (PPAR-α), kidney androgen regulated protein (KAP), regulacin (SMP-30), podocin, thioredoxin-1, and hepatocyte growth factor. Real-time PCR revealed that the mRNA expression of HO-1 and VEGF-A at 6 and 24 hours, and that of TSP-1, thrombomodulin, and thymosin ß-10 at 2, 6, and 24 hours were significantly increased in podocytes exposed to HG compared to LG-treated podocytes. On the other hand, the mRNA expression of PPAR-γ at all time-points and that of ACE2 and KAP at 6, 24, and 48 hours were significantly decreased in podocytes exposed to HG compared to LG-treated podocytes. These results were further validated by Western blot analysis. The protein expression of HO-1 and VEGF-A at 6 and 24 hours, and that of TSP-1 and thrombomodulin at 6, 24, and 48 hour were significantly increased in podocytes cultured under HG medium compared to LG-treated podocytes, whereas that of PPAR-γ was significantly decreased at 6, 24, and 48 hours. Immunohistochemistry revealed that HO-1 and VEGF-A showed more intense staining in 6-week diabetic glomeruli relative to controls. However, staining of HO-1 and
VEGF-A were not different between the two groups at 12 weeks. On the other hand, staining of TSP-1 and thrombomodulin were persistently increased and that of ACE2 and PPAR-γ were persistently decreased at 6 and 12 weeks in diabetic glomeruli compared to controls.
Conclusion: The microarray analysis provided valuable information on the molecular mechanisms of high glucose-induced podocyte injury. The present study suggests that protective role of some genes are disturbed in diabetic milieu. Further study will be needed to verify the specific role of the genes identified in the present study.
Temporal gene expression pattern
in podocyte exposed to high glucose
Seung Hyeok Han
Department of Medicine
The Graduate School, Yonsei University
(Directed By Professor Shin-Wook Kang)
I. INTRODUCTION
Diabetes has become one of the major causes of morbidity and mortality, and the United States Renal Data System (USRDS) reported that 44.9% of new-onset end stage renal disease (ESRD) in 1999-2003 were caused by diabetic nephropathy.1 Diabetic nephropathy is characterized pathologically by glomerular and tubular hypertrophy, basement membrane thickening, extracellular matrix accumulation, and glomerulosclerosis, and clinically by proteinuria.2-4 Recently, numerous studies have shown that podocyte injury is an early feature of diabetic and non-diabetic kidney diseases and plays a
major role in proteinuria and glomerulosclerosis.5,9,10 Although reactive oxygen species (ROS), mechanical stretch, anigotensin II, and TGF-ß have been implicated to be involved in podocyte injury,7-10 the molecular mechanisms of podocyte injury are not fully understood.
High-throughput gene expression profiling technology has become a powerful approach for obtaining global views of the mRNA regulation and for building up novel hypotheses. Several investigators have performed cDNA microarray analyses with diabetic kidneys, but most of these studies examined the whole kidney.11-13 Analysis of the whole kidney may not be appropriate when elucidating specific genes associated with diabetic glomerulopathy because glomeruli account for less than 10% of the whole kidney. In addition, gene expression patterns can be quite dissimilar depending on the regions that are analyzed even in the same kidney. Although genome scale expression profiling of high glucose-stimulated mesangial cells has been reported,14 studies of the large scale gene expression in podocytes exposed to high glucose are not available, despite the fact that podocyte injury is an early event in diabetic nephropathy. In this study, a genome-scale, time-dependent gene expression profiling was performed in podocytes cultured under high glucose medium using whole-genome mouse oligonucleotide microarrays to delineate high glucose concentration-dependent gene expression pattern in
podocytes.
II. MATERIALS AND METHODS
A. Podocyte culture
Conditionally immortalized mouse podocytes were kindly provided by Dr. Peter Mundel (Albert Einstein College of Medicine, Bronx, NY, USA) and were cultured as previously described.15 Briefly, frozen podocytes were first grown under permissive conditions at 33°C in collagen coated flasks with RPMI 1640 media containing 10% fetal bovine serum, 50 U/ml γ-interferon, and 100 U/ml of penicillin/streptomycin. The γ-interferon concentration was tapered down to 10 U/ml in successive passages. Cells were then trypsinized and subcultured without γ-interferon (non-permissive conditions) and allowed to differentiate at 37°C with media changed on alternate days. The differentiation of podocytes grown for 14 days at 37°C was confirmed by the identification of synaptopodin, a podocyte differentiation marker, by RT-PCR and Western blotting (data not shown).
After confirming differentiation of podocytes and serum restriction for 24 hours, the medium was changed to serum-free RPMI medium containing normal glucose (5.6 mM, LG), high glucose (30 mM, HG) or LG+mannitol
(24.4 mM, LG+M). At 2, 6, 24, and 48 hours after the media change, cells were harvested for either RNA or protein extraction.
B. RNA isolation
Total RNA from cultured podocytes was isolated with TRIZOL® reagent (Invitrogen, Paisley, UK) according to the manufacturer’s instructions. Total RNA quantity and purity were assessed by measurement of OD260/280 using a
NanoDrop spectrophotometer. RNA with an OD260/280 of >1.8 was considered
acceptable for microarray experiments. RNA length distribution and integrity were assessed by capillary electrophoresis with fluorescence detection (Agilent Bioanalyzer 2100, Agilent, USA) using the Agilent Total RNA Nano chip assay for the presence of 28s and 18s rRNA bands. Ideally, the intensity of the 28s band should be twice the intensity of the 18s.
C. Mouse oligonucleotide microarray hybridization
Mouse oligonucleotide microarrays (Microarrays, Inc., Nashville, TN, USA) spotted with 38,500 Illumina MEEBO (Mouse Exonic Evidence Based Oligonucleotide) set were used for the experiments. For each time point, cRNAs from LG-treated podocytes were labeled with Cy3 and those from podocytes exposed to HG were labeled with Cy5 to directly measure the
effect of difference in glucose concentration. Triplicate biological repetitions of hybridizations were performed for each time point. In one sample, a technical replication was performed with the same batch of cRNA to measure reproducibility of the microarray experiment. Fluorescent-labeled cRNA for oligonucleotide micorarray analysis was prepared by amplification of total RNA in the presence of aminoallyl-UTP followed by the coupling of Cy3 or Cy5 dye (AmershamPharmacia, Uppsala, Sweden). Microarrays were hybridized with the fluorescently labeled cRNA at 60℃ for 16 h, washed and were scanned using GenePix 4000B scanner (Axon Instruments, Union City, CA, USA). Scanned images were analyzed with GenePix Pro 6.0 software (Axon Instruments) to obtain gene expression ratios. The expression data were saved as GenePix Result (GPR) formats.
D. Real-time PCR
To validate the results of microarray analysis, real-time PCR was performed. The primers used in the experiments are summarized in Table 1. Using the ABI PRISM® 7700 Sequence Detection System (Applied Biosystems, Foster City, CA, USA), the PCR was performed with a total volume of 20 µl in each well, containing 10 µl of SYBR Green® PCR Master Mix (Applied Biosystems), 5 µl of cDNA corresponding to 25 ng of RNA, and 5 pmol sense
and antisense primers. Primer concentrations were determined by preliminary experiments that analyzed the optimal concentrations of each primer. The PCR conditions were as follows: 40-45 cycles, denaturation at 95°C for 45 seconds, annealing at the corresponding temperature for 45 seconds, and extension at 72°C for 1 minute. Initial heating at 95°C for 9 minutes and a final extension at 72°C for 7 minutes were included for all reactions. Each sample was run in triplicate in separate tubes to permit quantification of the gene normalized to the 18s rRNA. Following real-time PCR, the temperature was increased from 60 to 95°C at a rate of 2°C/min to construct a melting curve. A control without cDNA was run in parallel with each assay. The cDNA content of each specimen was determined using a comparative CT method with 2-∆∆CT. The results are given as relative expression normalized to the 18s rRNA and expressed in arbitrary units. Signals from LG-treated podocytes were assigned a relative value of 1.0. In pilot experiments, PCR products run on agarose gels revealed a single band.
Table 1. Sequences of primers used for real-time PCR and expected gene fragment sizes
Sequence (5'
→3')
bp
TSP-1 Sense GGTGAGAGCTGATTGACCCAAT Antisense GGCCACTGCAGGTGAGAAGT 113Thrombomodulin Sense GACTGAGACCCAGGGTTTCCT Antisense CGCGAGTATTCACCGTCAGA
74
Thymosin ß-10 Sense CCCCTGGCCACCCATTA Antisense CCCATGTCCGGCTTGTCT
73
ACE2 Sense GAAGCGGGAGATCGTTGGT Antisense CAGAGATGCAGGGTCACAGT
70
HO-1 Sense GGTGATGCTGACAGAGGAACAC Antisense TAGCAGGCCTCTGACGAAGTG
71
VEGF-A Sense GATTGAGACCCTGGTGGACATC Antisense CACACAGGACGGCTTGAAGA
73
KAP Sense CTGGG TCATACAGAGGGACA Antisense CTGGCGTGAAGTCCATGAT
94
PPAR-γ Sense CAGGCCGAGAAGGAGAAGCT Antisense GCTCGCAGATCAGCAGACTCT
80
18s Sense AGTCCCTGCCCTTTGTACACA Antisense GATCCGAGGGCCTCACTAAAC
E. Western blot analysis
Podocytes harvested from plates were lysed in sodium dodecyl sulfate (SDS) sample buffer (2% sodium dodecyl sulfate, 10mM Tris-HCl, pH 6.8, 10% [vol/vol] glycerol). Aliquots of 50 µg of protein were treated with Laemmli sample buffer, heated at 100°C for 5 minutes, and electrophoresed with 50
µg/lane in an 8-12% SDS-polyacrylamide gel. Proteins were then transferred
to a Hybond-ECL membrane (Amersham Life Science, Inc., Arlington Heights, IL, USA) using a Hoeffer semidry blotting apparatus (Hoeffer Instruments, San Francisco, CA, USA). The membrane was then incubated in blocking buffer A (1 X PBS, 0.1% Tween-20 and 8% nonfat milk) for 1 hour at room temperature, followed by an overnight incubation at 4°C with a 1:500 dilution of monoclonal anti-heme oxygenase (HO)-1 antibody or polyclonal anti-vascular endothelial growth factor (VEGF) antibody, a 1:200 dilution of monoclonal anti-thrombospondin (TSP)-1 antibody (EMD Biosciences, Inc., Darmstadt, Germany), a 1:500 dilution of polyclonal anti-peroxisomal proliferator activated receptor (PPAR)-γ antibody or polyclonal anti-thrombomodulin antibody, or a 1:1000 dilution of polyclonal β-actin antibody (Santa Cruz Biotechnology, Inc., Santa Cruz, CA, USA). The membrane was then washed once for 15 minutes and twice for 5 minutes in 1 X PBS with 0.1% Tween-20. Following the wash, the membrane was incubated in buffer A
containing a 1:1000 dilution of horseradish peroxidase-conjugated goat anti-rabbit IgG (Amersham Life Science, Inc.). The washes were repeated, and the membrane was developed with a chemiluminescent agent (ECL; Amersham Life Science, Inc.).
F. Animals
All animal studies were conducted under an approved protocol. Twenty-four male Sprague-Dawley rats, weighing 230-270 g were studied. Twelve were intraperitoneally injected with diluent (Control, C) and 12 were injected with 65 mg/kg streptozotocin (STZ). Blood glucose levels were measured on the third day after STZ injection to confirm the development of diabetes. The rats were housed in a temperature-controlled room and were given free access to water and standard laboratory chow. Six rats from each group were sacrificed after 6 and 12 weeks. Body weights, kidney weights, and urinary albumin excretion were measured at the time of sacrifice.
G. Immunohistochemistry
Slices of kidney for immunohistochemical staining were fixed in 10% neutral buffered formalin, processed in the standard manner, and 5 µl sections of paraffin embedded tissues were utilized. Slides were deparaffinized,
hydrated in ethyl alcohol, and washed in tap water. Antigen retrieval was carried out in 10 mM sodium citrate buffer for 20 minutes using a Black and Decker vegetable steamer. For HO-1, VEGF-A, TSP-1, thrombomodulin, angiotensin converting enzyme (ACE) 2, and PPAR-γ staining, monoclonal anti-HO-1 antibody, polyclonal anti-VEGF-A antibody, monoclonal anti-TSP-1 antibody (EMD Biosciences, Inc.), polyclonal anti-ACE2 antibody, polyclonal anti-PPAR-γ antibody, polyclonal anti-thrombomodulin antibody (Santa Cruz Biotechnology, Inc.) were diluted in 1:200 with 2% casein in BSA and were incubated overnight at room temperature. After washing, a secondary goat anti-rabbit antibody was added for 20 minutes, and the slides were again washed and incubated with a tertiary rabbit-PAP complex for 20 min. DAB was added for 2 minutes and the slides were counterstained with hematoxylin. To confirm that the expression change of HO-1, VEGF-A, TSP-1, thrombomodulin, ACE2, and PPAR-γ was not due to the change of podocyte numbers, immunohistochemical staining for Wilms’ tumor-1 protein (WT-1) was also done with a 1:100 dilution of polyclonal antibody to WT-1 (Santa Cruz Biotechnology, Inc.). A semiquantitative score for measuring HO-1, VEGF-A, TSP-1, thrombomodulin, ACE2, and PPAR-γ immunohistochemical intensity within glomeruli was determined by examining thirty glomeruli in each section and by digital image analysis
(MetaMorph version 4.6r5, Universal Imaging Corp., Downingtown, PA, USA) as previously described.16 All cells with positive staining for WT-1 in 20 glomeruli cut at the vascular pole were considered as podocytes and were counted to evaluate a possible change in podocyte numbers.
H. Statistical analysis
GPRs were imported into GeneSpring 7.3. The raw data was print-tip normalized using the lowess function prior to gene filtering. Probes with high background signals (F532<1.5 X B532 or F635<1.5 X B635) were removed from further analysis. For further analysis, only the probes meeting the following requirements were used: first, probes should not have empty values in all three repeat experiments at any time point. and second, no empty values should be present across the four time points. For the analysis of temporal gene expression microarray data, STEM (Short Time-series Expression Miner) was used.17 The dataset was imported into STEM and several gene filtering and statistical criteria were applied to select for the genes showing time-dependent gene expression pattern. First, only the genes showing concordant signals of log ratios (- or + log ratios) in any given time points were used. Genes showing at least a 1.5-fold change (HG versus LG) in at least one time-point were selected. An initial temporal gene expression model
of 1,000,000 was generated. The significance level at which the number of gene assigned to a given model was set at p<0.05, adjusted by the Bonferroni p correction method. A minimum correlation between for different profiles to be included in a given temporal gene expression pattern was set at 0.7. The results of real-time PCR, Western blot, and immunohistochemistry were compared using the Kruskal-Wallis test. Significant differences by the Kruskal-Wallis test were further confirmed by the Mann-Whitney U test. P values less than 0.05 were considered statistically significant.
III. RESULTS
A. Gene expression profile
From the approximately 38,500 genes displayed on the microchip, 3,256 genes having more than a 1.5-fold difference at least at one time point in expression level between the two groups were selected. Genes which showed discordant log ratios in triplicate were excluded. The significance level at which the number of genes assigned to a model (compared to the expected number of genes assigned) was 0.05. Table 2 presents genes with an absolute relative log2 ratio ≥0.45 or ≤-0.45 (i.e., 1.5-fold difference) at least
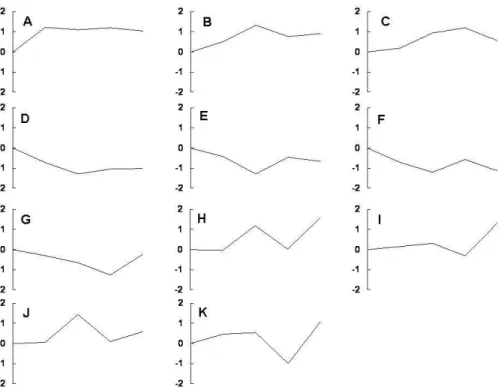
Visualization and Integrated Discovery 2006 (DAVID, http://david.abcc.ncifcrf.gov/) at 2, 6, 24, and 48 hours under high glucose conditions. High glucose stimulated overall metabolism, and genes encoding cytoskeleton and structure related proteins appeared to be disturbed. Many genes related to transcription and differentiation were down-regulated implying a loss of podocyte characteristics. Genes associated with apoptosis were up-regulated, whereas those with anti-apoptosis characteristics were down-regulated. To clarify the functions of the 3,256 differentially expressed genes, the genes were subjected to clustering analysis based on expression patterns and were classified into 11 clusters (cluster A–K), as shown in Figure 1. Three clusters (A-C) consisted of persistently up-regulated genes at each time point. These clusters included genes encoding TSP-1, superoxide dismutase-1 (SOD-1), thrombomodulin, thymosin β-10, VEGF-A, α-actinin-4, and HO-1. Three clusters (D-F) of genes which were persistently down-regulated at each time point were also observed. These clusters included genes encoding ACE2, PPAR-γ, PPAR-α, kidney androgen regulated protein (KAP), regulacin (SMP-30), podocin, thioredoxin 1, and hepatocyte growth factor. The genes identified are tabulated in Table 3 and 4.
Table 2. Genes up- or down-regulated at 2, 6, 24, and 48 hr under high glucose condition
Log2 ratio of differential expression Gene Accession Name 2 hr 6 hr 24 hr 48 hr
Metabolism related
Primary metabolism
NM_011803 Kruppel-like 6 0.27 0.47 0.45 0.32
NM_028774 Ring finger protein (c3h2c3 type) 6 0.67 1.15 0.56 0.99 NM_010115 Kallikrein 1b26 0.70 0.32 0.41 0.51 NM_007600 Calpain 1 0.62 0.10 0.65 0.28 NM_011492 Serine/threonine kinase 11 0.32 0.34 0.31 0.50 NM_008249 Transcription factor b2, mitochondrial 0.73 0.94 1.18 0.87
Free fatty acid synthesis/metabolism
NM_007988 Fatty acid synthase 0.62 0.14 0.48 0.19 NM_009127 Stearoyl-coenzyme A
desaturase 1
0.18 0.44 0.57 0.16
NM_011480 Sterol regulatory element binding factor 1
0.42 0.27 0.55 0.23
NM_027976 Acyl-coA synthetase long-chain family member 5
0.45 0.39 0.17 0.33 NM_133783 Prostaglandin E synthase 2 0.62 0.84 0.47 0.57 NM_015729 Acyl-coenzyme A oxidase 1, palmitoyl 0.14 0.46 0.69 0.23 NM_030721 Acyl-coenzyme A oxidase 3, pristanoyl 0.59 0.25 0.54 0.42 NM_007383 Acyl-coenzyme A
dehydrogenase, short chain
NM_011145 PPAR-delta 0.28 0.54 0.28 0.55 NM_011144 PPAR-alpha -0.53 -0.88 -1.33 -0.58 Glucose metabolism NM_029408 Ig motif containing D 0.41 0.41 0.48 0.40 NM_009716 Activating transcription factor 4 0.65 0.38 0.35 0.41
NM_013509 Enolase 2, gamma neuronal 0.34 0.39 0.60 0.16 NM_009652 Thymoma viral proto-
oncogene 1
0.87 1.37 1.00 0.87
NM_018876 Fucosyltransferase 2 0.36 0.52 -0.08 0.92
NM_008306 Insulin I 0.66 0.70 -0.62 1.24
NM_013636 Protein phosphatase 1, catalytic subunit, gamma isoform 0.51 0.37 0.16 0.20 NM_133232 6-Phosphofructo-2- kinase/fructose-2,6-biphosphatase 3 0.79 0.52 0.65 0.53
NM_028636 Manosidase, alpha, class 2c, member 1
0.54 0.23 0.34 0.38
NM_026522 Riken cdna 3110023e09 gene
0.52 0.34 0.36 0.27
Cytoskeleton and cell structure related
NM_025284 Thymosin β 10 0.32 1.46 0.24 1.24
NM_021895 Actinin α 4 0.76 0.76 0.76 1.01
NM_010017 Dystroglycan 0.76 0.24 0.50 0.34
NM_134024 Tubulin gamma 1 1.04 1.23 0.78 0.98
NM_008787 Pericentrin 0.89 0.97 0.78 1.08
NM_011701 Vimentin 0.20 0.53 0.21 0.15
NM_010303 Guanine nucleotide binding protein, α 13
0.61 0.46 0.62 0.40
NM_023142 Actin related protein 2/3 complex, subunit 1b
0.31 1.29 0.34 0.85
NM_008306 Insulin I 0.66 0.70 -0.62 1.24
NM_010205 FGF 8 0.36 0.77 0.35 0.35
NM_010860 Myosin, light polypeptide 6 0.57 -0.34 0.25 -0.4 NM_013565 Integrin α 3 -0.45 -0.76 -0.22 -0.79
NM_017379 Tubulin α 8 -0.33 -0.90 -0.12 -1.0
NM_010081 Dystonin -0.24 -0.47 -1.03 -0.25
NM_019679 Formin-like 1 -0.72 -0.75 -0.84 -0.38
NM_009509 Villin 1 -0.46 -0.79 -0.59 -0.20
NM_009798 Capping protein muscle z-line, β
-0.08 -0.24 -0.04 -0.53
NM_021285 Myosin, light polypeptide 1 -0.93 -0.89 -0.77 -0.85
Transcription, Differentiation related
NM_008782 Paired box gene 5 (Pax 5) -0.80 -0.70 -0.86 -0.64 NM_010143 Eph receptor b3 -0.86 -1.53 -0.66 -1.31 XM_125745 Integrin β1 binding protein 3 -2.37 -2.95 -2.37 -1.7 NM_011897 Sprouty homolog 2 -0.84 -1.23 -0.59 -1.40 NM_178444 EGF-like domain 7 -0.42 -0.65 -0.65 -0.25 NM_007668 Cyclin-dependent kinase 5 -0.63 -0.82 -1.09 -0.55 NM_010118 Early growth response 2 -0.36 0.59 0.78 -0.15 M31885 Inhibitor of DNA binding 1 -1.05 -1.24 -1.51 -1.07 NM_133208 Zinc finger protein 287 -0.70 -0.59 -0.94 -0.62
NM_016746 Cyclin C -0.54 -0.90 -0.51 -0.74
XM_128139 Sox 10 0.05 -0.55 -0.52 -0.06
NM_009237 Sox 3 0.90 -0.42 -1.15 0.72
NM_011177 Kallikrein 6 0.44 0.54 0.27 0.32
NM_028744 Ring finger protein 6 0.45 0.57 0.41 0.27
XM_203796 Laminin α 5 0.52 0.41 0.41 0.34 Apoptosis related Apoptosis induction NM_009684 Apoptotic peptidase activating factor 1 0.94 1.03 0.47 1.58 NM_013863 Bcl2-associated athanogene 3 0.87 1.88 0.83 1.11 NM_007546 Bcl2-interacting killer 0.30 0.95 0.82 0.85 NM_011632 TNF receptor-associated factor 3 0.53 0.22 0.24 0.18 NM_021310 Junction-mediating and regulartory protein 0.33 0.94 0.82 1.11 NM_021897 Transformation related protein 53 inducible nuclear protein 1 0.27 0.41 0.62 0.18 NM_012016 Endoplasmic reticulum to nucleus signalling 2 0.73 0.64 -0.35 0.92 NM_019464 Sh3-domain grb2-like b1 0.30 0.94 0.27 0.35 NM_007610 Caspase 3 0.09 0.48 0.28 0.13 NM_023229 Fas-activated serine/threonine kinase 0.12 0.46 0.19 0.50 NM_010177 Fas ligand -0.63 -0.60 -0.28 1.21 NM_010205 FGF 8 0.36 0.77 0.35 0.35
XM_134863 PARP -0.37 -0.70 -0.33 -0.90
Anti-apoptosis
NM_009652 Akt-1 0.87 1.37 1.00 0.87
NM_009505 VEGF-A 0.33 0.55 0.61 0.20
NM_024239 Stam binding protein 0.50 -0.13 0.16 -0.25 NM_009429 Tumor protein,
translationally-controlled 1
0.37 0.29 0.56 0.22
NM 009060 SMP-30 -0.92 -2.02 -1.08 -2.11
NM_011810 Fas apoptotic inhibitory molecule
-0.19 -0.49 -0.79 -0.39
NM_027506 Gulp, engulfment adaptor ptb domain containing 1
-0.08 -0.28 -0.56 -0.44
NM_013479 Bcl2-like 10 -0.65 -1.10 -0.75 0.65
NM_008943 Presenilin 1 -0.69 -0.96 -0.83 -0.75
NM_007540 Brain derived neurotrophic factor
-0.73 -0.93 -0.66 -1.02
NM_080637 Expressed in non-metastatic cells 5
-0.37 0.72 -0.39 -0.59
Oxidative stress related
NM_010442 Heme oxygenase-1 0.07 0.34 0.63 0.15 NM_008162 Glutathione peroxidase 4 0.86 1.20 1.04 1.67 NM_011434 Superoxide dismutase 1 1.15 0.66 1.28 1.14 NM_012021 Peroxiredoxin 5 0.58 0.23 0.29 0.07 NM_007452 Peroxiredoxin 3 0.47 0.15 0.03 0.59 NM_013711 Thioredoxin reductase 2 -0.21 1.02 -0.34 1.22 NM_011660 Thioredoxin 1 -0.25 -1.05 -1.10 -0.16
p38 MAPK pathway related
NM_011945 Mitogen activated protein kinase kinase kinase 1 (MEKK1)
0.64 0.11 0.28 0.08
NM_009861 Cell division cycle 42 homolog 0.51 -0.27 0.19 -0.11 XM_289920 Filamin α 0.50 -0.13 0.27 -0.08 NM_008551 Map kinase-activated protein kinase 2 (MAPKAPK) 0.80 0.33 0.46 0.41 NM_009716 Activating transcription factor 4 0.65 0.38 0.35 0.41 NM_009007 Ras-related c3 botulinum substrate 1 0.65 0.39 0.53 0.49
NM_008163 Growth factor receptor bound protein 2
Figure 1. Cluster analysis of differentially expressed genes identified by microarray analysis of LG- and HG-treated podocytes.
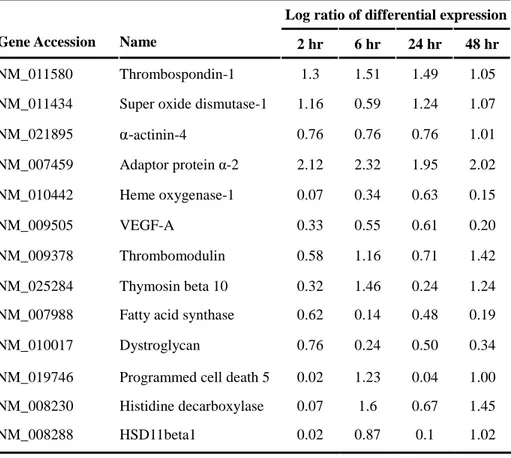
Table 3. The list of genes showing pattern of clusters A-C
Log ratio of differential expression Gene Accession Name 2 hr 6 hr 24 hr 48 hr
NM_011580 Thrombospondin-1 1.3 1.51 1.49 1.05
NM_011434 Super oxide dismutase-1 1.16 0.59 1.24 1.07
NM_021895 α-actinin-4 0.76 0.76 0.76 1.01 NM_007459 Adaptor protein α-2 2.12 2.32 1.95 2.02 NM_010442 Heme oxygenase-1 0.07 0.34 0.63 0.15 NM_009505 VEGF-A 0.33 0.55 0.61 0.20 NM_009378 Thrombomodulin 0.58 1.16 0.71 1.42 NM_025284 Thymosin beta 10 0.32 1.46 0.24 1.24
NM_007988 Fatty acid synthase 0.62 0.14 0.48 0.19
NM_010017 Dystroglycan 0.76 0.24 0.50 0.34
NM_019746 Programmed cell death 5 0.02 1.23 0.04 1.00 NM_008230 Histidine decarboxylase 0.07 1.6 0.67 1.45
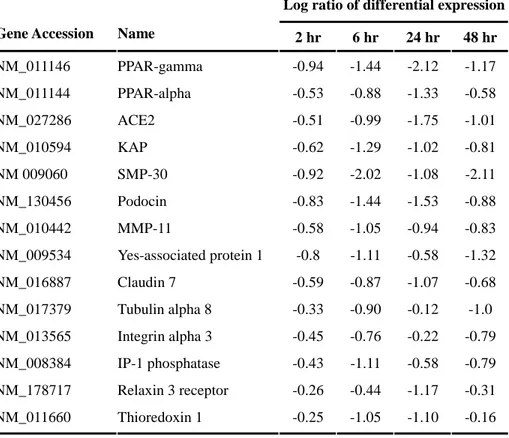
Table 4. The list of genes showing pattern of clusters D-F
Log ratio of differential expression Gene Accession Name 2 hr 6 hr 24 hr 48 hr
NM_011146 PPAR-gamma -0.94 -1.44 -2.12 -1.17 NM_011144 PPAR-alpha -0.53 -0.88 -1.33 -0.58 NM_027286 ACE2 -0.51 -0.99 -1.75 -1.01 NM_010594 KAP -0.62 -1.29 -1.02 -0.81 NM 009060 SMP-30 -0.92 -2.02 -1.08 -2.11 NM_130456 Podocin -0.83 -1.44 -1.53 -0.88 NM_010442 MMP-11 -0.58 -1.05 -0.94 -0.83 NM_009534 Yes-associated protein 1 -0.8 -1.11 -0.58 -1.32 NM_016887 Claudin 7 -0.59 -0.87 -1.07 -0.68 NM_017379 Tubulin alpha 8 -0.33 -0.90 -0.12 -1.0 NM_013565 Integrin alpha 3 -0.45 -0.76 -0.22 -0.79 NM_008384 IP-1 phosphatase -0.43 -1.11 -0.58 -0.79 NM_178717 Relaxin 3 receptor -0.26 -0.44 -1.17 -0.31 NM_011660 Thioredoxin 1 -0.25 -1.05 -1.10 -0.16
B. Real-time PCR
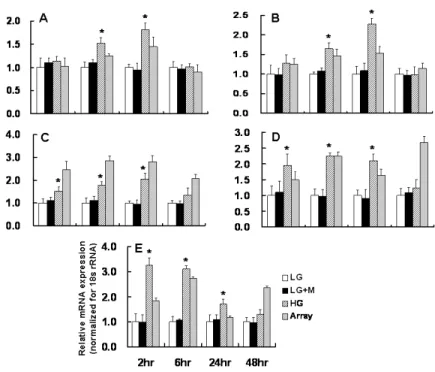
To validate the results obtained from microarray analysis, real-time PCR for several transcripts was performed. Results of the quantification of the mRNA levels for these genes are shown in Figures 2 and 3. Real-time PCR revealed that the mRNA expression of HO-1 and VEGF-A at 6 and 24 hours, and that of TSP-1, thrombomodulin, and thymosin β-10 at 2, 6, and 24 hours were significantly increased in HG-treated podocytes compared to LG-treated podocytes. HO-1, VEGF-A, and TSP-1 mRNA expression assessed by real-time PCR were well correlated with the results of microarray. On the other hand, the mRNA expression of KAP and ACE2 were significantly decreased at 6, 24, and 48 hours, and that of PPAR-γ at all time points, were significantly decreased in podocytes exposed to HG medium compared to LG-treated podocytes. The results of real-time PCR for KAP and ACE2 were also in accordance with the results of microarray analysis.
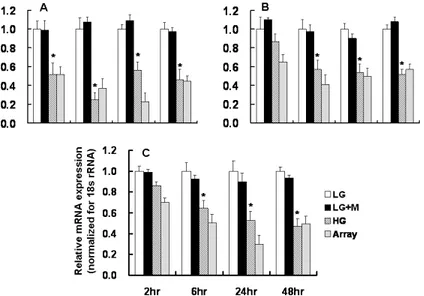
Figure 2. Real-time PCR for the selected genes (cluster A-C) in LG- and HG-treated podocytes. Results of the relative mRNA expression were normalized for 18s rRNA. A: HO-1, B: VEGF-A, C: TSP-1, D: Thrombomodulin, E: Thymosin β-10, * p<0.05 vs. LG at the same time point
Figure 3. Real-time PCR for the selected genes (clusters D-F) in LG- and HG-treated podocytes. Results of the relative mRNA expression were normalized for 18s rRNA. A: PPAR- γ, B: KAP, C: ACE2, * p<0.05 vs. LG at the same time point
C. Western blot analysis
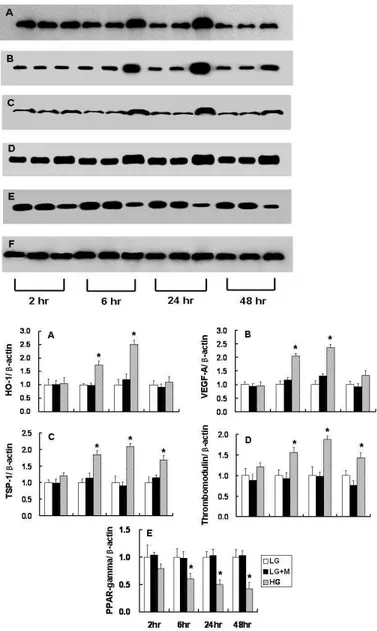
Western blot analysis revealed that the protein expression of HO-1 and VEGF-A at 6 and 24 hours were increased in podocytes exposed to HG. Also, increased expression of TSP-1 and thrombomodulin at 6, 24, and 48 hours was observed in HG-treated podocytes compared to LG-treated podocytes. These findings were similar to the results of microarray and real-time PCR. In addition, decreased expression of PPAR-γ was observed in podocytes exposed to HG compared to LG-treated podocytes at each time point (Figure 4).
Figure 4. Western blot analysis for the selected genes identified based on the results of microarray and real-time PCR. Each set at 2, 6, 24, and 48 hour consisted of podocytes exposed to 5.6 mM glucose (LG), 5.6 mM glucose + mannitol (LG + M) and 30 mM glucose (HG). A: HO-1, B: VEGF-A, C: TSP-1, D: Thrombomodulin, E: PPAR- γ, F: β-actin. * p<0.05 vs. LG at the same time-point.
D. Animal data
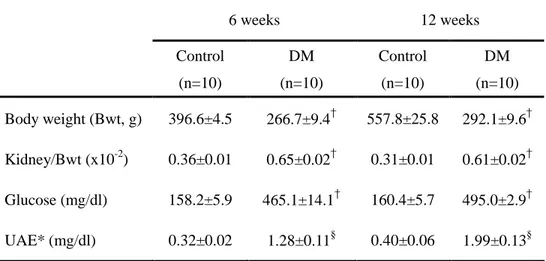
All animals gained weight over the 6- and 12-week experimental period, but weight gain was higher in controls compared to diabetic rats (p<0.01). The ratio of kidney weight to body weight in diabetic rats was significantly higher than in control rats at 6 and 12 weeks. In addition, 24-hour urinary albumin excretion was significantly higher in diabetic rats compared to control rats.
Table 5. Animal data at 6 weeks and 12 weeks after DM induction
6 weeks 12 weeks Control (n=10) DM (n=10) Control (n=10) DM (n=10) Body weight (Bwt, g) 396.6±4.5 266.7±9.4† 557.8±25.8 292.1±9.6† Kidney/Bwt (x10-2) 0.36±0.01 0.65±0.02† 0.31±0.01 0.61±0.02† Glucose (mg/dl) 158.2±5.9 465.1±14.1† 160.4±5.7 495.0±2.9† UAE* (mg/dl) 0.32±0.02 1.28±0.11§ 0.40±0.06 1.99±0.13§
Data are expressed as mean±SEM. * UAE: urinary albumin excretion
†
E. Immunohistochemistry
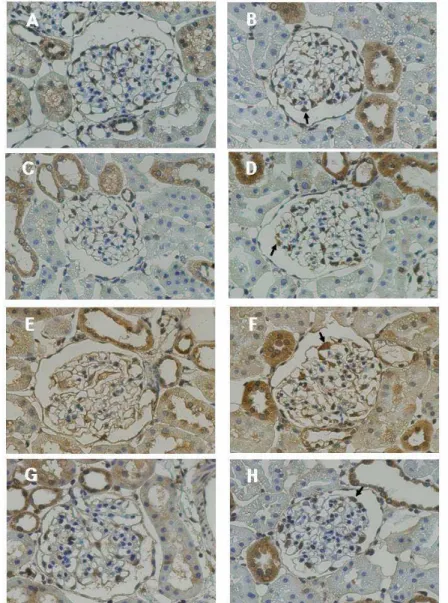
The results of microarray and real-time PCR for HO-1, TSP-1, VEGF-A, ACE2, thrombomodulin, and PPAR-γ were further investigated in control and diabetic kidney using immunohistochemistry. Compared to control glomeruli, HO-1, TSP-1, thrombomodulin, and VEGF-A showed intense epithelial staining along the peripheral capillary loops in 6-week diabetic glomeruli (Figure 5A, A-H), whereas staining for ACE 2 and PPAR-γ were weaker in 6-week diabetic glomeruli (Figure 5B, A-D). At 12 6-weeks after DM induction, TSP-1 and thrombomodulin showed a persistent intense staining in diabetic glomeruli, while staining for HO-1 and VEGF-A was not different between the two groups (Figure 6A, A-H). On the other hand, staining for ACE2 and PPAR-γ were persistently weaker in diabetic glomeruli relative to control at 12 weeks (Figure 6B, A-D).
Figure 5A. Immunohistochemical staining for HO-1, VEGF-A, TSP-1, and thrombomodulin at 6 weeks after DM induction. The positive-stained cells within glomeruli were podocytes (arrow) and mesangial cells, with a clear predominance in the former. The protein expression of HO-1 (A, B), VEGF-A (C, D), TSP-1 (E, F), and thrombomodulin (G, H) were significantly increased in diabetic glomeruli (B, D, F, H) compared to controls (A, C, E, G). (x400)
Figure 5B. Immunohistochemical staining for ACE2 and PPAR-γ at 6 weeks after DM induction. The positive-stained cells within glomeruli were podocytes (arrow) and mesangial cells, with a clear predominance in the former. The protein expression of ACE2 (A, B) and PPAR-γ (C, D) were significantly decreased in diabetic glomeruli (B, D) compared to controls (A, C). (x400)
Figure 6A. Immunohistochemical staining for HO-1, VEGF-A, TSP-1, and thrombomodulin at 12 weeks after DM induction. The positive-stained cells within glomeruli were podocytes (arrow) and mesangial cells, with a clear predominance in the former. The protein expression of HO-1 (A, B) and VEGF-A (C, D) were not different whereas TSP-1 (E, F) and thrombomodulin (G, H) were significantly increased in diabetic glomeruli (B, D, F, H) compared to controls (A, C, E, G). (x400)
Figure 6B. Immunohistochemical staining for ACE2 and PPAR-γ at 12 weeks after DM induction. The positive-stained cells within glomeruli were podocytes (arrow) and mesangial cells, with a clear predominance in the former. The protein expression of ACE2 (A, B) and PPAR-γ (C, D) were significantly decreased in diabetic glomeruli (B, D) compared to controls (A, C). (x400)
IV. DISCUSSION
This study provides for the first time, a comprehensive profile of gene expression in mouse podocytes under high glucose conditions. The results derived from the microarray data were also confirmed using real-time PCR and Western blot analysis. In addition, these changes were further validated in STZ-induced diabetic rats by immunohistochemistry. The results of microarray analysis showed that overall metabolism was increased in podocytes exposed to high glucose, as seen in high glucose-stimulated mesangial cells and the whole diabetic kidney.11-14 Interestingly, genes related to free fatty acid metabolism were increased in podocytes under high glucose conditions. Elevation of free fatty acid levels impairs endothelial function, which appears to be largely attributed to the disturbance of nitric oxide-dependent tone, most likely at the level of the endothelial isoform of nitric oxide synthase (eNOS).18 Moreover, elevation of free fatty acid is involved in some of the potential mediatory mechanisms including oxidative stress and inflammation by the induction of proinflammatory cytokines.18 It is not clear why the expression of genes encoding free fatty acid metabolism is increased in podocytes, but it can be postulated that local activation of free fatty acid metabolism may contribute to podocyte injury or glomerular endothelial
dysfunction.
Genes associated with cytoskeleton or other cellular structures appear to be disturbed in podocytes under high glucose conditions. Among them, the genes encoding α-actinin-4 and dystroglycan were up-regulated. These findings are in agreement with a study by Makino et al.19 Although the role of α-actinin-4 and dystroglycan in diabetic nephropathy remains to be elucidated, induction of these genes might reflect the podocyte repair process in diabetic nephropathy, as in an experimental model of puromycin aminonucleoside nephrosis.20 In addition, the gene encoding thymosin ß-10, a major intracellular G-actin binding protein, was up-regulated. The reason for the increased expression of thymosin ß-10 could be similar to those of α-actinin-4 and dystroglycan. On the other hand, thymosin ß-10 is known to be involved in apoptosis in several cells,21, 22 but the impact of thymosin ß-10 on podocyte apoptosis has never been explored.
Major mediators in the pathogenesis of diabetic nephropathy are oxidative stress7,8,10,23 and renin-angiotensin system (RAS).6,10,24 There have been many studies supporting the role of oxidative stress in experimental diabetic nephropathy models. In addition, high glucose was found to provoke oxidative stress in immortalized podocytes, leading to apoptosis.23 Recently, a growing number of studies have indicated that HO-1 provides protective
effects against virtually all major mechanisms of tissue injury, including oxidative stress.25 In STZ-induced diabetes, up-regulation of HO-1 diminished oxidative stress resulting in the preservation of endothelial cell and vascular dysfunction.26-28 In addition, tubulointerstitial injury was more prominent in HO-2-/- STZ-induced diabetic mice.29 However, even though one study demonstrated increased HO-1 expression in glomerular epithelial cells of STZ-induced diabetic rats,30 the functional role of HO-1 has never been addressed in terms of glomerulopathy, a major feature of diabetic nephropathy. In this study, a gene encoding HO-1 was increased on microarray, and increased HO-1 mRNA and protein expression in podocytes under high glucose conditions were confirmed by real-time PCR and Western blot analysis. Furthermore, these results were further validated in STZ-induced diabetic rats by immunohistochemistry. Interestingly, HO-1 expression was up-regulated in the early stage of diabetic conditions both in vitro and in STZ-induced diabetic rats, and decreased in the late stage. Several studies, including a study by Makino et al., suggested that the early changes of some molecules reflected an adaptive process against diabetic stimuli.19 Whether the early increase in HO-1 expression is also indicative of a protective process needs to be addressed in further studies. In addition, the signal-regulating pathway involved in HO-1 expression needs to be elucidated.
Angiotensin II (AII) is an important mediator in the development and progression of diabetic nephropathy.6,31 In fact, it has been shown that AII is involved in almost all pathophysiological processes implicated in the development of diabetic nephropathy; hemodynamic changes, hypertrophy, extracellular matrix accumulation, growth factor/cytokine induction, ROS formation, proteinuria, and interstitial inflammation.31 In podocytes, AII directly increases TGF-β and VEGF-A expression, reduces nephrin levels, and induces apoptosis and hypertrophy.6 AII is predominantly converted from a decapeptide AI that is synthesized from angiotensinogen by renin. The formation of active AII from inactive AII is mediated by ACE and non-ACE enzymes. There are two types of ACE enzymes: ACE1 and ACE2, and recent studies indicate that ACE2 can counteract ACE1 by converting AII to A(1-7), resulting in less accumulation of AII in tissues.32 Moreover, A(1-7) is known to exert diuretic and natriuretic effects and to inhibit cell proliferation.33-35 Although there have been several studies on the role and changes in the expression of ACE1 in podocytes under diabetic conditions, the role of ACE2 in diabetic nephropathy has not firmly been established. Recently, however, Ye et al. demonstrated that an ACE2 antagonist increased urinary albumin excretion in diabetic micesupporting the counterbalancing action of ACE2 in diabetic nephropathy.36 They also found that ACE2 expression was decreased
in glomeruli, especially in podocytes of diabetic mice. These results are consistent with the present study, showing a persistent decrease in ACE2 mRNA and protein expression at all time points. Therefore, prevention of the decrease in glomerular ACE2 expression in diabetic nephropathy can be postulated as a new therapeutic avenue to reduce proteinuria and to delay the progression.
VEGF-A is produced in podocytes and acts across the glomerular basement membrane upon the glomerular endothelial cells.37 The glomerular endothelial cells develop fenestrations in response to VEGF-A,38 which has been implicated in the pathogenesis of proteinuria.6,38,39 However, experiments designed to demonstrate the role of VEGF-A in various forms of glomerular diseases, including diabetic nephropathy, have produced inconsistent results. Several previous studies demonstrated that VEGF-A expression was increased in diabetic glomeruli39 and in podocytes exposed to high glucose.40 In addition, Sung et al. showed that a VEGF-A receptor blocker restored nephrin expression and ameliorated albuminuria in diabetic mice.41 In contrast, Baelde
et al. observed a decrease in VEGF-A expression in isolated glomeruli from
diabetic patients.42 The reason for the divergence of changes in VEGF-A expression in diabetic nephropathy may be due to a variety of underlying causes, including but not limited to the differences in species and duration of
diabetes.
Numerous studies have supported the protective role of PPAR-γ agonist in diabetic nephropathy. Clinical trials with a PPAR-γ agonist have shown that urinary albumin excretion was reduced in patients with type 2 diabetes.43,44 In addition, the PPAR-γ agonist prevented the glomerular hyperfiltration and albuminuria and protected against nephropathy and pancreatic islet cell abnormalities in Zucker diabetic fatty rats.45 Furthermore, a PPAR-γ agonist restored podocyte staining in immunohistochemistry in a puromycin aminonucleoside nephropathy model46 and preserved nephrin expression in a passive Heymann nephritis model.47 The present study showed that PPAR-γ mRNA and protein expression were decreased in podocytes cultured under high glucose medium, leading to podocyte damage. However, the results of this study contradict the previous report that PPAR-γ expression was increased in HG-treated podocytes.48 It is not clear why there are diverse changes in PPAR-γ expression under diabetic conditions, and further studies are needed to understand the role of PPAR-γ.
Several other genes identified from the microarray analyses are TSP-1, thrombomodulin, and KAP. TSP-1 is another candidate factor in the progression of kidney disease. TSP-1 is known to inhibit proliferation and to directly induce apoptosis in endothelial cells.49 In addition, TSP-1 activates
TGF-β in acute glomerular and tubulointerstitial diseases50 and in mesangial cells exposed to high glucose.51 Moreover, TSP-1 expression was increased in glomerular epithelial cells in patients with focal segmental glomerulosclerosis.52 However, the functional role and the changes in the expression of TSP-1 in diabetic nephropathy are not fully understood. The present study revealed that TSP-1 was up-regulated in podocytes under high glucose conditions and in STZ-induced diabetic glomeruli, suggesting that increased TSP-1 in podocytes may act across the glomerular basement membrane on endothelial cells, leading to endothelial cell damage.
Additionally, though there have been several investigations of thrombomodulin53,54 and KAP55 under diabetic conditions, further studies are needed to verify the linkage between these molecules and podocyte injury.
The present study revealed that HO-1 was up-regulated and ACE2 was down-regulated in podocytes exposed to high glucose. These results imply that the protective roles of some genes are disturbed in podocytes under high glucose condition. In addition, this study suggests that the expression of some genes, such as TSP-1 and VEGF-A, might contribute to diabetic nephropathy. Further study will be needed to verify the specific roles of the genes identified in the present study.
V. CONCLUSION
In this study, the effects of high glucose on time dependent gene expression in podocytes using oligonucleotide microarray were investigated. The results of microarray were validated at the mRNA level by real-time PCR and at the protein level by Western blot analysis. In addition, differentially expressed genes were further validated in STZ-induced diabetic rats using immunohistochemistry.
1. Eleven clusters were classified among 3,256 differentially expressed genes identified by microarray. Three of the 11 clusters consisted of persistently up-regulated genes at each time point. These clusters included genes encoding TSP-1, SOD-1, thrombomodulin, thymosin ß-10, VEGF-A, α-actinin-4, and HO-1. In addition, three clusters of genes which were persistently down-regulated at each time point were observed. These clusters included genes encoding ACE2, PPAR-γ, PPAR-α, KAP, regulacin (SMP-30), podocin, thioredoxin-1, and hepatocyte growth factor.
2. Real-time PCR revealed that the mRNA expression of HO-1 and VEGF-A at 6 and 24 hour, and that of TSP-1, thrombomodulin, and thymosin ß-10 at 2,
6, and 24 hour were significantly increased in podocytes exposed to HG compared to LG-treated podocytes. On the other hand, the mRNA expression of PPAR-γ at all time-points, and that of ACE2 and KAP at 6, 24, and 48 hour were significantly decreased in podocytes exposed to HG compared to LG-treated podocytes.
3. Western blot analysis revealed that the protein expression of HO-1 and VEGF-A at 6 and 24 hour, and that of TSP-1 and thrombomodulin at 6, 24, and 48 hour were significantly increased in podocytes exposed to HG compared to LG-treated podocytes, whereas that of PPAR-γ was significantly decreased at 6, 24, and 48 hour in podocytes exposed to HG compared to LG-treated podocytes.
4. Immunohistochemistry of STZ-induced rat diabetic kidney revealed that the protein expression of HO-1 and VEGF-A were significantly increased at 6 weeks in diabetic glomeruli compared to controls. However, that of HO-1 and VEGF-A were not different between the two groups at 12 weeks. On the other hand, the protein expression of TSP-1 and thrombomodulin were significantly increased, and that of ACE2 and PPAR-γ were significantly decreased at 6 and 12 weeks in diabetic glomeruli compared to controls.
With microarray, the differentially expressed genes of interest were identified in podocyte injury under HG condition and were further validated both in vitro and in STZ-induced diabetic rats. Based on the results of the present study, investigations to elucidate the specific roles of the identified genes of interest will be needed in the future.
REFERENCES
1. USRDS 2004 Annual Data Report, Bethesda, National Institutes of Health, National Institue of Diabetes and Digestive and Kidney Disease, 2004
2. Ziyaeh FN. The extracellular matrix in diabetic nephropathy. Am J Kidney Dis 1993;22:736-44.
3. Wolf G, Ziyadeh FN. Molecular mechanisms of diabetic renal hypertrophy. Kidney Int 1999;56:393-405.
4. Kimmelstiel P, Wilson C. Intercapillary lesions in glomeruli of the kidney. Am J Pathol 1936;12:830-97.
5. Schrijvers BF, De Vriese AS, Flyvbjerg A. From hyperglycemia to diabetic kidney disease: The role of metabolic, hemodynamic, intracellular factors and growth factors/cytokines. Endocr rev 2004;25:971-1010.
6. Wolf G, Butzmann U, Wenzel U. The rennin-angiotensinsystem and progression of renal disease: From hemodynamics to cell biology. Nephron Physiol 2003;93:3-13.
7. Li JM, Shah AM. ROS generation by nonphagocytic NADPH oxidase: Potential relevance in diabetic nephropathy. J Am Soc Nephrol 2003;14:S221-6.
8. Lee HB, Yu MR, Yang Y, Jiang Z, Ha HJ. Reactive oxygen species-regulated signaling pathways in diabetic nphropathy. J Am Soc Nephrol 2003;14:S241-5.
9. Kriz W. Podocyte is the major culprit accounting for the progression of chronic renal disease. Microsc Res Tech 2002;57:188-5.
10. Shankland SJ. The podocyte’s response to injury: Role in proteinuria and glomerulosclerosis. Kidney Int 2006;69:2131-47.
11. Susztak K, Bottinger E, Novetsky A, Liang D, Zhu Y, Ciccone E, et al. Molecular profiling of diabetic mouse kidney reveals novel genes linked to glomerular disease. Diabetes 2004;53:784–94.
12. Wilson KH, Eckenrode SE, Li QZ, Ruan QG, Yang P, Shi JD, et al. Microarray analysis of gene expression in the kidneys of new-and post-onset diabetic NOD mice. Diabetes 2003;52:2151–9.
13. Wilson KH, McIndoe R, Eckenrode S, Morel L, Agarwal A, Croker BP, et al. Alterations of renal phenotype and gene expression profiles due to protein overload in NOD-related mouse strains. BMC Nephrology 2005;6:17
14. Morrison J, Knoll K, Hessner MJ, Liang M. Effect of high glucose on gene expression in mesangial cells: upregulation of the thiol pathway is an adaptational response. Physiol Genomics 2004;17:271-82.
Kriz W, et al. Rearrangements of the cytoskeleton and cell contacts induce process formation during differentiation of conditionally immortalized mouse podocyte cell lines. Exp Cell Res 1997;236:248-58.
16. Doublier S, Ruotsalainen V, Salvidio G, Lupia E, Biancone L, Conaldi PG, et al. Nephrin redistribution on podocytes is a potential mechanism for proteinuria in patients with primary acquired nephrotic syndrome. Am J Pathol 2001;158:1723-31.
17. Ernst J, Bar-Joseph Z. STEM: a tool for the analysis of short time series gene expression data. BMC Bioinformatics 2001;7:191
18. Shankar SS, Steinberg HO. FFAs: do they play a role in vascular disease in the insulin resistance syndrome? Curr Diab Rep 2005;5:30-5.
19. Makino H, Miyamoto Y, Sawai K, Mori K, Mukoyama M, Nakao K, et al. Altered gene expression related to glomerulogenesis and podocyte structure in early diabetic nephropathy of db/db mice and its restoration by pioglitazone. Diabetes 2006;55:2747–56.
20. Guan N, Ding J, Deng J, Zhang J, Yang J. Key molecular events in puromycin aminonucleoside nephrosis rats. Pathol Int 2004;54:703–11. 21. Lee SH, Zhang W, Choi JJ, Cho YS, Oh SH, Kim JW, et al. Overexpression of the thymosin beta-10 gene in human ovarian cancer cells disrupts F-actin stress fiber and leads to apoptosis. Oncogene 2001;20:6700-6.
22. Hall AK. Thymosin beta-10 accelerates apoptosis. Cell Mol Biol Res 1995;41:167-80.
23. Susztak K, Raff AC, Schiffer M, Bottinger EP. Glucose-induced reactive oxygen species cause apoptosis of podocytes and podocyte depletion at the onset of diabetic nephropathy. Diabetes 2006;55:225–33.
24. Gross ML, El-Shakmak A, Szabo A, Koch A, Kuhlmann A, Munter K, et al. ACE-inhibitors but not endothelin receptor blockers prevent podocyte loss in early diabetic nephropathy. Diabetologia 2003;46:856-68.
25. Nath KA. Heme oxygenase-1: A provenance for cytoprotective pathways in the kidney and other tissues. Kindey Int 2006;70:432-43.
26. Quan S, Kaminski PM, Yang L, Morita T, Inaba M, Ikehara S, et al. Heme oxygenase-1 prevents superoxide anion-associated endothelial cell sloughing in diabetic rats. Biochem Biophys Res Commun 2004;315:509–16.
27. Abraham NG, Rezzani R, Rodella L, Kruger A, Taller D, Li Volti G, et al. Overexpression of human heme oxygenase-1 attenuates endothelial cell sloughing in experimental diabetes. Am J Physiol Heart Circ Physiol 2004;287:H2468–77.
28. Turkseven S, Kruger A, Mingone CJ, Kaminski P, Inaba M, Rodella LF, et al. Antioxidant mechanism of heme oxygenase-1 involves an increase in superoxide dismutase and catalase in experimental diabetes. Am J Physiol
Heart Circ Physiol 2005;289:H701–7.
29. Goodman AI, Chander PN, Rezzani R, Schwartzman ML, Regan RF, Rodella L, et al. Heme oxygenase-2 deficiency contributes to diabetes-mediated increase in superoxide anion and renal dysfunction. J Am Soc Nephrol 2006;17:1073–81.
30. Hayashi K, Haneda M, Koya D, Maeda S, Isshiki K, Kikkawa R. Enhancement of glomerular heme oxygenase-1 expression in diabetic rats. Diabetes Res Clin Pract 2001;52:85–96.
31. Wolf G. New insights into the pathophysiology of diabetic nephropathy: from haemodynamics to molecular pathology. Eur J Clin Invest. 2004;34:785-96.
32. Donoghue M, Hsieh F, Baronas E, Godbout K, Gosselin M, Stagliano N, et al. A novel angiotensin-converting enzyme-related carboxypeptidase (ACE2) converts angiotensin I to angiotensin 1–9. Circ Res 2000;87:E1–9. 33. Riviere G, Michaud A, Breton C, VanCamp G, Laborie C, Enache M. Angiotensin-converting enzyme 2 (ACE2) and ACE activities display tissue-specific sensitivity to undernutrition programmed hypertension in the adult rat. Hypertension 2005;46:1169 –74.
34. Ye M, Wysocki J, Naaz P, Salabat R, LaPointe MS, Batlle D. Increased ACE2 and decreased ACE protein in renal tubules from diabetic mice: a
renoprotective combination? Hypertension 2004;43:1120–5.
35. Tikellis C, Johnston CI, Forbes JM, Burns WC, Burrell LM, Risvanis J, et al. Characterization of renal angiotensin-converting enzyme 2 in diabetic nephropathy. Hypertension 2003;41:392–7.
36. Ye M, Wysocki J, William J, Soler MJ, Cokic I, Batlle D. Glomerular localization and expression of angiotensin-converting enzyme 2 and angiotensin-converting enzyme: Implications for albuminuria in diabetes. J Am Soc Nephrol 2006;17:3067–75.
37. Simon M, Grone HJ, Johren O, Kullmer J, Plate KH, Risau W, et al. Expression of vascular endothelial growth factor and its receptors in human renal ontogenesis and in adult kidney. Am J Physiol 1995;268:F240–50. 38. Satchell SC, Tasman CH, Singh A, Ni L, Geelen J, von Ruhland CJ, et al. Conditionally immortalized human glomerular endothelial cells expressing fenestrations in response to VEGF-A. Kidney Int 2006;69:1633-40.
39. Schrijvers BF, Flyvbjerg A, De Vriese AS. The role of vascular endothelial growth factor (VEGF) in renal pathophysiology. Kidney Int 2004;65:2003-17 40. Iglesias-de la Cruz MC, Ziyadeh FN, Isono M, Kouahou M, Han DC, Kalluri R, et al. Effects of high glucose and TGF-beta1 on the expression of collagen IV and vascular endothelial growth factor in mouse podocytes. Kidney Int 2002;62:901-13
41. Sung SH, Ziyadeh FN, Wang A, Pyagay PE, Kanwar YS, Chen S. Blockade of vascular endothelial growth factor signaling ameliorates diabetic albuminuria in mice. J Am Soc Nephrol 2006;17:3093-104.
42. Baelde HJ, Eikmans M, Doran PP, Lappin DW, de Heer E, Bruijn JA. Gene expression profiling in glomeruli from human kidneys with diabetic nephropathy. Am J Kid Dis 2004;43:636-50.
43. Bakris G, Viberti G, Weston WM, Heise M, Porter LE, Freed MI. Rosiglitazone reduces urinary albumin excretion in type II diabetes. J Hum Hypertens 2003;17:7–12.
44. Nakamura T, Ushiyama C, Suzuki S, Shimada N, Sekizuka K, Ebihara L, et al. Effect of troglitazone on urinary albumin excretion and serum type IV collagen concentrations in Type 2 diabetic patients with microalbuminuria or macroalbuminuria. Diabet Med 2001;18:308–13.
45. Buckingham RE, Al-Barazanji KA, Toseland CD, Slaughter M, Connor SC, West A. Peroxisome proliferator-activated receptor-gamma agonist, rosiglitazone, protects against nephropathy and pancreatic islet abnormalities in Zucker fatty rats. Diabetes 1998;47:1326–34.
46. Yang HC, Ma LJ, Ma J, Fogo AB. Peroxisome proliferator-activated receptor-gamma agonist is protective in podocyte injury-associated sclerosis. Kidney Int 2006;69:1756-64.
47. Benigni A, Zoja C, Tomasoni S, Campana M, Coma D, Zanchi C. Transcriptional regulation of nephrin gene by peroxisome proliferator– activated receptor-γ agonist: molecular mechanism of the antiproteinuric effect of pioglitazone. J Am Soc Nephrol 2006;17:1624–32.
48. Okada T, Wada J, Hida K, Eguchi J, Hashimoto I, Baba M. Thiazolidinediones ameliorate diabetic nephropathy via cell cycle-dependent mechanisms. Diabetes 2006;55:1666–77.
49. Guo N, Krutzsch HC, Inman JK, Roberts DD. Thrombospondin 1 and type 1 repeat peptides of thrombospondin 1 specifically induce apoptosis of endothelial cells. Cancer Res 1997;57:1735–42.
50. Hugo C, Shankland S, Pichler R, Couser WG, Johnson RJ. Thrombospondin 1, a TGF-β activating protein, precedes and predicts the development of tubulointerstitial fibrosis in glomerular disease. Kidney Int 1998;53:302–11.
51. Yevdokimova N, Wahab NA, Mason R. Thrombospondin 1 is the key activator of TGF-β 1 in human mesangial cells exposed to high glucose. J Am Soc Nephrol 2001;12:703–12.
52. Kim JH, Kim BK, Moon KC, Hong HK, Lee HS. Activation of the
TGF-β/Smad signaling pathway in focal segmental glomerulosclerosis. Kidney Int
53. Yano Y, Kitagawa N, Gabazza EC, Morioka K, Urakawa H, Tanaka T et al. Increased plasma thrombin-activatable fibrinolysis inhibitor levels in normotensive type 2 diabetic patients with microalbuminuria. J Clin Endocrinol Metab 2006;88:736–41.
54. Iwashima Y, Sato T, Watanabe K, Ooshima E, Hiraishi S, Ishii H. Elevation of plasma thrombomodulin levels in diabetic patients with early diabetic nephropathy. Diabetes 1990;39:983–7.
55. Cebrian C, Areste C, Nicolas A, Olive P, Carceller A, Piulats J, et al. The kidney androgen-regulated protein interacts with cyclophilin B and diminishes CsA-mediated toxicity in proximal tubule cells. J Biol Chem 2001; 276;29410-9.
국문요약
국문요약
국문요약
국문요약
고포도당으로
고포도당으로
고포도당으로
고포도당으로 자극한
자극한
자극한
자극한 족세포에서
족세포에서
족세포에서
족세포에서 유전자
유전자
유전자 발현의
유전자
발현의
발현의
발현의 변화
변화
변화
변화
<지도교수
지도교수
지도교수
지도교수 강
강
강 신
강
신
신
신 욱
욱
욱>
욱
연세대학교
연세대학교
연세대학교
연세대학교 의과대학
의과대학
의과대학 의학과
의과대학
의학과
의학과
의학과
한
한
한
한 승
승
승
승 혁
혁
혁
혁
서론 서론 서론 서론: 당뇨병성 신병증은 전세계적으로 말기신부전의 가장 흔한 원 인이다. 당뇨병성 신병증은 병리학적으로 사구체와 세뇨관의 비대, 기저막의 비후, 그리고 세포외기질의 축적을 특징적으로 하며,transforming growth factor-ß (TGF-ß), protein kinase C (PKC) pathway, mitogen-activated protein kinase (MAPK) pathway, rennin-angiotensin system (RAS), 그리고 reactive oxygen species (ROS) 등이 병인론에 중
요한 인자들로 알려져 있다. 최근에는 족세포의 손상이 당뇨병성 신 병증뿐 아니라, 다른 신장질환의 초기 병변이며, 이로 인해 단백뇨 와 사구체 경화가 유발된다고 알려져 있다. 그러나, ROS, mechanical
stretch, anigotensin II, TGF-ß 등이 족세포 손상에 중요한 것으로 알려
져 있으나, 아직까지 족세포 손상의 정확한 기전은 알려져 있지 않 으며, 족세포에 특이한 유전자 발현차이는 보고된 바가 없다. 따라
서 본연구에서는 고포도당으로 족세포를 자극한 후, 시간에 따른 유 전자 발현의 차이를 조사하고, 족세포 손상에 관여하는 유전자를 규 명하고자 하였다. 방법 방법 방법 방법: 족세포를 33℃에서 감마 인터페론이 포함된 배양액으로 계대 배양하였으며, 이후 37℃에서 감마 인터페론이 없는 배양액으로 배 양하면서 분화시켰다. 족세포의 분화를 확인한 후 우태아혈청이 없 는 배양액으로 24시간 동안 배양한 다음, 5.6 mM 포도당 (LG), LG + 24.4 mM 만니톨 (LG+M), 30 mM 포도당 (HG) 배양액으로 배양하였 다. 포도당으로 자극을 준 족세포에서 RNA와 단백을 각각 2, 6, 24, 48 시간에 추출한 후 38,000 유전자 정보를 가진 chip을 이용하여 oligonucleotide microarray를 각 시간마다 세 번 반복 실험하였다. Microarray 결과를 확인하기 위하여 mRNA 발현은 real-time
polymerase chain reaction (PCR)으로, 단백 발현은 Western blot을 시행
하였다. 동물 실험에서 확인하고자, 백서에 streptozotocin을 복강 내 로 주입하여 제 1형 당뇨를 유발시킨 후 6주와 12주에 희생시켜 면 역 조직화학 염색을 시행하였다. Results: Microarray 분석상, 각 시간대에서 로그 값을 취하였을 때 모 두 양 또는 음의 부호를 보이며, 적어도 1회 이상 LG 군에 비해 HG 군에서 1.5배 이상 발현차이를 보인 3,256개 유전자를 찾을 수 있었다. 이중 통계학적으로 의미있는 cluster는 11개였으며, 이중 3개