Open Access
Education Level Is a Strong Prognosticator in the Subgroup Aged
More Than 50 Years Regardless of the Molecular Subtype of Breast Cancer:
A Study Based on the Nationwide Korean Breast Cancer Registry Database
Original ArticlePurpose
This study investigated the role of the education level (EL) as a prognostic factor for breast cancer and analyzed the relationship between the EL and various confounding factors. Materials and Methods
The data for 64,129 primary breast cancer patients from the Korean Breast Cancer Registry were analyzed. The EL was classified into two groups according to the education period; the high EL group ( 12 years) and low EL group (< 12 years). Survival analyses were performed with respect to the overall survival between the two groups.
Results
A high EL conferred a superior prognosis compared to a low EL in the subgroup aged > 50 years (hazard ratio, 0.626; 95% confidence interval [CI], 0.577 to 0.678) but not in the sub-group aged 50 years (hazard ratio, 0.941; 95% CI, 0.865 to 1.024). The EL was a signif-icant independent factor in the subgroup aged > 50 years according to multivariate analyses. The high EL group showed more favorable clinicopathologic features and a higher proportion of patients in this group received lumpectomy, radiation therapy, and endocrine therapy. In the high EL group, a higher proportion of patients received chemotherapy in the subgroups with unfavorable clinicopathologic features. The EL was a significant prognosti-cator across all molecular subtypes of breast cancer.
Conclusion
The EL is a strong independent prognostic factor for breast cancer in the subgroup aged > 50 years regardless of the molecular subtype, but not in the subgroup aged 50 years. Favorable clinicopathologic features and active treatments can explain the main causality of the superior prognosis in the high EL group.
Key words
Breast neoplasms, Education, Educational status, Prognosis, Survival analysis
Ki-Tae Hwang,
MD, PhD1Woochul Noh,
MD, PhD2Se-Heon Cho,
MD, PhD3Jonghan Yu,
MD, PhD4Min Ho Park,
MD, PhD5Joon Jeong,
MD, PhD6Hyouk Jin Lee,
MD7Jongjin Kim,
MD1Sohee Oh,
PhD8Young A Kim,
MD, PhD9Korean Breast Cancer Society
*+ + + + + + + + + + + + + + + + + + + + + + + + + + + + + + + + + + + + + + + + + + + + + + + + + + + + + + + + + + + + + + + + + + + + + + + + + + + + + + + + + + + + + + + + + + + + + + + + + + + + + + + + + + + + + + + + + + + + + + + + + + + + + + + + + + + + + + + + + + + + + + + + + + + + + + + + + + + + + + + + + + + + + + + + + + + + + + + + + + + + + + + + + + + + + + + + + + + + + + + + + + + + + + + + + + + + + + + + + + + + + + + + + + + + + + + + + + + + + + + + + + + + + + + + + + + + + + + + + + + + + + + + + + + + + + + + + + + + + + + + + + + + + + + + + + + + + + + + + + + + + + + + + + + + + + + + + + + + + + + +
Correspondence: Ki-Tae Hwang, MD, PhD Department of Surgery, SMG-SNU Boramae Medical Center, 20 Boramae-ro 5-gil, Dongjak-gu, Seoul 07061, Korea Tel: 82-2-870-2275 Fax: 82-2-831-2826 E-mail: kiterius@snu.ac.kr Received November 4, 2016 Accepted January 24, 2017 Published Online February 2, 2017 *A list of the members of the Korean Breast Cancer Society appears at the end the paper.
1Department of Surgery, SMG-SNU Boramae
Medical Center, Seoul, 2Department of
Surgery, Korea Cancer Center Hospital, Seoul,
3Department of Surgery, Dong-A University
Medical Center, Busan, 4Department of
Surgery, Samsung Medical Center, Seoul,
5Department of Surgery, Chonnam National
University Medical School, Gwangju,
6Department of Surgery, Gangnam Severance
Hospital, Yonsei University College of
Medicine, Seoul, 7Saegyaero Hospital, Busan,
Departments of 8Biostatistics and
9Pathology, SMG-SNU Boramae
Introduction
The prognostic role of the education level (EL) in breast cancer is largely unknown. Although the EL has occasionally been suggested to be a prognostic factor for breast cancer, previous studies have not provided consistent results on this relationship. Some papers reported that a higher EL was associated with higher survival rates [1-4] but others reported no correlation between the EL and breast cancer survival [5-7]. Furthermore, some papers presented totally opposite results, suggesting that patients with a high EL had a higher mortality [8-11]. Therefore, more evidence is needed to determine the role of the EL as a prognostic factor for breast cancer.
Although the EL is a significant prognostic factor in breast cancer, there is very little information on the relationship between the EL and the prognosis of breast cancer. Only a few papers have investigated the relationship between the EL and breast cancer prognosis directly [2,5,10], and the other papers have dealt with the EL or breast cancer as a part of their investigation, e.g., breast cancer as a part of all can-cers, or the EL as a part of the socioeconomic status. Most papers only reported the hazard ratio or relative risk of the EL with respect to mortality in breast cancer, and they sel-dom reported further analyses of the relationship between the EL and breast cancer prognosis. For example, there is lit-tle information on the following question: “To which sub-group of breast cancer patients could the prognostic impact of EL be applied?”
Although some studies stated that the EL was a significant prognosticator in breast cancer, they barely described the plausible causality regarding how the EL can affect the prog-nosis of breast cancer. Many possible confounding factors between the EL and breast cancer prognosis can make it dif-ficult to interpret the EL as a prognostic factor on its own. Therefore, it is essential to adequately adjust for these con-founding factors for precise analyses of the relationship between the EL and the breast cancer prognosis. Further-more, as a relatively small number of enrolled subjects have been the major obstacles to the establishment of the EL as a prognostic factor, an adequate number of subjects are needed to maintain the statistical power of subgroup analyses, which could be used to determine the effects of various confound-ing factors on the EL as a prognostic factor for breast cancer. In this study, an attempt was made to categorize the con-founding factors that could be associated with the EL into three groups: biological factors, treatment factors, and other factors. The biological factors cover the clinicopathologic fac-tors, including age, body mass index (BMI), tumor size, nodal positivity, stage, hormonal receptor (HR), human epi-dermal growth factor receptor 2 (HER2), histologic grade,
and lymphovascular invasion. The treatment factors include the operation period, surgery, radiation therapy, chemother-apy, and hormonal therapy. Other factors include all factors other than biological and treatment factors.
Currently, adjuvant treatments for breast cancer are pla-nned based on the molecular subtypes according to the expression of the estrogen receptor, progesterone receptor, and HER2. The prognostic impact of the EL on each molecu-lar subtype of breast cancer has not been reported. Therefore, it is necessary to examine the prognostic impact of the EL on each molecular subtype.
Since 1996, the Korean Breast Cancer Society has collected nationwide data for breast cancer patients in the Republic of Korea by developing the Korean Breast Cancer Registry pro-gram, and a large amount of data has been accumulated [12]. This study attempted to validate the role of the EL as a prog-nostic factor for breast cancer, and carry out subgroup analy-ses using this database. The causality between EL and breast cancer through which the EL can affect the prognosis of breast cancer and the prognostic effect of EL on the molecular subtypes of breast cancer were also investigated.
Materials and Methods
1. Patients
The Korean Breast Cancer Society has collected nationwide breast cancer data prospectively since 1996; retrospective data collection was also allowed when a participating hospi-tal had its own breast cancer database. The tohospi-tal number of patients registered in the Korean Breast Cancer Registry at the time of this study was 156,632. Because the survival data had been updated up to December 31, 2014, 4,689 patients, who underwent surgery after January 1, 2015, were exclu-ded. After further excluding 78,987 patients because of a lack of information on education (956 patients with stage IV at the initial diagnosis, and 7,871 patients with a Tis lesion) the data of 64,129 patients were finally analyzed. The institutional review boards approved this study.
2. Definitions of education period and EL
The education system in South Korea consists of five pro-grams; 6 years of elementary school, 3 years of middle school, 3 years of high school, 2 or 4 years of college or uni-versity, and more than 2 years of graduate school. The edu-cation period was divided into five groups according to the length of the education period: the no diploma group (< 6 years), elementary school group (6-8 years), middle school
E d u ca ti on p er io d E d u ca ti on l ev el C h ar ac te ri st ic 5 6-8 9-11 12 -1 3 14 T ot al p f or L ow H ig h C h i-sq u ar e a) tr en d p -v al u e T ot al 2, 03 5 (3 .2 ) 8, 43 4 (1 3. 2) 9, 95 5 (1 5. 5) 25 ,4 64 ( 39 .7 ) 18 ,2 41 (2 8. 4) 64 ,1 29 ( 10 0) 20 ,4 24 ( 31 .8 ) 43 ,7 05 ( 68 .2 ) M ea n a ge ( yr ) 64 .3 9± 10 .3 55 59 .5 8± 9. 59 1 53 .3 ±8 .8 25 47 .6 7± 8. 95 6 44 .5 4± 9. 06 2 49 .7 5± 10 .6 62 < 0 .0 01 57 .0 0± 10 .0 75 46 .3 7± 9. 13 2 < 0 .0 01 A ge ( yr ) 50 22 7 (1 1. 2) 1, 54 4 (1 8. 3) 4, 16 1 (4 1. 8) 17 ,2 44 ( 67 .7 ) 14 ,3 58 ( 78 .7 ) 37 ,5 34 ( 58 .5 ) < 0 .0 01 5, 93 2 (2 9. 0) 31 ,6 02 ( 72 .3 ) < 0 .0 01 > 5 0 1, 80 8 (8 8. 8) 6, 88 8 (8 1. 7) 5, 79 3 (5 8. 2) 8, 21 9 (3 2. 3) 3, 88 2 (2 1. 3) 26 ,5 90 ( 41 .5 ) 14 ,4 89 ( 71 .0 ) 12 ,1 01 ( 27 .7 ) T u m or s iz e (c m ) 2 98 1 (4 9. 1) 4, 38 5 (5 3. 0) 5, 30 6 (5 4. 3) 14 ,2 68 ( 57 .2 ) 10 ,6 88 ( 60 .4 ) 35 ,6 28 ( 56 .9 ) < 0 .0 01 10 ,6 72 ( 53 .2 ) 24 ,9 56 ( 58 .6 ) < 0 .0 01 > 2 1, 01 6 (5 0. 9) 3, 88 6 (4 7. 0) 4, 47 2 (4 5. 7) 10 ,6 59 ( 42 .8 ) 6, 99 8 (3 9. 6) 27 ,0 31 ( 43 .1 ) 9, 37 4 (4 6. 8) 17 ,6 57 ( 41 .4 ) N od e p os it iv it y N o 1, 18 5 (5 9. 2) 5, 13 5 (6 1. 6) 6, 14 0 (6 2. 2) 15 ,9 76 ( 63 .4 ) 11 ,7 48 ( 65 .3 ) 40 ,1 84 ( 63 .4 ) < 0 .0 01 12 ,4 60 ( 61 .6 ) 27 ,7 24 ( 64 .2 ) < 0 .0 01 Y es 81 5 (4 0. 8) 3, 20 1 (3 8. 4) 3, 73 7 (3 7. 8) 9, 23 5 (3 6. 6) 6, 24 8 (3 4. 7) 23 ,2 36 ( 36 .6 ) 7, 75 3 (3 8. 4) 15 ,4 83 ( 35 .8 ) S ta ge I 70 8 (3 5. 9) 3, 28 2 (4 0. 0) 4, 02 1 (4 1. 3) 10 ,8 88 ( 43 .9 ) 8, 28 6 (4 7. 1) 27 ,1 85 ( 43 .7 ) < 0 .0 01 8, 01 1 (4 0. 2) 19 ,1 74 ( 45 .3 ) < 0 .0 01 II , I II 1, 26 3 (6 4. 1) 4, 92 6 (6 0. 0) 5, 70 9 (5 8. 7) 13 ,8 93 ( 56 .1 ) 9, 29 2 (5 2. 9) 35 ,0 83 ( 56 .3 ) 11 ,8 98 ( 59 .8 ) 23 ,1 85 ( 54 .7 ) H or m on al r ec ep to r N eg at iv e 59 0 (3 2. 3) 2, 57 3 (3 3. 9) 2, 97 1 (3 2. 8) 6, 58 9 (2 8. 1) 4, 44 2 (2 6. 2) 17 ,1 65 ( 29 .2 ) < 0 .0 01 6, 13 4 (3 3. 2) 11 ,0 31 ( 27 .3 ) < 0 .0 01 P os it iv e 1, 23 8 (6 7. 7) 5, 01 0 (6 6. 1) 6, 08 4 (6 7. 2) 16 ,8 18 ( 71 .9 ) 12 ,5 21 ( 73 .8 ) 41 ,6 71 ( 70 .8 ) 12 ,3 32 ( 66 .8 ) 29 ,3 39 ( 72 .7 ) H E R 2 N eg at iv e 1, 10 5 (7 4. 9) 4, 63 2 (7 3. 0) 5, 03 3 (7 0. 9) 14 ,6 28 ( 75 .3 ) 11 ,1 59 ( 77 .6 ) 36 ,5 57 ( 75 .0 ) < 0 .0 01 10 ,7 70 ( 72 .2 ) 25 ,7 87 ( 76 .2 ) < 0 .0 01 P os it iv e 37 1 (2 5. 1) 1, 71 6 (2 7. 0) 2, 06 7 (2 9. 1) 4, 80 8 (2 4. 7) 3, 22 5 (2 2. 4) 12 ,1 87 ( 25 .0 ) 4, 15 4 (2 7. 8) 8, 03 3 (2 3. 8) H is to lo gi c gr ad e 1, 2 1, 08 0 (6 4. 3) 4, 41 8 (6 3. 1) 5, 04 6 (6 1. 2) 13 ,7 18 ( 64 .0 ) 10 ,1 94 ( 65 .1 ) 34 ,4 56 ( 63 .8 ) < 0 .0 01 10 ,5 44 ( 62 .3 ) 23 ,9 12 ( 64 .5 ) < 0 .0 01 3 59 9 (3 5. 7) 2, 58 0 (3 6. 9) 3, 20 3 (3 8. 8) 7, 70 8 (3 6. 0) 5, 47 0 (3 4. 9) 19 ,5 60 ( 36 .2 ) 6, 38 2 (3 7. 7) 13 ,1 78 ( 35 .5 ) L ym p h ov as cu la r in va si on N o 93 4 (5 9. 7) 4, 06 6 (6 3. 1) 4, 29 6 (6 2. 8) 12 ,0 88 ( 63 .3 ) 8, 89 3 (6 6. 1) 30 ,2 77 ( 63 .9 ) < 0 .0 01 9, 29 6 (6 2. 6) 20 ,9 81 ( 64 .4 ) < 0 .0 01 Y es 63 1 (4 0. 3) 2, 37 7 (3 6. 9) 2, 54 9 (3 7. 2) 7, 01 5 (3 6. 7) 4, 56 9 (3 3. 9) 17 ,1 41 ( 36 .1 ) 5, 55 7 (3 7. 4) 11 ,5 84 ( 35 .6 ) B od y m as s in d ex 25 1, 00 7 (5 1. 3) 4, 20 9 (5 1. 2) 5, 95 5 (6 1. 0) 18 ,3 25 ( 73 .1 ) 14 ,6 09 ( 81 .2 ) 44 ,1 05 ( 70 .0 ) < 0 .0 01 11 ,1 71 ( 56 .0 ) 32 ,9 34 ( 76 .5 ) < 0 .0 01 > 2 5 95 6 (4 8. 7) 4, 01 2 (4 8. 8) 3, 81 3 (3 9. 0) 6, 73 8 (2 6. 9) 3, 37 3 (1 8. 8) 18 ,8 92 ( 30 .0 ) 8, 78 1 (4 4. 0) 10 ,1 11 ( 23 .5 ) O p er at io n p er io d 19 87 -2 00 5 75 1 (3 6. 9) 2, 56 5 (3 0. 4) 3, 86 0 (3 8. 8) 7, 26 6 (2 8. 5) 4, 13 4 (2 2. 7) 18 ,5 76 ( 29 .0 ) < 0 .0 01 7, 17 6 (3 5. 1) 11 ,4 00 ( 26 .1 ) < 0 .0 01 20 06 -2 01 0 77 5 (3 8. 1) 3, 31 7 (3 9. 3) 3, 28 5 (3 3. 0) 9, 39 8 (3 6. 9) 6, 20 1 (3 4. 0) 22 ,9 76 ( 35 .8 ) 7, 37 7 (3 6. 1) 15 ,5 99 ( 35 .7 ) 20 11 -2 01 4 50 9 (2 5. 0) 2, 55 2 (3 0. 3) 2, 81 0 (2 8. 2) 8, 80 0 (3 4. 6) 7, 90 6 (4 3. 3) 22 ,5 77 ( 35 .2 ) 5, 87 1 (2 8. 7) 16 ,7 06 ( 38 .2 ) O p er at io n L u m p ec to m y 76 4 (3 8. 4) 3, 91 5 (4 7. 3) 4, 88 9 (5 0. 0) 14 ,4 22 ( 57 .6 ) 11 ,0 08 ( 61 .5 ) 34 ,9 98 ( 55 .6 ) < 0 .0 01 9, 56 8 (4 7. 7) 25 ,4 30 ( 59 .2 ) < 0 .0 01 M as te ct om y 1, 22 3 (6 1. 6) 4, 36 5 (5 2. 7) 4, 88 9 (5 0. 0) 10 ,6 05 ( 42 .4 ) 6, 89 8 (3 8. 5) 27 ,9 80 ( 44 .4 ) 10 ,4 77 ( 52 .3 ) 17 ,5 03 ( 40 .8 ) T ab le 1 . C li n ic op at h ol og ic c h ar ac te ri st ic s ac co rd in g to th e ed u ca ti on p er io d a n d e d u ca ti on le ve l i n a ll s u bj ec ts
group (9-11 years), high school group (12-13 years), and col-lege group ( 14 years). The EL was classified further into two groups: the high EL group ( 12 years) and the low EL group (< 12 years). In this study, kindergarten or preschool programs were excluded.
3. Clinicopathologic parameters
The patients’ ages were defined as the age at the time of the diagnosis of the primary breast cancer. The TNM staging was described according to the seventh edition of the Amer-ican Joint Committee on Cancer. The HR status was defined as positive when the immunohistochemistry tests for either estrogen or progesterone receptors were positive, and was defined as negative when both tests were negative. HER2 was defined as negative when the immunohistochemistry results were negative or 1+, and positive when the results were 3+. When the results were 2+, the positivity of HER2 was defined according to the results of fluorescence in situ hybridization. The histological grade was defined using the modified Scarff-Bloom-Richardson grading system. Lym-phovascular invasion was defined as positive when either lymphatic invasion or vascular invasion was positive, and as negative when both tests were negative. The BMI was defined as the ratio of the body weight in kilograms to the square of the height in meters. All operations with curative intent for breast cancer patients were classified as breast con-serving surgery or total mastectomy according to the extent of surgery for the breast tissue. The molecular subtypes were classified into four categories, including HR(+)/HER2(–), HR(+)/HER2(+), HR(–)/HER2(+), and HR(–)/HER2(–) according to the expression of HR and HER2.
4. Statistical analyses
A two sample t test and Pearson’s chi-square test were used to determine the differences in the clinicopathologic characteristics between pairs of groups. The p-value for the trend was calculated using the linear by linear association test in a Pearson’s chi-square test. All survival analyses were carried out with respect to the overall survival, and the time duration of the overall survival was defined as the time from surgery to death from any cause. The Kaplan-Meier estima-tor was used to analyze the survival rates and a log-rank test was used to determine the significance of the differences between two or more survival curves. A Cox-proportional hazards model was used for univariate and multivariate analyses, and the HR was calculated using a 95% confidence interval (CI). All statistical analyses, except for the forest plot, were carried out using IBM SPSS Statistics ver. 20.0 (IBM Corp., Armonk, NY), and the forest plot was produced using Microsoft Excel (Microsoft Office Professional Plus 2010). All
E d u ca ti on p er io d E d u ca ti on l ev el C h ar ac te ri st ic 5 6-8 9-11 12 -1 3 14 T ot al p f or L ow H ig h C h i-sq u ar e a) tr en d p -v al u e R ad ia ti on t h er ap y N o 86 6 (5 1. 1) 2, 99 7 (4 2. 7) 3, 52 9 (4 1. 1) 7, 48 3 (3 3. 7) 5, 03 6 (3 1. 1) 19 ,9 11 ( 35 .7 ) < 0 .0 01 7, 39 2 (4 2. 7) 12 ,5 19 ( 32 .6 ) < 0 .0 01 Y es 83 0 (4 8. 9) 4, 02 4 (5 7. 3) 5, 06 2 (5 8. 9) 14 ,7 06 ( 66 .3 ) 11 ,1 74 ( 68 .9 ) 35 ,7 96 ( 64 .3 ) 9, 91 6 (5 7. 3) 25 ,8 80 ( 67 .4 ) C h em ot h er ap y N o 59 4 (3 3. 8) 1, 98 8 (2 7. 2) 2, 33 5 (2 6. 0) 5, 70 3 (2 4. 7) 5, 20 0 (3 1. 1) 15 ,8 20 ( 27 .4 ) < 0 .0 01 4, 91 7 (2 7. 2) 10 ,9 03 ( 27 .4 ) < 0. 66 2 Y es 1, 16 3 (6 6. 2) 5, 32 6 (7 2. 8) 6, 64 0 (7 4. 0) 17 ,3 42 ( 75 .3 ) 11 ,5 15 ( 68 .9 ) 41 ,9 86 ( 72 .6 ) 13 ,1 29 ( 72 .8 ) 28 ,8 57 ( 72 .6 ) H or m on al t h er ap y N o 51 4 (4 6. 4) 2, 25 7 (4 4. 0) 2, 71 0 (4 2. 8) 6, 36 8 (3 6. 7) 4, 70 5 (3 6. 5) 16 ,5 54 ( 38 .6 ) < 0 .0 01 5, 48 1 (4 3. 6) 11 ,0 73 ( 36 .6 ) < 0 .0 01 Y es 59 4 (5 3. 6) 2, 87 6 (5 6. 0) 3, 62 1 (5 7. 2) 10 ,9 87 ( 63 .3 ) 8, 20 1 (6 3. 5) 26 ,2 79 ( 61 .4 ) 7, 09 1 (5 6. 4) 19 ,1 88 ( 63 .4 ) T ab le 1 . C on ti n u ed H E R 2, h u m an e p id er m al g ro w th fa ct or r ec ep to r 2. a)p -v al u es fo r th e m ea n ag e w er e ca lc u la te d b y t t es t a nd a ll th e ot he r p -v al u es w er e ca lc u la te d b y ch i-sq u ar e te st .
tests were two-sided, and a p-value of < 0.05 was considered significant. The biological model, treatment model, and com-bined model were designed for multivariate analyses. In the biological model, nine factors, including age, tumor size, node positivity, stage, HR, HER2, histologic grade, lympho-vascular invasion, and BMI, were used to adjust for the EL. In the treatment model, five factors, including the operation period, operation, radiation therapy, chemotherapy, and hor-monal therapy, were used. In the combined model, all four-teen factors described above were used.
Results
1. Clinicopathologic characteristics
The total number of subjects was 64,129, and the mean age of all subjects was 49.8±10.7 years. Their operation dates were between January 1987 and December 2014, and the mean fol-low-up period was 71.3±51.7 months (range, 0 to 335 months). The total number of deaths during the period was 6,010 (9.4%). According to the length of the education period, the high school group showed the highest frequency (n=25,464, 39.7%), followed in order by the college group (n=18,241, 28.4%), mid-dle school group (n=9,955, 15.5%), elementary school group (n=8,434, 13.2%), and no diploma group (n=2,035, 3.2%). The frequencies of the low and high EL groups were 31.8%
(n=20,424) and 68.2% (n=43,705), respectively. Table 1 lists the clinicopathologic characteristics according to the education period and EL. The patients’ mean age decreased with increas-ing education period, and the proportion of patients with the following features was increased; age 50 years, tumor size 2 cm, negative lymph node, stage I, positive hormone recep-tor, negative HER2, low histologic grade. In addition, as the education period became longer, the proportion of patients who received lumpectomy, radiation therapy, and hormonal therapy increased. The same results were obtained from a comparison of the high and low EL groups, except for chemotherapy. The proportion of patients who received chemotherapy in the high and low EL groups was similar. Similar findings were observed in the subgroup aged 50 years and the subgroup aged > 50 years (S1 Table). In the sub-group aged 50 years, a higher proportion of patients in the low EL group received chemotherapy (p < 0.001), and in the subgroup aged > 50 years, there was no difference in the pro-portion of patients with respect to HER2 expression (p=0.218).
2. Survival analyses of all subjects
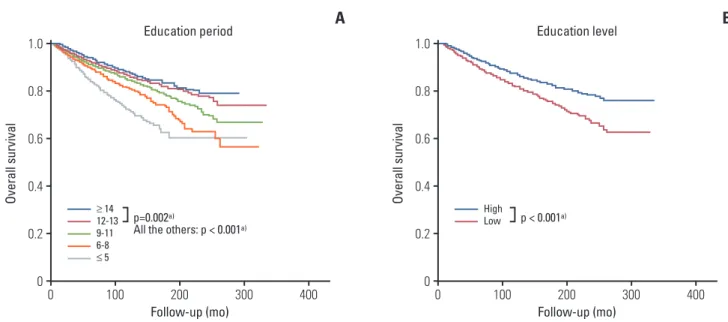
Survival analyses according to the education period revea-led significant differences among all five education period groups, and a longer education period conferred a better prog-nosis (log-rank test, all p < 0.05) (Fig. 1A). Survival analyses according to the EL showed that the high EL group had a bet-ter prognosis than the low EL group (log-rank test, p < 0.001) (Fig. 1B). Subgroup analyses with a forest plot revealed the
Ov er al l s ur vi va l 1.0 0 0.4 0.2 0.6 0.8 0 Follow-up (mo) Education period 100 200 300 400 p=0.002a)
All the others: p < 0.001a)
A
≥ 14 12-13 9-11 6-8 ≤ 5 Ov er al l s ur vi va l 1.0 0 0.4 0.2 0.6 0.8 0 Follow-up (mo) Education level 100 200 300 400 p < 0.001a)B
High LowFig. 1. Overall survival curves according to the education period (A) and education level (B) in all subjects. a)Statistical
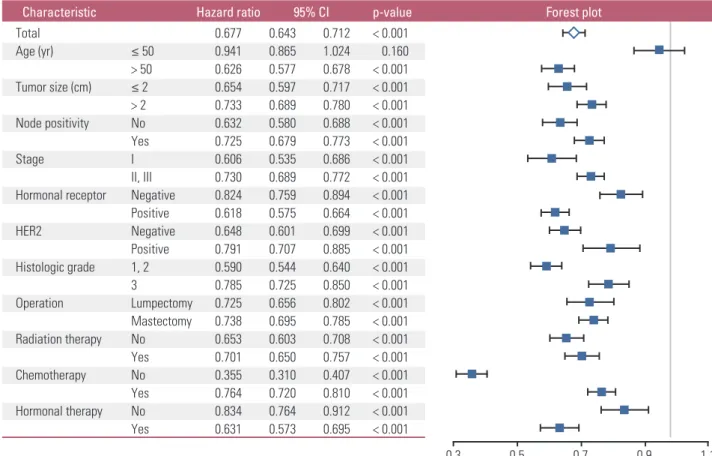
Total Age (yr) Tumor size (cm) Node positivity Stage Hormonal receptor HER2 Histologic grade Operation Radiation therapy Chemotherapy Hormonal therapy ≤ 50 > 50 ≤ 2 > 2 No Yes I II, III Negative Positive Negative Positive 1, 2 3 Lumpectomy Mastectomy No Yes No Yes No Yes 0.677 0.941 0.626 0.654 0.733 0.632 0.725 0.606 0.730 0.824 0.618 0.648 0.791 0.590 0.785 0.725 0.738 0.653 0.701 0.355 0.764 0.834 0.631
Characteristic Hazard ratio Forest plot
0.643 0.865 0.577 0.597 0.689 0.580 0.679 0.535 0.689 0.759 0.575 0.601 0.707 0.544 0.725 0.656 0.695 0.603 0.650 0.310 0.720 0.764 0.573 95% CI 0.712 1.024 0.678 0.717 0.780 0.688 0.773 0.686 0.772 0.894 0.664 0.699 0.885 0.640 0.850 0.802 0.785 0.708 0.757 0.407 0.810 0.912 0.695 < 0.001 0.160 < 0.001 < 0.001 < 0.001 < 0.001 < 0.001 < 0.001 < 0.001 < 0.001 < 0.001 < 0.001 < 0.001 < 0.001 < 0.001 < 0.001 < 0.001 < 0.001 < 0.001 < 0.001 < 0.001 < 0.001 < 0.001 p-value 0.3 0.5 0.7 0.9 1.1
Fig. 2. Subgroup analyses with a forest plot for the effects of the education level with respect to the overall survival according
to the clinicopathologic characteristics in all subjects. In the forest plot, a HR value less than 1 favors a high EL against low EL. CI, confidence interval; HER2, human epidermal growth factor receptor 2; EL, education level.
Ov er al l s ur vi va l 1.0 0 0.4 0.2 0.6 0.8 0 Follow-up (mo) Education period (age > 50 yr)
100 200 300 400
p=0.063a)
All the others: p < 0.001a)
A
≥ 14 12-13 9-11 6-8 ≤ 5 Ov er al l s ur vi va l 1.0 0 0.4 0.2 0.6 0.8 0 Follow-up (mo) Education level (age > 50 yr)100 200 300 400
p < 0.001a)
B
High Low
Fig. 3. Overall survival curves according to the education period (A) and education level (B) in the subgroup aged > 50
M u lt iv ar ia te a n al ys is C h ar ac te ri st ic ( ag e > 5 0 yr ) U n iv ar ia te a n al ys is B io lo gi ca l m od el a) T re at m en t m od el b ) C om b in ed m od el c) H az ar d 95 % C I p -v al u e H az ar d 95 % C I p -v al u e H az ar d 95 % C I p -v al u e H az ar d 95 % C I p -v al u e ra ti o ra ti o ra ti o ra ti o E d u ca ti on l ev el ( h ig h v s. l ow ) 0. 62 6 0. 57 7-0. 67 8 < 0 .0 01 0. 69 1 0. 61 5-0. 77 8 < 0 .0 01 0. 72 3 0. 64 9-0. 80 4 < 0 .0 01 0. 82 1 0. 71 0-0. 94 8 0. 00 7 T u m or s iz e (> 2 c m v s. 2 c m ) 2. 66 3 2. 45 8-2. 88 5 < 0 .0 01 2. 08 9 1. 75 8-2. 48 3 < 0 .0 01 -1. 66 7 1. 33 6-2. 08 0 < 0 .0 01 N od e p os it iv it y (y es v s. n o) 2. 84 1 2. 63 2-3. 06 7 < 0 .0 01 2. 27 5 1. 94 6-2. 65 8 < 0 .0 01 -2. 04 2 1. 64 7-2. 53 3 < 0 .0 01 S ta ge ( II , I II v s. I ) 3. 27 8 2. 97 6-3. 61 1 < 0 .0 01 0. 78 9 0. 61 8-1. 00 7 0. 05 7 -1. 02 6 0. 74 4-1. 41 5 0. 87 6 H or m on e re ce p to r 0. 71 9 0. 66 4-0. 77 9 < 0 .0 01 0. 73 8 0. 65 2-0. 83 6 < 0 .0 01 -0. 69 3 0. 54 3-0. 88 4 0. 00 3 (p os it iv e vs . n eg at iv e) H E R 2 (p os it iv e vs . n eg at iv e) 1. 13 9 1. 03 3-1. 25 6 0. 00 9 0. 88 0 0. 77 6-0. 99 7 0. 04 5 -0. 74 3 0. 63 5-0. 86 9 < 0 .0 01 H is to lo gi c gr ad e (3 v s. 1 , 2 ) 1. 71 9 1. 58 3-1. 86 6 < 0 .0 01 1. 46 2 1. 29 6-1. 65 0 < 0 .0 01 -1. 52 3 1. 30 4-1. 77 8 < 0 .0 01 L ym p h ov as cu la r in va si on 2. 27 7 2. 08 0-2. 49 3 < 0 .0 01 1. 46 4 1. 29 7-1. 65 2 < 0 .0 01 -1. 57 0 1. 34 2-1. 83 7 < 0 .0 01 (y es v s. n o) B od y m as s in d ex ( > 2 5 vs . 2 5) 1. 11 7 1. 03 6-1. 20 5 0. 00 4 0. 97 5 0. 87 2-1. 09 0 0. 65 3 -1. 05 3 0. 91 5-1. 21 2 0. 47 1 O p er at io n p er io d < 0 .0 01 0. 03 7 19 87 -2 00 5 R ef er en ce -R ef er en ce R ef er en ce 20 06 -2 01 0 0. 69 4 0. 63 7-0. 75 5 < 0 .0 01 -0. 83 1 0. 74 2-0. 93 1 0. 00 1 0. 93 7 0. 79 7-1. 10 1 0. 42 7 20 11 -2 01 4 0. 54 1 0. 46 3-0. 63 3 < 0 .0 01 -0. 63 9 0. 52 2-0. 78 2 < 0 .0 01 0. 71 5 0. 55 3-0. 92 6 0. 01 1 O p er at io n 2. 34 7 2. 15 3-2. 55 7 < 0 .0 01 -3. 71 6 3. 29 1-4. 19 6 < 0 .0 01 1. 87 6 1. 56 4-2. 24 9 < 0 .0 01 (m as te ct om y vs . l u m p ec to m y) R ad ia ti on t h er ap y (y es v s. n o) 0. 81 0 0. 74 7-0. 87 8 < 0 .0 01 -2. 30 4 1. 98 6-2. 67 4 < 0 .0 01 1. 49 5 1. 20 9-1. 84 9 < 0 .0 01 C h em ot h er ap y (y es v s. n o) 1. 19 3 1. 09 1-1. 30 3 < 0 .0 01 -1. 03 7 0. 90 4-1. 19 1 0. 60 3 0. 62 8 0. 50 4-0. 78 3 < 0 .0 01 H or m on al t h er ap y (y es v s. n o) 0. 65 7 0. 59 5-0. 72 6 < 0 .0 01 -0. 71 0 0. 62 8-0. 80 4 < 0 .0 01 0. 80 8 0. 62 8-1. 03 9 0. 09 6 T ab le 2 . U n iv ar ia te a n d m u lt iv ar ia te a n al ys es w it h r es p ec t t o th e ov er al l s u rv iv al in th e su bg ro u p a ge d > 5 0 ye ar s T hr ee m od el s in cl u d in g th e bi ol og ic al m od el , t re at m en t m od el , a nd c om bi ne d m od el w er e u se d f or m u lt iv ar ia te a na ly se s. C I, co nf id en ce i nt er va l; H E R 2, h u m an ep id er m al g ro w th fa ct or r ec ep to r 2. a)E d u ca ti on le ve l w as a d ju st ed w it h ei gh t f ac to rs in cl u d in g tu m or s iz e, n od e p os it iv it y, s ta ge , h or m on al r ec ep to r, H E R 2, h is to lo gi c gr ad e, l ym p h ov as cu la r in va si on , a n d b od y m as s in d ex , b)E d u ca ti on l ev el w as a d ju st ed w it h f iv e fa ct or s in cl u d in g op er at io n t im e, o p er at io n , r ad ia ti on t h er ap y, ch em ot he ra p y an d h or m on al th er ap y, c)E d u ca ti on le ve l w as a d ju st ed w it h al l t hi rt ee n fa ct or s d es cr ib ed a bo ve .
prognoses of the high EL group to be better than those of the low EL group in all subgroups, except for the age 50 years subgroup (Fig. 2). The lower HRs of the high EL group were more prominent in the subgroups with more favorable clini-copathologic features; tumor size 2 cm, negative lymph node, stage I, positive HR, negative HER2, and low histologic grade. With respect to the treatment modalities, a lower HR of the high EL group was most prominent in the subgroup without chemotherapy.
3. Survival analyses of the subgroup aged > 50 years and the subgroup aged 50 years
In the subgroup aged > 50 years, the high EL group showed superior survival than the low EL group both by the log-rank test (p < 0.001) (Fig. 3B) and by the Cox proportional hazards model (hazard ratio, 0.626; 95% CI, 0.577 to 0.678; p < 0.001) (Table 2, Fig. 2). A longer education period conferred a better prognosis than a shorter education period, except between the high school group and college group (all p < 0.001, except for p=0.063 between the high school group and the college group) (Fig. 3A). In the subgroup aged 50 years, no significant sur-vival difference was observed between the high and low EL groups according to both the log-rank test (p=0.160; data not shown) and the Cox proportional hazards model (hazard ratio, 0.941; 95% CI, 0.865 to 1.024; p=0.160) (Fig. 2). In addi-tion, there was no survival difference between each education period, except for between the elementary school group and college group (p=0.024, data not shown) and between the high school group and college group (p=0.020, data not shown). In the subgroup aged > 50 years, subgroup analyses showed that the high EL group had superior prognoses to the low EL group in all subgroups (S2 Fig.).
4. Univariate and multivariate analyses
For all subjects, univariate analyses showed that all of the following 15 factors were statistically significant: the EL (haz-ard ratio, 0.677; 95% CI, 0.643 to 0.712; p < 0.001), age, tumor size, node positivity, stage, HR, HER2, histologic grade, lym-phovascular invasion, BMI, operation period, operation, radia-tion therapy, chemotherapy, and hormonal therapy (S3 Table). Multivariate analyses showed that the EL was a statistically significant independent factor in the biological model (hazard ratio, 0.869; 95% CI, 0.798 to 0.945; p < 0.001) and the treatment model (hazard ratio, 0.794; 95% CI, 0.743 to 0.849; p < 0.001), but not in the combined model (hazard ratio, 0.974; 95% CI, 0.878 to 1.082; p=0.625). Although HER2 lost its significance only in the biological model, the stage and BMI lost their sig-nificance in both the biological model and combined model.
In the subgroup aged > 50 years, the 14 factors mentioned above, except for age, were statistically significant in
univari-ate analyses, and the EL was a significant independent prog-nosticator in all three models in multivariate analyses (Table 2): biological model (hazard ratio, 0.691; 95% CI, 0.615 to 0.778; p < 0.001), treatment model (hazard ratio, 0.723; 95% CI, 0.649 to 0.804; p < 0.001), combined model (hazard ratio, 0.821; 95% CI, 0.71 to 0.948; p=0.007).
5. Analysis of treatment modalities
For all subjects, a higher proportion of patients received lumpectomy, radiation therapy, and endocrine therapy in the high EL group compared to the low EL group (S4 Table). In subgroup analyses, these findings were consistent regardless of age, tumor size, node positivity, and HR. With respect to chemotherapy, although there was no significant differences between the high and low EL groups in all patient groups, a higher proportion of patients in the high EL group received chemotherapy in the pathologically unfavorable subgroups with a tumor size > 2 cm, positive node, and negative HR, in subgroup analyses. In the high EL group, a higher proportion of patients received lumpectomy in the subgroups with both a tumor size 2 cm and a tumor size > 2 cm. In the subgroup of lumpectomy, a higher proportion of patients received radi-ation therapy in the high EL group. In the subgroup with a positive hormone receptor, a higher proportion of patients received endocrine therapy in the high EL group. In the sub-group aged 50 years, a much higher proportion of patients received chemotherapy in the lower EL group compared to the subgroup aged > 50 years.
In the subgroup aged > 50 years, a higher proportion of patients in the high EL group received chemotherapy in the cases with unfavorable clinicopathologic features, such as tumor size > 2 cm and positive nodal metastasis compared to the low EL group (Table 3). The proportion of patients who received chemotherapy in the subgroup with a negative HR (p=0.084) and those who received radiation therapy in the sub-group with lumpectomy (p=0.164) was similar.
6. EL and the molecular subtypes of breast cancer
For all subjects, a high EL conferred better prognoses than a low EL in all molecular subtypes of breast cancer, including HR(+)/HER2(–) (p < 0.001), HR(+)/HER2(+) (p=0.003), HR(–) /HER2(+) (p=0.013), and HR(–)/HER2(–) (p=0.004) subtypes (S5 Fig.). The prognostic influence of EL was most significant in the HR(+)/HER2(–) subtype and least significant in the HR(–)/HER2(+) subtype. In the subgroup aged > 50 years, a high EL conferred a superior prognosis than a low EL across all molecular subtypes with the highest and lowest signifi-cance in the HR(+)/HER2(–) subtype (p < 0.001) and HR(+)/ HER2(+) subtype (p=0.014), respectively (S6 Fig.).
O p er at io n R ad ia ti on t h er ap y C h em ot h er ap y E n d oc ri n e th er ap y C h ar ac te ri st ic Lu m pe ct om y m as te ct om y C h i-sq u ar e N o Y es C h i-sq u ar e N o Y es C h i-sq u ar e N o Y es C h i-sq u ar e (a ge > 5 0 yr ) p -v al u e p -v al u e p -v al u e p -v al u e A ll Low e d u ca ti on le ve l 6, 81 4 (4 7. 8) 7, 43 7 (5 2. 2) < 0 .0 01 5, 31 7 (4 3. 5) 6, 91 5 (5 6. 5) < 0 .0 01 4, 01 8 (3 1. 7) 8, 66 1 (6 8. 3) 0. 02 9 3, 95 5 (4 4. 9) 4, 85 9 (5 5. 1) < 0 .0 01 H ig h e d u ca ti on le ve l 7, 05 5 (5 9. 2) 4, 86 3 (4 0. 8) 3, 57 1 (3 3. 8) 6, 99 4 (6 6. 2) 3, 61 0 (3 3. 0) 7, 32 1 (6 7. 0) 3, 35 4 (4 0. 1) 5, 01 7 (5 9. 9) T u m or s iz e 2 cm L ow e d u ca ti on le ve l 4, 65 9 (6 1. 2) 2, 95 7 (3 8. 8) < 0 .0 01 2, 50 3 (3 8. 2) 4, 05 0 (6 1. 8) < 0 .0 01 2, 86 7 (4 2. 9) 3, 81 1 (5 7. 1) 0. 08 3 1, 88 7 (3 8. 5) 3, 01 4 (6 1. 5) < 0 .0 01 H ig h e d u ca ti on le ve l 5, 07 7 (6 9. 5) 2, 23 0 (3 0. 5) 1, 93 2 (2 9. 7) 4, 57 4 (7 0. 3) 2, 95 4 (4 4. 4) 3, 69 6 (5 5. 6) 1, 83 3 (3 4. 7) 3, 44 8 (6 5. 3) T u m or s iz e > 2 c m L ow e d u ca ti on le ve l 2, 02 7 (3 1. 7) 4, 37 6 (6 8. 3) < 0 .0 01 2, 74 1 (5 0. 0) 2, 74 2 (5 0. 0) < 0 .0 01 1, 07 5 (1 8. 6) 4, 71 9 (8 1. 4) < 0 .0 01 1, 94 3 (5 2. 0) 1, 79 1 (4 8. 0) < 0 .0 01 H ig h e d u ca ti on le ve l 1, 80 4 (4 1. 6) 2, 53 2 (5 8. 4) 1, 54 5 (4 0. 5) 2, 27 4 (5 9. 5) 52 3 (1 3. 0) 3, 50 9 (8 7. 0) 1, 37 1 (4 7. 6) 1, 51 0 (5 2. 4) N od e n eg at iv e L ow e d u ca ti on le ve l 4, 88 1 (5 5. 1) 3, 97 1 (4 4. 9) < 0 .0 01 3, 46 7 (4 5. 6) 4, 12 9 (5 4. 4) < 0 .0 01 3, 33 9 (4 3. 0) 4, 42 6 (5 7. 0) 0. 04 2 2, 48 5 (4 5. 8) 2, 94 5 (5 4. 2) < 0 .0 01 H ig h e d u ca ti on le ve l 5, 26 7 (6 6. 1) 2, 69 8 (3 3. 9) 2, 44 5 (3 4. 5) 4, 64 9 (6 5. 5) 3, 23 5 (4 4. 6) 4, 01 1 (5 5. 4) 2, 28 2 (4 0. 6) 3, 33 4 (5 9. 4) N od e p os it iv e L ow e d u ca ti on le ve l 1, 85 7 (3 5. 3) 3, 40 3 (6 4. 7) < 0 .0 01 1, 79 2 (3 9. 5) 2, 74 6 (6 0. 5) < 0 .0 01 61 4 (1 2. 8) 4, 19 7 (8 7. 2) < 0 .0 01 1, 43 5 (4 3. 2) 1, 88 5 (5 6. 8) < 0 .0 01 H ig h e d u ca ti on le ve l 1, 71 4 (4 4. 8) 2, 11 4 (5 5. 2) 1, 08 9 (3 2. 1) 2, 30 1 (6 7. 9) 32 3 (9 .0 ) 3, 27 5 (9 1. 0) 1, 03 8 (3 8. 6) 1, 64 9 (6 1. 4) S ta ge I L ow e d u ca ti on le ve l 3, 68 3 (6 3. 7) 2, 10 3 (3 6. 3) < 0 .0 01 1, 94 6 (3 9. 0) 3, 04 1 (6 1. 0) < 0 .0 01 2, 63 0 (5 2. 2) 2, 40 6 (4 7. 8) 0. 06 6 1, 46 6 (3 9. 3) 2, 26 2 (6 0. 7) < 0 .0 01 H ig h e d u ca ti on le ve l 4, 15 3 (7 2. 0) 1, 61 3 (2 8. 0) 1, 51 8 (2 9. 4) 3, 63 7 (7 0. 6) 2, 81 8 (5 4. 0) 2, 39 7 (4 6. 0) 1, 45 0 (3 4. 5) 2, 75 4 (6 5. 5) S ta ge I I, I II L ow e d u ca ti on le ve l 2, 94 0 (3 6. 2) 5, 17 2 (6 3. 8) < 0 .0 01 3, 26 7 (4 6. 8) 3, 71 1 (5 3. 2) < 0 .0 01 1, 27 3 (1 7. 3) 6, 08 7 (8 2. 7) < 0 .0 01 2, 36 8 (4 8. 7) 2, 49 0 (5 1. 3) < 0 .0 01 H ig h e d u ca ti on le ve l 2, 68 5 (4 6. 3) 3, 11 6 (5 3. 7) 1, 94 4 (3 7. 8) 3, 19 6 (6 2. 2) 64 4 (1 1. 9) 4, 77 0 (8 8. 1) 1, 75 3 (4 4. 5) 2, 18 3 (5 5. 5) H or m on al r ec ep to r n eg at iv e L ow e d u ca ti on le ve l 1, 81 7 (4 1. 1) 2, 60 7 (5 8. 9) < 0 .0 01 1, 83 2 (4 5. 9) 2, 16 1 (5 4. 1) < 0 .0 01 66 0 (1 5. 8) 3, 52 6 (8 4. 2) 0. 82 8 N A N A H ig h e d u ca ti on le ve l 1, 78 7 (5 2. 1) 1, 64 4 (4 7. 9) 1, 17 2 (3 7. 3) 1, 97 3 (6 2. 7) 51 0 (1 5. 6) 2, 76 3 (8 4. 4) N A N A H or m on al r ec ep to r p os it iv e L ow e d u ca ti on le ve l 4, 41 3 (5 1. 7) 4, 11 9 (4 8. 3) < 0 .0 01 3, 17 2 (4 1. 2) 4, 52 0 (5 8. 8) < 0 .0 01 3, 13 9 (3 9. 7) 4, 76 0 (6 0. 3) 0. 20 8 49 3 (1 0. 2) 4, 33 4 (8 9. 8) 0. 01 5 H ig h e d u ca ti on le ve l 4, 77 3 (6 2. 5) 2, 86 4 (3 7. 5) 2, 20 7 (3 1. 5) 4, 80 1 (6 8. 5) 2, 94 3 (4 0. 7) 4, 28 0 (5 9. 3) 44 5 (8 .8 ) 4, 62 0 (9 1. 2) L u m p ec to m y L ow e d u ca ti on le ve l N A N A 52 9 (9 .0 ) 5, 35 3 (9 1. 0) < 0 .0 01 2, 11 7 (3 5. 7) 3, 81 5 (6 4. 3) 0. 00 7 1, 68 0 (3 0. 2) 3, 87 9 (6 9. 8) 0. 41 8 H ig h e d u ca ti on le ve l N A N A 43 3 (6 .9 ) 5, 80 3 (9 3. 1) 2, 41 5 (3 8. 0) 3, 93 7 (6 2. 0) 1, 77 6 (2 9. 5) 4, 23 8 (7 0. 5) M as te ct om y L ow e d u ca ti on le ve l N A N A 4, 73 7 (7 6. 4) 1, 46 2 (2 3. 6) 0. 00 1 1, 82 9 (2 7. 8) 4, 75 6 (7 2. 2) 0. 02 5 2, 22 0 (7 0. 8) 91 4 (2 9. 2) 0. 03 2 H ig h e d u ca ti on le ve l N A N A 3, 09 2 (7 3. 6) 1, 10 9 (2 6. 4) 1, 14 7 (2 5. 8) 3, 29 1 (7 4. 2) 1, 53 2 (6 8. 1) 71 7 (3 1. 9) T ab le 3 . A n al ys es o f th e tr ea tm en t m od al it ie s ac co rd in g to th e ed u ca ti on le ve l a n d c li n ic op at h ol og ic c h ar ac te ri st ic s in th e su bg ro u p a ge d > 5 0 ye ar s N A , n ot a p p lic ab le .
Discussion
Although several papers have reported the prognostic role of EL in breast cancer, the results were not consistent and they are still controversial [1-11,13-17]. These inconsistent results regarding the prognostic role of the EL in breast can-cer prompted this study, which found that the EL is a strong favorable prognostic factor for breast cancer; the high EL group showed a better prognosis than the low EL group (hazard ratio, 0.677; 95% CI, 0.643 to 0.712; p < 0.001) (S3 Table). Log-rank tests also showed that the high EL group had a superior prognosis than the low EL group (p < 0.001) (Fig. 1B) and that there were significant differences among all five education period groups and a longer education period conferred a better prognosis (all p < 0.05) (Fig. 1A). Multivariate analyses showed that the EL was an independ-ent significant prognostic factor in the biological model (haz-ard ratio, 0.869; 95% CI, 0.798 to 0.945; p < 0.001) and the treatment model (hazard ratio, 0.794; 95% CI, 0.743 to 0.849; p < 0.001), but not in the combined model (hazard ratio, 0.974; 95% CI, 0.878 to 1.082; p=0.625) (S3 Table).
After confirming the prognostic role of the EL in unse-lected breast cancer patients, the prognostic influence of the EL was investigated further in each subgroup of breast can-cer patients. Thus far, only a few papers have reported sub-group analyses of the EL in breast cancer. Albano et al. [3] reported that the breast cancer mortality rates were higher among women with less education than in those with more education (37.0 and 31.1 per 100,000, respectively, for black women, and 25.2 and 18.6 per 100,000, respectively, for white women). Kim et al. [10] reported that less than a high school education was associated with lower breast cancer mortality among white women (odds ratio [OR], 0.73; 95% CI, 0.6 to 0.9) but not among black women (OR, 1.1; 95% CI, 0.5 to 2.3). In this study, the EL was a strong independent favorable prognostic factor only in the subgroup aged > 50 years (log-rank test, p < 0.001) (Cox-proportional hazards model; haz-ard ratio, 0.626; 95% CI, 0.577 to 0.678) (Table 2, Figs. 2 and 3B), but not in the subgroup aged 50 years (Cox propor-tional hazards model, hazard ratio, 0.941; 95% CI, 0.865 to 1.024; Fig. 2) according to subgroup analysis. The prognoses of the high EL group were superior to those of the low EL group in all subgroups except for the subgroup aged 50 years, regardless of the following factors: tumor size, nodal positivity, stage, HR, HER2, histologic grade, operation, radiation therapy, chemotherapy, and hormonal therapy (Fig. 2). In the subgroup aged > 50 years, subgroup analysis showed that the high EL group had superior prognoses to the low EL group in all subgroups (S2 Fig.), and multivariate analysis showed that the EL was a significant independent prognosticator in all three models (Table 2): biological model
(hazard ratio, 0.691; 95% CI, 0.615 to 0.778; p < 0.001), treat-ment model (hazard ratio, 0.723; 95% CI, 0.649 to 0.804; p < 0.001), combined model (hazard ratio, 0.821; 95% CI, 0.710 to 0.948; p=0.007). Dalton et al. [18] reported that women with higher education showed a reduced OR compared to women with a basic/high school education (OR, 0.83; 95% CI, 0.73 to 0.94) for high-risk breast cancer only in postmenopausal women, but they did not carry out survival analyses.
Although several papers have stated that the EL is a sig-nificant prognostic factor in breast cancer, the mechanisms through which EL plays the role of a prognostic factor are largely unknown. From the results of this study, an attempt was made to suggest several plausible explanations for these mechanisms in the following three aspects: biological aspect, treatment aspect, and aspects other than biological and treat-ment aspects.
First, in biological aspects, the high EL group showed more favorable biological features than the low EL group, which could partially explain the superior survival in the high EL group. As shown in Table 1, the mean age of the high EL group was lower and the proportion of patients aged 50 years was larger in the high EL group than in the low EL group. The proportion of patients with the following features was higher in the high EL group: age 50 years, tumor size 2 cm, negative lymph node, stage I, positive hormone receptor, negative HER2, and low histologic grade. In the subgroup aged > 50 years, similar findings to that mentioned above were obtained (S1 Table). These findings strongly sug-gest that a high EL is closely associated with favorable bio-logical features leading to a superior prognosis. Several studies reported similar findings to the present results [13,18,19]. Rutqvist et al. [13] reported that the breast cancer stage was significantly higher among patients with a low level of education. Dalton et al. [18] reported that women with a higher education showed a reduced OR compared to women with basic/high school education only (OR, 0.88; 95% CI, 0.80 to 0.96) for high-risk breast cancer with size > 20 mm, lymph-node positive, high histologic grade, and hor-mone receptor negative. The diagnostic timing of primary breast cancer could play a key role in explaining the differ-ences in the biological features according to the EL. In the high EL group, the early diagnosis of breast cancer could be the reason for the lower mean age at the first diagnosis and more favorable biological features, which might have resulted in better survival rates in the high EL group than the low EL group.
Second, in the treatment aspect, the patients in the high EL group were presumed to receive treatments more actively, which might have resulted in better survival rates. The pro-portion of patients who received lumpectomy, radiation therapy, and endocrine therapy was higher in the high EL group because the clinicopathologic features were more
favorable in that group (Table 1), regardless of the tumor size, nodal positivity, stage, and HR status (S4 Table). Despite the favorable clinicopathologic features, the propor-tion of patients who received chemotherapy in the high EL group was not lower than that in the low EL group. In the subgroup aged > 50 years, the proportion of patients who received radiation therapy in the subgroup with a lumpec-tomy and who received endocrine therapy in the subgroup with a positive HR was higher in the high EL group. In addition, a higher proportion of patients in the high EL group received chemotherapy in the subgroups with more unfavorable clinicopathologic features, such as a larger tumor size, positive lymph node, and advanced stage (Table 3). These findings strongly suggest that an active attitude towards treatments in the high EL group could have con-tributed to the superior prognosis to that in the low EL group. Griggs et al. [20] reported that an EL less than high school was significantly associated with reduced doses of adjuvant chemotherapy (OR, 3.07; 95% CI, 1.57 to 5.99). Bouchardy et al. reported that patients form a low social class underwent breast-conserving surgery, hormonal therapy, and chemotherapy less frequently, particularly in the case of axillary lymph node involvement [21].
Third, there could be factors other than biological or treat-ment factors that are related to the effects of the EL on the survival rates of breast cancer patients. In the subgroup aged > 50 years, multivariate analyses showed that the EL was a significant independent factor in all three models (Table 2). In particular, in the combined model, the EL was still a sig-nificant factor after adjusting for biological and treatment fac-tors. These findings suggest that there could be factors other than the biological or treatment factors that could have con-tributed to the superior survival in the high EL group. A range of factors were presumed to be included in this cate-gory: adherence to breast cancer screening [22], socioeco-nomic status [21,23-25], exercise [26], diet [26], smoking [27-29], etc.
Although this study showed that the EL was a strong prog-nostic factor in unselected breast cancer patients and in the subgroup aged > 50 years, the EL was not a prognosticator in the subgroup aged 50 years. Most importantly, as the low EL patients in the subgroup aged 50 years received adjuvant therapy more actively than those in the subgroup aged > 50 years, the survival difference could be reduced in the subgroup aged 50 years. Although the proportions of low EL patients who received chemotherapy and hormonal therapy in the subgroup aged > 50 years were 68.3% and 55.1%, respectively, those in the subgroup aged 50 years were 83.2% and 59.4%, respectively. Second, the prognostic effect of the EL could be weakened in the subgroup aged 50 years because the majority of the subjects in the sub-group aged 50 years were high EL patients, with the
pre-sumption that the EL is a strong prognostic factor in breast cancer. The proportion of high EL in the subgroup aged > 50 years and the subgroup aged 50 years was 27.7% and 72.3%, respectively. Third, as the overall survival rate was higher in the subgroup aged 50 years than in the subgroup aged > 50 years, the impact of the EL could be less prominent in the subgroup aged 50 years.
The influence of the EL on the molecular subtypes of breast cancer remains unknown, and no previous results on this issue could be found. This study examined the prognostic role of the EL in the molecular subtypes after classifying all breast cancers into four categories: HR(+)/HER2(–), HR(+)/ HER2(+), HR(–)/HER2(+), and HR(–)/HER2(–) subtypes. In this study, the EL was a significant prognostic factor across all molecular subtypes of breast cancer, including the HR(+)/ HER2(–), HR(+)/HER2(+), HR(–)/HER2(+), and HR(–)/ HER2(–) subtypes for both the all subjects group and the sub-group aged > 50 years (log-rank tests, all p < 0.05) (S5 and S6 Figs.). The significance was highest in the HR(+)/ HER2(–) subtype.
In this study, a large number of subjects (n=64,129) were analyzed using the nationwide breast cancer registry data-base from the Korean Breast Cancer Society. Although such a large number of subjects could provide considerable statis-tical power and reduce various biases, even in subgroup analyses, the present study had several limitations. The data were incomplete, particularly the data on adjuvant treatment modalities. The missing data rates were as follows: 1.8% for surgery, 13.1% for radiation therapy, 9.9% for chemotherapy, 33.2% for endocrine therapy. The impact of anti-HER2 ther-apy could not be analyzed due to insufficient data. Although an attempt was made to adjust for as many confounding fac-tors as possible, most of the other confounding facfac-tors, such as socioeconomic status, smoking, drinking, exercise, etc., could not be analyzed due to insufficient data.
In conclusion, the EL is a strong independent favorable prognostic factor in breast cancer only in the subjects aged > 50 years, but not in the subjects aged 50 years. Favorable clinicopathologic features and active treatment could explain most of this observation. The EL was a significant prognostic factor in breast cancer regardless of the molecular subtype. The early detection of cancer and the receipt of appropriate treatments without omission are important for improving the overall survival for breast cancer patients aged more than 50 years with a low EL. Overall, the EL is one of the most important prognostic factors that should be considered care-fully in a clinical setting.
Electronic Supplementary Material
Supplementary materials are available at Cancer Research and Treatment website (http://www.e-crt.org).
Conflicts of Interest
Conflict of interest relevant to this article was not reported.
Acknowledgments
This article was supported by the Korean Breast Cancer Society (WA35-20160706-01).
*Korean Breast Cancer Society
Sei Hyun Ahn1, Dong-Young Noh2, Seok Jin Nam3, Sung Yong Kim3, Eun Sook Lee4, Byeong-Woo Park5, Woo Chul Noh6, Jung Han Yoon7, Soo Jung Lee8, Eun Kyu Lee9, Joon Jeong10, Sehwan Han11, Ho Yong Park12, Nam-Sun Paik13, Young Tae Bae14, Hyouk Jin Lee15, Heung kyu Park16, Seung Sang Ko17, Byung Joo Song18, Young Jin Suh19, Sung Hoo Jung20, Se Heon Cho21, Sei Joong Kim22, Se Jeong Oh23, Byung Kyun Ko24, Ku Sang Kim25, Chanheun Park26, Jong-Min Baek27, Ki-Tae Hwang28, Il-Sung Chang29, Jeoung Won Bae30, Jeong-Soo Kim31, Sun Hee Kang32, Geumhee Gwak33, Jee Hyun Lee34, Tae Hyun Kim35, Myungchul Chang36, Jung Sun Lee37, Jeong-Yoon Song38, Hai Lin Park39, Sun Young Min40, Jung-Hyun Yang41, Sung Hwan Park42, Woo-Chan Park43, Lee Su Kim44, Dong Won Ryu45,
Kweon Cheon Kim46, Min Sung Chung47, Hee Boong Park48, Cheol
Wan Lim49, Un Jong Choi50, Beom Seok Kwak51, Young Sam Park52, Hyuk Jai Shin53, Young Jin Choi54, Doyil Kim55, Airi Han56, Jong Hyun Koh57, Sangyong Choi58, Daesung Yoon59, Soo Youn Choi60, Shin Hee Chul61, Jae Il Kim62, Jae Hyuck Choi63, Jin Woo Ryu64, Chang Dae Ko65, Il Kyun Lee66, Dong Seok Lee67, Seunghye Choi68, Youn Ki Min69, Young San Jeon70, Eun-Hwa Park71
1Asan Medical Center, 2Seoul National University Hospital,
3Soonchunhyang University Cheonan Hospital, 4National Cancer
Center, 5Yonsei University Severance Hospital, 6Korea Cancer Cen-ter Hospital, 7Chonnam National University Hwasun Hospital,
8Yeungnam University Medical Center, 9Seoul National University
Bundang Hospital, 10Yonsei University Gangnam Severance
Hospi-tal, 11Ajou University School of Medicine, 12Kyungpook National
University Medical Center, 13Ewha Womans University Mokdong
Hospital, 14Pusan National University Hospital, 15Saegyaero Hospi-tal, 16Gachon University Gil Hospital, 17Cheil General Hospital and Women’s Healthcare Center, Dankook University College of Medi-cine, 18Seoul St. Mary’s Hospital, The Catholic University of Korea, 19St. Vincent’s Hospital, The Catholic University of Korea, 20 Chon-buk National University Hospital, 21Dong-A University Medical Center, 22Inha University Hospital, 23Incheon St. Mary’s Hospital, The Catholic University of Korea, 24Ulsan University Hospital,
25Ulsan City Hospital, 26Kangbuk Samsung Hospital, Sungkyunkwan
University School of Medicine, 27Bucheon St. Mary’s Hospital, The
Catholic University of Korea, 28SMG-SNU Boramae Medical Center,
29Chungnam National University Hospital, 30Korea University
Anam Hospital, 31Uijeongbu St. Mary’s Hospital, The Catholic
Uni-versity of Korea, 32Keimyung University Dongsan Medical Center,
33Inje University Sanggye Paik Hospital, 34Soonchunhyang Univer-sity Hospital, 35Inje University Busan Paik Hospital, 36Dankook Uni-versity Hospital, 37Inje University Haeundae Paik Hospital, 38Kyung
Hee University Hospital at Gangdong, 39CHA Gangnam Medical
Center, CHA University, 40Kyung Hee University Medical Center,
41Konkuk University Medical Center, 42Daegu Catholic University
Medical Center, 43Yeouido St. Mary’s Hospital, The Catholic
Uni-versity of Korea, 44Hallym University Sacred Heart Hospital, 45Kosin
University Gospel Hospital, 46Chosun University Hospital,
47Hanyang University Seoul Hospital, 48Park Hee Boong Surgical
Clinic, 49Soonchunhyang University Bucheon Hospital, 50Wonkwang University Hospital, 51Dongguk University Ilsan Hospital, 52
Presby-terian Medical Center, 53Myongji Hospital, 54Chungbuk National
University Hospital, 55MizMedi Hospital, 56Wonju Severance Chris-tian Hospital, Yonsei University College of Medicine, 57Cheongju St.
Mary’s Hospital, 58Gwangmyung Sung Ae Hospital, 59Konyang
Uni-versity Hospital, 60Hallym University Kangdong Sacred Heart
Hos-pital, 61Chung-Ang University Hospital, 62Inje University Ilsan Paik Hospital, 63Jeju National University Hospital, 64Chungmu Genral Hospital, 65Dr. Ko’s Breast Clinic, 66International St. Mary’s Hospital,
Catholic Kwandong University College of Medicine, 67Bun Hong
Hospital, 68St. Paul's Hospital, The Catholic University of Korea, 69Cheju Halla General Hospital, 70Goo Hospital, 71Gangneung Asan Hospital, University of Ulsan College of Medicine
1. Hussain SK, Lenner P, Sundquist J, Hemminki K. Influence of education level on cancer survival in Sweden. Ann Oncol. 2008;19:156-62.
2. Hussain SK, Altieri A, Sundquist J, Hemminki K. Influence of education level on breast cancer risk and survival in Sweden between 1990 and 2004. Int J Cancer. 2008;122:165-9.
3. Albano JD, Ward E, Jemal A, Anderson R, Cokkinides VE, Murray T, et al. Cancer mortality in the United States by edu-cation level and race. J Natl Cancer Inst. 2007;99:1384-94. 4. Gajalakshmi CK, Shanta V, Swaminathan R,
Sankaranara-yanan R, Black RJ. A population-based survival study on
female breast cancer in Madras, India. Br J Cancer. 1997;75: 771-5.
5. Lund E, Jacobsen BK. Education and breast cancer mortality: experience from a large Norwegian cohort study. Cancer Causes Control. 1991;2:235-8.
6. Nishi N, Sugiyama H, Hsu WL, Soda M, Kasagi F, Mabuchi K, et al. Differences in mortality and incidence for major sites of cancer by education level in a Japanese population. Ann Epidemiol. 2008;18:584-91.
7. Robsahm TE, Tretli S. Weak associations between sociodemo-graphic factors and breast cancer: possible effects of early
detection. Eur J Cancer Prev. 2005;14:7-12.
8. Heck KE, Wagener DK, Schatzkin A, Devesa SS, Breen N. Socioeconomic status and breast cancer mortality, 1989 through 1993: an analysis of education data from death certifi-cates. Am J Public Health. 1997;87:1218-22.
9. Steenland K, Henley J, Thun M. All-cause and cause-specific death rates by educational status for two million people in two American Cancer Society cohorts, 1959-1996. Am J Epidemiol. 2002;156:11-21.
10. Kim C, Eby E, Piette JD. Is education associated with mortality for breast cancer and cardiovascular disease among black and white women? Gend Med. 2005;2:13-8.
11. Dano H, Hansen KD, Jensen P, Petersen JH, Jacobsen R, Ewertz M, et al. Fertility pattern does not explain social gra-dient in breast cancer in denmark. Int J Cancer. 2004;111: 451-6.
12. Min SY, Kim Z, Hur MH, Yoon CS, Park EH, Jung KW, et al. The basic facts of Korean breast cancer in 2013: results of a nationwide survey and breast cancer registry database. J Breast Cancer. 2016;19:1-7.
13. Rutqvist LE, Bern A; Stockholm Breast Cancer Study Group. Socioeconomic gradients in clinical stage at presentation and survival among breast cancer patients in the Stockholm area 1977-1997. Int J Cancer. 2006;119:1433-9.
14. Cella DF, Orav EJ, Kornblith AB, Holland JC, Silberfarb PM, Lee KW, et al. Socioeconomic status and cancer survival. J Clin Oncol. 1991;9:1500-9.
15. Herndon JE 2nd, Kornblith AB, Holland JC, Paskett ED. Effect of socioeconomic status as measured by education level on survival in breast cancer clinical trials. Psychooncology. 2013;22:315-23.
16. Mackenbach JP, Kunst AE, Groenhof F, Borgan JK, Costa G, Faggiano F, et al. Socioeconomic inequalities in mortality among women and among men: an international study. Am J Public Health. 1999;89:1800-6.
17. Faggiano F, Lemma P, Costa G, Gnavi R, Pagnanelli F. Cancer mortality by educational level in Italy. Cancer Causes Control. 1995;6:311-20.
18. Dalton SO, During M, Ross L, Carlsen K, Mortensen PB, Lynch J, et al. The relation between socioeconomic and demographic factors and tumour stage in women diagnosed with breast cancer in Denmark, 1983-1999. Br J Cancer. 2006;95:653-9.
19. Gordon NH. Association of education and income with estro-gen receptor status in primary breast cancer. Am J Epidemiol. 1995;142:796-803.
20. Griggs JJ, Culakova E, Sorbero ME, van Ryn M, Poniewierski MS, Wolff DA, et al. Effect of patient socioeconomic status and body mass index on the quality of breast cancer adjuvant chemotherapy. J Clin Oncol. 2007;25:277-84.
21. Bouchardy C, Verkooijen HM, Fioretta G. Social class is an important and independent prognostic factor of breast cancer mortality. Int J Cancer. 2006;119:1145-51.
22. Damiani G, Basso D, Acampora A, Bianchi CB, Silvestrini G, Frisicale EM, et al. The impact of level of education on adher-ence to breast and cervical cancer screening: Evidadher-ence from a systematic review and meta-analysis. Prev Med. 2015;81: 281-9.
23. Yu XQ. Socioeconomic disparities in breast cancer survival: relation to stage at diagnosis, treatment and race. BMC Cancer. 2009;9:364.
24. Louwman WJ, van de Poll-Franse LV, Fracheboud J, Roukema JA, Coebergh JW. Impact of a programme of mass mammog-raphy screening for breast cancer on socio-economic variation in survival: a population-based study. Breast Cancer Res Treat. 2007;105:369-75.
25. Baquet CR, Commiskey P. Socioeconomic factors and breast carcinoma in multicultural women. Cancer. 2000;88:1256-64. 26. Patterson RE, Cadmus LA, Emond JA, Pierce JP. Physical
activity, diet, adiposity and female breast cancer prognosis: a review of the epidemiologic literature. Maturitas. 2010;66: 5-15.
27. Hellmann SS, Thygesen LC, Tolstrup JS, Gronbaek M. Modi-fiable risk factors and survival in women diagnosed with pri-mary breast cancer: results from a prospective cohort study. Eur J Cancer Prev. 2010;19:366-73.
28. Reynolds P, Goldberg D, Hurley S, Nelson DO, Largent J, Henderson KD, et al. Passive smoking and risk of breast can-cer in the California teachers study. Cancan-cer Epidemiol Bio-markers Prev. 2009;18:3389-98.
29. McDonald PA, Williams R, Dawkins F, Adams-Campbell LL. Breast cancer survival in African American women: is alcohol consumption a prognostic indicator? Cancer Causes Control. 2002;13:543-9.