Local Zooming Analysis of LNGC CCS under Sloshing Impact Loading
LNG선 단열시스템의 슬로싱 충격하중에서의 국부확대해석
Lee, Sang-Gab*∙Hong Anh**∙Cho, Heon-Il**∙Kim, Jin-Kyung***∙Ahn, Ji-Woong*** 이 상 갑*∙Hong Anh**∙조 헌 일**∙김 진 경***∙안 지 웅***
1)
Abstract
As the cargo tank size and configuration of Liquefied Natural Gas carriers(LNGC) grows in response to the global increase in demands for LNG and the necessities of its economical transportation, impact loading from sloshing may become one of the most important factors in the structural safety of LNG Cargo Containment Systems(CCS). The objective of this study is to demonstrate the procedure of the structural safety assessment of MARK III membrane type CCS under sloshing impact loading using local zooming analysis technique of LS-DYNA code.
keywords : Structural Safety Assessment, Cargo Containment System(CCS), sloshing impact loading, local zooming analysis, LS-DYNA code, Fluid-Structure Interaction(FSI) analysis
1. Introduction
As the cargo tank size and configuration of Liquefied Natural Gas carriers(LNGC) and LNG Floating Production Storage Offloading(LNG-FPSO) vessels grows in response to the global increase in demands for LNG and the necessities of its economical transportation, sloshing impact loadings may become one of the most important factors in the structural safety of LNG Cargo Containment Systems(CCS). The most important structural safety criterion for membrane-type LNGC and LNG-FPSO is likely to be the leakage of LNG from damaged CCS under sloshing impact loadings. Guidance notes on the strength assessment have been suggested under the sloshing impact loads, involving the ultimate strength of MARK III membrane-type CCS component materials(ABS, 2006).
To ensure a reasonable and reliable safety assessment of CCS, its criteria should be established for the large deformation and strength of its components and their shock failure characteristics under sloshing impact loadings, with the consideration of their cryogenic material properties. To achieve a reasonable structural safety assessment of CCS, it is necessary to develop the sloshing analysis techniques for more accurate and correct predictions of impact loading on the CCS, and to carry out full-scale sloshing analysis with fine-meshed CCS models. However, it is impossible to perform the full-scale tank sloshing simulations with fine-meshed CCS in practice because of the Courant time step
* 정회원∙한국해양대학교 조선해양시스템공학부 교수 [email protected]
** 학생회원∙한국해양대 조선해양시스템공학부 석사과정 [email protected], [email protected] *** 학생회원∙한국해양대 조선해양시스템공학부 학부생 [email protected], [email protected]
size criterion of the explicit hydrocodes involved, such as LS-DYNA code(LSTC, 2009).
Local zooming analysis technique might be useful in overcoming this limitations in the structural safety assessment of CCS. While the Lagrangian interface segments could be handled in the structural analysis problem, the Eulerian or ALE(Arbitrary Lagrangian Eulerian) interface parts should be treated in the Fluid-Structure Interaction(FSI) analysis problem. Contrary to the former case with the history data of spatial and material points together at the same time, their material point history data of the latter case should be traced separately from the spatial point ones. After getting the material histories of each ALE tracer particle, such as position, velocity and pressure etc., in the global sloshing simulation, its velocity is applied to the ALE part in the local zooming analysis. Unfortunately, the material history position of each ALE part can not be applied to the local zooming analysis model in LS-DYNA code.
FSI problems, such as sloshing and slamming etc., could be conveniently simulated by moving mesh algorithm and overlap capability of grid to structure mesh using the multi-material Arbitrary Lagrangian Eulerian(MMALE) formulation and the Euler–Lagrange coupling algorithm of LS-DYNA code. VOF method is adopted for solving a broad range of nonlinear free surface problems and coupling algorithm is more suitable for the FSI problems with very complicated deformable structure, where fluid grid can overlap the structural mesh(Aquelet et al., 2003 and 2006; Souli et al., 2000).
The objective of this study is to demonstrate the procedure of the structural safety assessment of MARK III membrane type CCS under sloshing impact loadings using local zooming analysis technique of LS-DYNA code. Full-scale sloshing DSME tank with 70% filling level was used for the local zooming analysis of CCS, and 1/50 scale 3D one layer and 3D full model sloshing simulations with 30% filling level were also carried out for the feasibility study of 3D one layer sloshing tank model instead of the 3D full one. For the examination of the effect of flexibility of CCS components on the shock impact response, wet drop simulation with rigid CCS model was also performed.
2. Sloshing Simulations
1/50 scale DSME rectangular tank models with 30%, 50% and 70% filling levels were tested by DSME(Daewoo Shipbuilding & Marine Engineering Co., Ltd.), where its dimension is 0.80m×0.50m×0.36m, as shown in Fig. 1. Harmonic sway excitations were applied with 20.0mm amplitude and the same excitation frequency with the natural one. Impact pressures were measured at 9 points on the side wall and top ceilings. As shown in Fig. 2, 3 tank F.E. mesh models were used for the sloshing simulations.
C6 C5 C9C8 C7 C1 C2 C3 500 350 52.5 62.5 62.5 125 62.5 10 125 10 10 10 800 C4 C6 C5 C9C8 C7 C1 C2 C3 500 350 52.5 62.5 62.5 125 62.5 10 125 10 10 10 800 C4 (a) Iso-view (b) h/L = 0.3 (c) h/L = 0.7
(a) 1/50 scale 3D one layer (b) full-scale 3D one layer (c) 1/50 scale 3D full
Fig. 2 Configuration of F.E. mesh of 3D one layer and full tank model 2.1. 30% filling levels
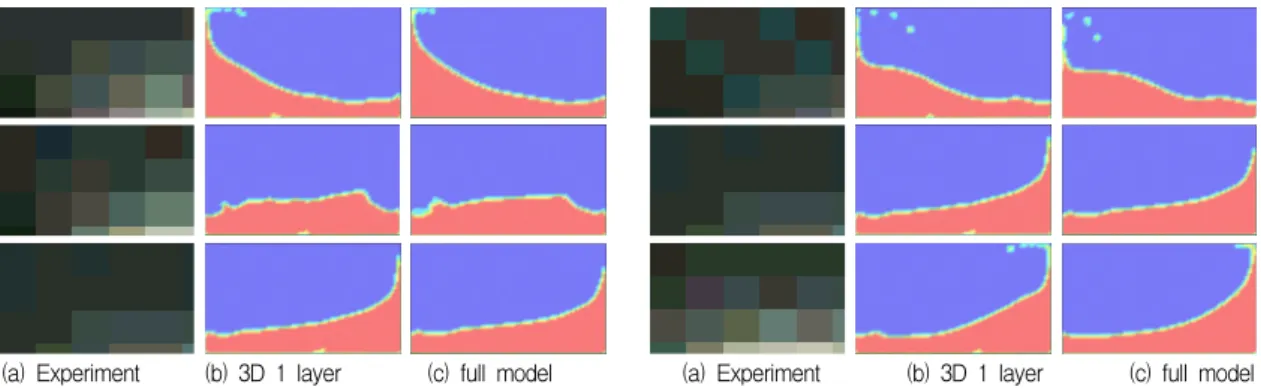
Fig. 3 illustrates the comparisons of free surface profiles between the experiment and simulation for the 30% filling level sloshing, where the 1st column shows the snapshots of the experimental results, and the following ones, those of 3D one layer(Lee et al., 2010a & 2010c) and 3D full model results, which are taken during an arbitrary period. Fig. 4 shows the iso-view simulation profiles of 1/50 scale 3D full model, and Fig. 5 compares the impact pressure responses of the experiment and simulations of 3D one layer and 3D full models at C1 and C7 points on the side wall and top ceiling.
(a) Experiment (b) 3D 1 layer (c) full model (a) Experiment (b) 3D 1 layer (c) full model
Fig. 3 Configuration of 2D fluid sloshing behavior in 1/50 scale DSME model with 30% filling level
Fig. 4 Configurations of 3D fluid sloshing behavior in 1/50 scale 3D full DSME model with 30% filling level
(a) Experiment(C1) (b) 3D 1 layer & full model(C1) (a) Experiment(C7) (b) 3D 1 layer & full model(C7)
Fig. 5 Sloshing responses at C1 and C7 in 1/50 scale DSME tank model with 30% filling level It could be found that the overall simulation results of 3D one layer and full model show the relatively good agreement to those of experiments in the pressure responses, the global and local motions. The impact peak pressures in the simulation occurred more or less larger than those of experiment.
Especially, no impact pressure responses occurred at the top corner points in the experiment due to the wide breadth of tank model. As shown in Figs. 3 and 4, it could be found that the free surface profiles of 3D one layer model are almost the same as those at the center plane of 3D full model, except in their corners, and that impact pressure responses are also almost the same between 3D one layer and 3D full model, as can be seen in Fig. 5. The swirling phenomena were not shown in the 3D full model sloshing simulation with wide breadth tank. It might be suggested that 3D one layer model sloshing simulation could be used for the full model one.
2.2. 70% filling level
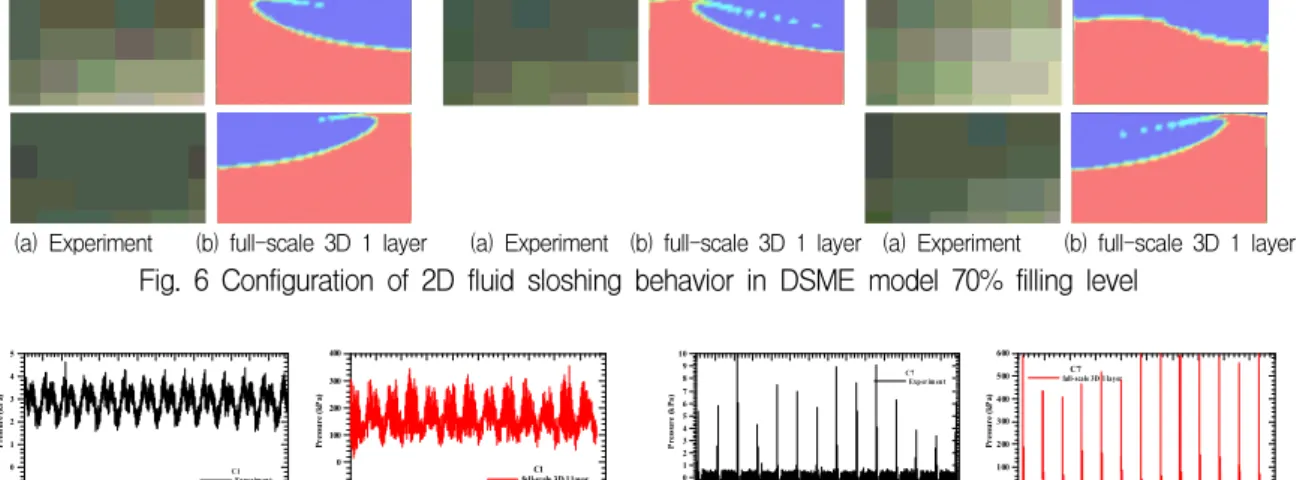
Full-scale 3D one layer sloshing simulation with 70% filling level was carried out for the local zooming analysis with harmonic sway excitation of 1.0m amplitudes multiplied by its scale and the excitation frequency with the same natural one according to its dimension. Fig. 6 shows the comparison of free surface profiles between the experiment and simulation for the 70% filling level sloshing, where the 1st column illustrates the snapshots of the experimental results, and the following one, full-scale 3D one layer results, which are also taken during an arbitrary period. Fig. 7 compares the impact pressure responses of experiment and simulation at C1 point on the side wall and at C7 point on the top ceiling. It could be found that the overall simulation results show the good agreement to those of experiment in the pressure responses, the global and local motions.
(a) Experiment (b) full-scale 3D 1 layer (a) Experiment (b) full-scale 3D 1 layer (a) Experiment (b) full-scale 3D 1 layer
Fig. 6 Configuration of 2D fluid sloshing behavior in DSME model 70% filling level
6 7 8 9 101112 1314 151617 18 1920 Time (sec) -1 0 1 2 3 4 5 P res su re ( kP a) C 1 Exper im en t 20 30 40 50 60 70 80 90 100 110 120 Time (sec) -100 0 100 200 300 400 P re ss ure (k P a) C1 full-scale 3D 1 layer 6 7 8 9 1011 1213 141516 1718 1920 Time (sec) -1 0 1 2 3 4 5 6 7 8 9 10 P res su re ( k P a) C 7 Exp er im en t 20 30 40 50 60 70 80 90 100 110 120 Time (sec) 0 100 200 300 400 500 600 P re ss ur e ( kP a) C7 full-scale 3D 1 layer
(a) Experiment (C1) (b) full-scle 3D 1 layer(C1) (a) Experiment(C7) (b) full-scale 3D 1 layer (C7)
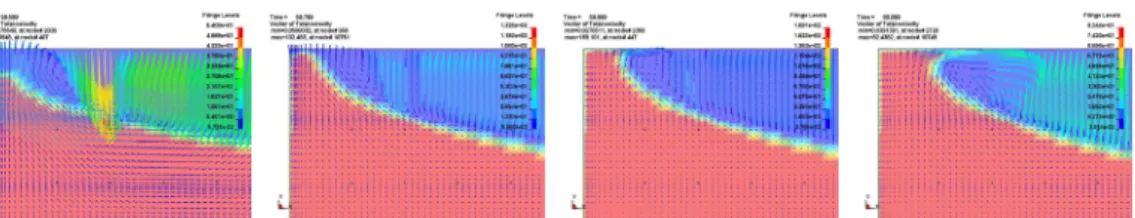
Fig. 7 Sloshing responses at C1 and C7 in full-scale 3D one layer DSME tank model with 70% filling level Fig. 8 illustrates the pressure responses at C7 point for the duration 59.5∼65.8sec, and Fig. 9, the sloshing profiles according to the velocity vector of fluid ALE parts during 59.6∼60.1sec for the investigation of fluid ALE interface parts. Since there is no visualized pre/postprocessor for tracing the Eulerian or ALE interface history information at present, very huge and tedious processes were followed. Fig. 10 shows the diagram for tracing one fluid ALE part in the tank coordinates with origin at its center point according to time, and Fig. 11, their distributions with velocity vector at time 59.6 sec. The
trend of the velocity distributions of the traced interface parts seems to be similar to the velocity vector responses at 59.6 sec, as shown in Figs. 9 and 11. Because of no option in LS-DYNA code to apply the current position of ALE interface part to the input deck contrary to the Lagrangian interface segment, local zooming analysis can not be carried out from the beginning computational time. In this study, the local zooming analysis was performed from the specific computational time as the beginning one.
59.559.6 59.759.859.9 60 60.160.260.360.4 60.5 60.6 60.760.8 Time (sec) 0 100 200 300 400 500 600 P res sure (kP a ) C7 200mm-50times
Fig. 8 Pressure responses at C7 point
Fig. 9 Sloshing profiles with vector velocity at the left corner area
0 10 20 30 40 50 60 70 80 90 100 110 time -20.00 -15.00 -10.00 -5.00 0.00 5.00 10.00 15.00 20.00 X -c oo rdi na te 0 10 20 30 40 50 60 70 80 90 100 110 time -5.00 -2.50 0.00 2.50 5.00 7.50 10.00 12.50 Y-co or di na te -20 -10 0 10 20 X-coordinate -5.00 -2.50 0.00 2.50 5.00 7.50 10.00 12.50 Y -c oo rdi na te
Fig. 10 Profile of trace of fluid ALE part and velocity distribution of fluid ALE parts at 59.6 sec
-20 -19.5 -19 -18.5 -18 -17.5 -17 -16.5 -16 -15.5 -15 -14.5 -14 -13.5 -13 -12.5 -12 -11.5 -11 -10.5 -10 x coordinate(m) 5.00 5.50 6.00 6.50 7.00 7.50 8.00 8.50 9.00 9.50 10.00 10.50 11.00 11.50 12.00 12.50 y c oo rd in ate (m )
Fig. 11 Velocity distributions of fluid ALE parts at 59.6 sec 3. Local Zooming Analysis of CCS
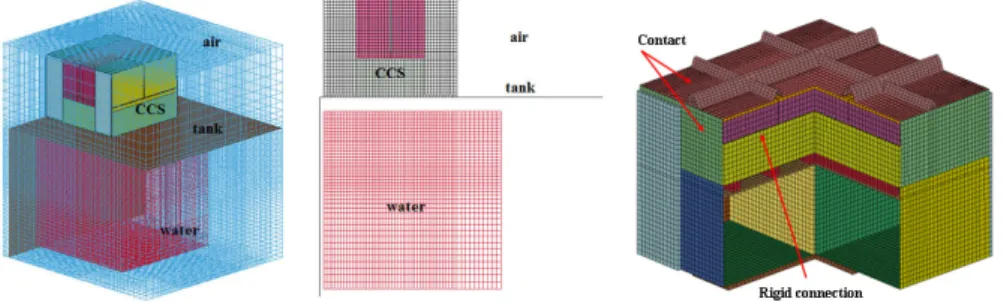
CCS was attached at the left top corner of full-scale sloshing tank with 70 % filling level, with its dimension 940×940mm, as shown in Fig. 12. Pressure response was measured at the center of membrane
of CCS, which is corresponding to C7 point of full-scale sloshing tank model. The average vertical velocity was about 10.0m/sec from the trace of the velocity diagram under the water ALE parts under the CCS of tank, as shown in Fig. 11.
Fig. 12 Configuration of 3D finite element of local zooming analysis and CCS specimen model 3.1. Wet drop simulation
Impact velocity 10.0m/sec is corresponding to the 5.7m drop height of CCS wet drop test and the peak pressure, to the around 1,400.0kPa by the wet drop test and simulation(Lee et al., 2010b). The wet drop test was carried out by PNU. Peak pressure, 500.0kPa, was obtained by the drop height 2.0m with initial velocity 5.8m/sec with 0.1m height. Peak pressure, 500.0kPa was also measured in the full-scale 3D one layer global sloshing simulation in this study. This discrepancy could be caused by the flexibility of tank structure. Wet drop simulation was carried out at drop height 3.0m with rigid membrane of CCS. Fig. 13 shows the pressure responses of wet drop experiment and simulations, such as original and modified(flexible corrugation), and rigid membrane model. The pressure profile was greatly changed to blunt shape with almost half peak pressure and its late occurrence with no change in the pressure impulse. 0 0.01 0.02 0.03 0.04 0.05 Time(sec) - 2 0 2 4 6 8 10 12 P res su re( b ar )
M ARK III Cor r . (l igh t) 0D 3M
E xpe ri m en t Origi nal M od ifi ed R igi d
Fig. 13 Pressure responses of wet drop simulation 3.2. Local zooming analysis
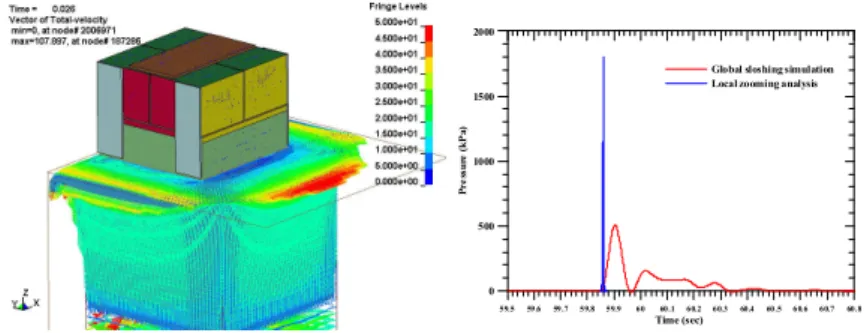
Fig. 14 compares the pressure responses of local zooming analysis of CCS and global sloshing analysis. As expected, the peak pressure 1,800kPa of the former was very high compared that of the latter, due to the deformable CCS with fine F.E. mesh and rigid shell tank with rough F.E. mesh. However, the pressure impulse of the former was to too small compared to that of the latter with very short duration. This trend was shown in the wet drop test and simulations in this study. In addition to
the development of local zooming analysis technique, this discrepancy should be verified for the more reasonable structural safety assessment of CCS under the severe sloshing impact loadings.
59.5 59.6 59.759.8 59.9 60 60.160.2 60.360.4 60.560.660.7 60.8 Time (sec) 0 500 1000 1500 2000 Pr e ss ur e ( kP a)
Global sloshing simulation Local zooming analysis
Fig. 14 Pressure responses of local zooming analysis
4. Conclusions
In this study, local zooming analysis was carried out for the structural safety assessment of MARK III membrane type CCS under sloshing impact loading with FSI analysis technique of LS-DYNA code, such as sloshing and wet drop simulations with DSME tank sloshing model and wet drop CCS specimen. Big discrepancy was found in the pressure responses from the local zooming analysis and full-scale global sloshing simulation in this study, which will be continued for the future study.
Acknowledgements
This paper is a part of “Development of Large Test Facility & Infrastructure for Sloshing in LNG Cargo Containment System–Part 2 : Development of Procedural method and Structural Safety Assessment for LNG CC Design" supported by the Ministry of Knowledge and Economy, Korea. Financial support through the Industrial Strategic Technology Development Program (Grant No. 10033791) is greatly acknowledged.
We would like to appreciate DSME(Daewoo Shipbuilding & Marine Engineering Co., Ltd.) and PNU(Pusan National University) for their test results in this study: 1/50 scale DSME rectangular tank model sloshing test with 30%, 50% and 70% filling levels by DSME and wet drop test of CCS by PNU.
References
ABS (2006) Guidance Notes on Strength Evaluation of Membrane-Type LNG Containment System under Sloshing Loads.
Aquelet, N., Souli, M., Gabrys, J.. and Olovsson, L. (2003) A new ALE formulation for sloshing analysis, Struct. Engrg. Mech. 16(4), pp. 423–440.
Aquelet, N., Souli, M., and Olovsson, L. (2006) Euler–.Lagrange coupling with damping effects: Application to slamming problems, Computer Methods in Applied Mechanics and Engineering, 195,
pp. 110–132.
Lee Sang-Gab, Baek Yun-Hwa and Lee In-Ho, Yang Kyung-Kyu and Kim Younghwan (2010a) Numerical Simulation of 2D Sloshing by using ALE2D Technique of LS-DYNA and CCUP Methods, Proceedings of the 20th International Offshore and Polar Engineering Conference, Beijing, China, June 20 ∼ 25, 2010, 3, pp. 192 ∼ 199.
Lee Sang-Gab, Lee In-Ho and Baek Yun-Hwa (2010b) Wet Drop Impact Response Analysis of Cargo Containment System in Membrane-type LNG Carrier using FSI Technique of LS-DYNA, Proceedings of the 20th International Offshore and Polar Engineering Conference, Beijing, China, June 20 ∼ 25, 2010, 3, pp. 206 ∼ 214.
Lee Sang-Gab, Lee In-Ho and Hong Anh (2010c) Numerical Simulation of Sloshing using LS-DYNA code, 대한조선학회 2010년도 추계학술대회 논문집, pp. 463-477.
LSTC (2009) LS-DYNA User's Manual, Version 971 R4.2.1, Livermore Soft Technology Corp., USA. Souli, M., Ouahsine, A., and Lewin, L. (2000) ALE formulation for fluid-structure interaction problems,