2 0 2 0
CONTRIBUTORS
1. The Current Status and Policy of Agro-food R&D •Park Jiyun
2. Environment-Friendly Agriculture •Jeong Hakkyun
3. Climate change and Response •Sung Jaehoon
4. International Agricultural Development and Cooperation •Heo Jang, Kim Jongsun
5. The Response Strategies of Agriculture and Rural Areas in the Fourth
Industrial Revolution •Kim Yeanjung
6. Direct Payment Program •Kim Taehun
7. Job Creation in Agriculture and Rural Areas •Ma Sangjin
CHAPTER 6 Main Issues in Agricultural and Rural Policy
1. The Land and Population •Park Daeshik
2. The National Economy and Agriculture •Park Daeshik
3. Agricultural and Rural Budget •Kim Meebok
4. The Past and Present of Korea’s Agricultural Policy •Lee Myoungki
CHAPTER 1 Introduction
1. Farmland •Kim Soosuk
2 Agricultural Structure •Rhew Chanhee
3. Farm Household Economy •Park Joonkee
4. Agricultural Cooperatives •Park Seongjae, Hwang Euisik
CHAPTER 2 Agricultural Resources and Structure
1. Grains •Kim Jongin, Kim Taehun
2. Livestock •Jeong Minkook
3. Horticulture and Specialty Crops •Park Kihwan
4. Forestry •Min Kyungtaek
CHAPTER 3 Agricultural Industry Trends by Item
1. Agro-Food Marketing •Kim Byungryul
2. Food Industry •Choi Jihyeon, Park Misung
3. Agricultural Input Industry •Suh Daeseok
4. Food Consumption & Related Policy •Hwang Yunjae
5. Trade Liberalization & Agricultural Trade •Song Jooho, Moon Hanpil
CHAPTER 4 Agriculture-related Industries
1. Rural Communities •Park Daeshik
2. Quality of Rural Life •Seong Jooin
3. Rural Welfare •Choi Kyeonghwan, An Sok, Kim Jeongseop
4. Rural Development Policy •Song Miryung
CHAPTER 5 Rural Communities and Sustainable Development
Agriculture was at the center of the Korean economy when the government was established. However, it gave way to manufacturing through the rapid growth period. In pursuing export-oriented policies, the government had to open its markets, including the agricultural market. As a response to this trend, the agricultural sector endeavored to enhance competitiveness through business scale-up and specialized farming. Despite such efforts, profitability in the agricultural sector was lower than in other sectors. Consequently, population drain continued and caused aging issues in rural communities. The nation has tried to resolve these issues and others that happened to rural communities through economic progress. It also has made various policy efforts to revitalize rural areas and create growth engines for each development phase. Korea’s agricultural development consists of four periods. The first period is the agrarian society focusing on agriculture until the 1950s, after its independence from Japanese colonial rule. This pre-industrialization period has significance in that the nation implemented the farmland reform and enabled farmers’ land ownership. However, many challenges, such as low productivity and food shortage, happened in the period while the nation’s economic base collapsed due to the Korean War (1950-1953). The government focused on grain management to resolve the food shortage.
The second period is the rapid growth period from the 1960s to the 1980s. The nation’s economic structure shifted from agriculture to manufacturing. In this period, the manufacturing sector’s technological progress drove growth in agriculture. Notably, Korea achieved a Korean-style Green Revolution by accomplishing food self-sufficiency. It revitalized the rural community and improved rural settlement conditions through the Saemaul Movement, the nationwide drive for rural development.
The third is the period from the late 1980s to 2009 when the nation pursued globalization and agricultural policy reforms. The Korean economy joined the global trade liberalization trend, and the agricultural market opening became in full swing. The government executed various policies to compensate for damages to farmers, including the direct payment programs, to minimize market opening impacts. It also carried out policies to rebuild the agricultural structure through farming scale-up and professional workforce training. As business risk management gained attention in the agricultural sector, the government introduced agricultural disaster insurance. Besides, it endeavored for environment-friendly farming in this period.
The fourth is the period from the 2010s till now. The agricultural sector focuses on its roles for the public interest to enhance its competitiveness and
Agriculture in KOREA 2020
raise sustainability. Following this trend, the government has shifted its policy direction from competitiveness to people and expanded its policy targets to include the entire public. It has put full energy into devising various policies to achieve “balanced development between agriculture and the environment.”
The Korea Rural Economic Institute has published Agriculture in Korea to share implications in Korea’s agricultural experiences through development stages, including smallholding, the Green Revolution (food self-sufficiency), responses to agricultural market opening, and endeavors to achieve sustainable farming. After the first edition in 1999, KREI published the following issues in 2008, 2010, and 2015. This book is the fifth edition published for 2020.
Agriculture in Korea 2020 introduces the state of Korea’s agriculture and rural communities and deals with core issues to enhance sustainability in agriculture to raise readers’ understanding in Korean agriculture. The core issues newly covered in this book include policy directions for agricultural sustainability, policies related to food consumption behavior changes, the application of the 4th industrial revolution technologies to agriculture, countermeasures to climate change, the direct payment programs, and the state of foreign workers in Korea. I hope that Agriculture in Korea 2020 will help overseas readers, including officials and experts in agriculture, to understand Korea’s agriculture
and rural communities. Implications they will take from the book will promote international partnerships for policy and research development. Various experiences Korea obtained through agricultural progress will help emerging countries achieve agricultural progress.
Finally, I would like to thank authors, translators, and editors for their outstanding commitment to Agriculture in Korea 2020. I also appreciate the Rural Development Administration for contributing valuable information and pictures presented in the book. I sincerely expect Agriculture in Korea 2020 will deliver global readers broad and in-depth information on Korea’s agriculture and open paths for strong international partnerships.
December 2020
Kim Hongsang
President, the Korea Rural Economic Institute
Agriculture in KOREA 2020
CONTENTS
Introduction
1. The Land and Population 25
2. The National Economy and Agriculture 29
3. Agricultural and Rural Budget 35
4. The Past and Present of Korea’s Agricultural Policy 44
CHAPTER 1
Agricultural Resources and Structure
1. Farmland 66
2. Agricultural Structure 79
3. Farm Household Economy 98
4. Agricultural Cooperatives 110
CHAPTER 2
Agricultural Industry Trends by Item
1. Grains 126
2. Livestock 148
3. Horticulture and Specialty Crops 164
Agriculture-related Industries
1. Agro-Food Marketing 218
2. Food Industry 247
3. Agricultural Input Industry 260
4. Food Consumption & Related Policy 280
5. Trade Liberalization & Agricultural Trade
CHAPTER 4
Rural Communities and Sustainable Development
1. Rural Communities 318
2. Quality of Rural Life 336
3. Rural Welfare 350
4. Rural Development Policy 366
CHAPTER 5
Main Issues in Agricultural and Rural Policy
1. The Current Status and Policy of Agro-food R&D 384
2. Environment-Friendly Agriculture 396
3. Climate change and Response 415
4. International Agricultural Development and Cooperation 431 5. The Response Strategies of Agriculture and Rural Areas
in the Fourth Industrial Revolution 444
6. Direct Payment Program 463
7. Job Creation in Agriculture and Rural Areas 486
1-1 Main indices of national accounts 31
1-2 Changes in agriculture’s status in nation economy 33
1-3 2020 budget distribution by sector 35
1-4 Budget share by sector (%) 40
1-5 MAFRA’s total expenditure in 2020 (in KRW hundred millions) 42
1-6 Details of the MAFRA’s total expenditure in 2020 43
1-7 12 Reform Agendas and 3 Action Plans for a shift in rural policy 64
2-1 State of farmland in agricultural development areas 67
2-2 Major acts on the farmland system 71
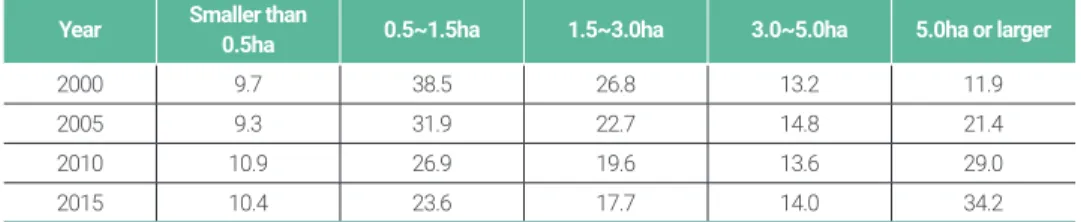
2-3 Number (share) of farm households by land size 73
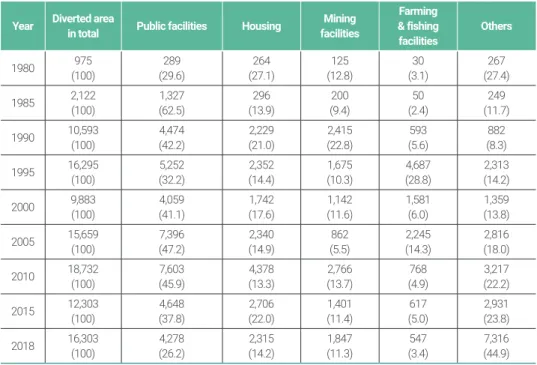
2-4 Fallow land and diversion area changes 74
2-5 Land diversion by purpose 75
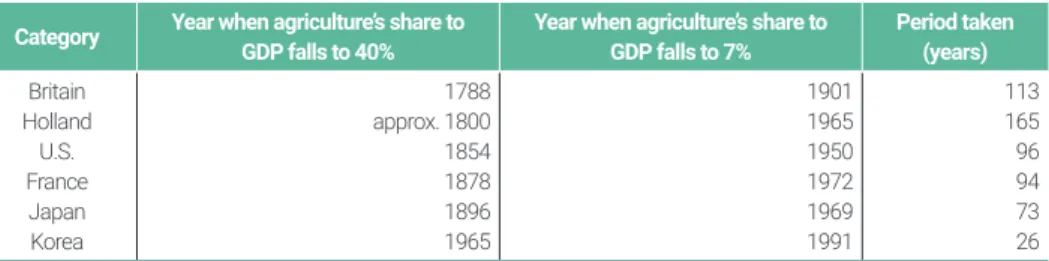
2-6 Agriculture’s share in GDP in Korea and other countries 79
2-7 Farming population trends by age group (1970~2015) 81
2-8 Tornqvist index by individual production factor 83
2-9 Structural change trends by commodities 87
2-10 Share (%) of rice cultivation by farming size per farm household 88
2-11 Share (%) of farm households using hired laborers (2015) 90
2-12 External and internal factors for Korean agriculture 95
2-13 Results of survey on factors influencing Korea’s agricultural structure 96
2-14 Results of survey on agricultural restructuring strategy 96
2-15 Primary cooperatives’ assets and debts (nationwide total) 116
2-16 Primary cooperatives’ business performance (2018) 116
2-17 Primary cooperative’s income and loss 117
2-18 Annual growth rate (%) of Nonghyup businesses (in nominal prices) 121
3-1 Rice consumption per capita 128
3-2 Stocks, demand for processing and alcohol, and aid to North Korea 129
3-3 Direct payments for rice provided 135
3-4 Quantity of rice for reserves 137
3-5 Soybean supply and demand by year 140
3-6 Soybean procurement status by year 141
3-7 Beef import volume by country (based on inspection) 151
3-8 Value of dairy imports by year 154
3-9 Volume of pork imports by country 157
3-10 Volume of chicken meat imports by country 159
3-11 Trends in the cultivation area by vegetable type 165
3-12 Cultivation area and production by major item of vegetables 167
3-13 Trends in exports and imports of vegetables 171
3-14 Cultivation area and production by item of fruit 173
3-15 Trends in exports and imports of fruit 178
3-16 Cultivation area by type of flowers 180
3-17 Sales by major item of flowers 182
3-18 Trends in exports and imports of flowers 184
3-19 Trends in the cultivation area by classification of ginseng 186
3-20 Cultivation area and production by mushroom item 188
3-21 Trends in exports and imports of specialty crops 191
3-22 Management types of forestry households 197
3-23 Analysis of forestry household income 198
3-24 Trends in forestry production 199
3-25 Shipments of the wood industry 200
3-26 Production in major wood products 201
3-28 Imports and exports of forest product 204
3-29 Visitors and revenue of forest recreation sites 205
3-30 Assessment of non-market services of forests 206
3-31 Success factors of forest rehabilitation 208
3-32 Evolution of forest mater plans 209
4-1 Korea’s agro-food marketing margin (2018) 221
4-2 Marketing margin rate by agro-food type (2018) 222
4-3 Korea’s margin vs. Japan’s margin in marketing stages (2014) 223
4-4 Agro-food marketing margin by stage 223
4-5 Wholesale shippers and registered local distributors for fruits and vegetables (2018) 225
4-6 Share of forward contraction field by major crops (%) in 2018 225
4-7 Ratio of fruits and vegetables by shipping entity 228
4-8 Establishment and operation of shipping-point marketing facilities by
the type of policy support (2018) 229
4-9 Ratio of APC-handled amount to the total of 10 major items in 2018 230
4-10 Transaction volumes by wholesale market type (2012 ~ 2018) 232
4-11 Ratio of each trading method in public wholesale markets (2018) 235
4-12 Ratio of fixed and bargaining price transactions 235
4-13 Sales by retail type in Korea (2015~2019) 236
4-14 Number of local food direct stores in Korea 240
4-15 Numbers of Nonhyup’s direction stores for local food and participating farmers 241
4-16 Ratio of agriculture and food-related industries 248
4-17 Number of food manufacturers and sales volume 249
4-18 Food manufactures’ employment size and sales (2018) 250
4-19 Changes in households’ food purchase and dine-out spending (as of 2015) 251
4-20 Fresh-cut food production and sales 252
4-21 Food manufacturers’ use of local ingredients 254
4-22 Production of major agricultural machinery 261
4-23 Number of agricultural machines held by farmers 261
4-24 Imports and exports of agricultural machinery 262
4-25 Export size by machine type 264
4-26 Export volume by country (2018) 264
4-27 Fertilizer production and consumption per year 267
4-28 Fertilize consumption by country (kg per ha) 268
4-29 Fertilizer imports and exports 269
4-30 Major changes in chemical fertilizer supply system 270
4-31 Pesticide usage by country 273
4-32 Maximum residue limits with the introduction with PLS 275
4-33 Number of registered seed firms 276
4-34 Supply of certified seeds 277
4-35 Seed renewal rates 277
4-36 Vegetable seed production by year 278
4-37 Vegetable seed imports and exports by year 278
4-38 Sales by retailer type 286
4-39 Agro-food’s transactions online 286
4-40 Changes in monthly spending by agro-food type 289
4-41 Amount of intake by food group 294
4-42 Key items tariff rates and tariff-rate quotas (TRQs) 302
4-43 Korea’s agricultural exports 308
4-44 Agricultural Export of Korea by Country 309
4-45 Agricultural Imports of Korea 3 1 1
5-1 Changes in elderly population-related indicators (1980-2018) 320
5-2 Household composition changes by household member (1980-2018) 321
5-3 Household composition changes by generation (1980-2018) 322
5-4 The elderly living alone and the grandparents-grandchildren household 323
5-5 Rural residents’ attitudes toward elderly parent support 328
5-6 Rural residents’ class consciousness 329
5-7 Rural residents’ income satisfaction 329
5-8 Rural residents’ marriage attitudes 329
5-9 State of multicultural families in Korea (2018) 331
5-10 Foreign spouses’nationality married to Korean men in rural areas (2018) 331
5-11 Migration for farming and rural life by year (2001-2014) 332
5-12 Trend of migration by year after migrations for rural life and
farming were redefined (2015-2019) 333
5-13 Strategies and tasks of 4th plan for life quality improvement 341
5-14 Settlement condition improvements 343
5-15 Items showing significant differences between urban and rural residents 346
5-16 2018 survey results on satisfaction with current life 352
5-17 State of pension coverage 354
5-18 Rural and urban residents’ opinion on their health (%) 355
5-19 Challenges in disease treatment (%) 356
5-20 State of public health and medical organizations (Dec. 2018) 357
5-21 Changes in child population aged 12 or younger 358
5-22 Rural child welfare support in 2019 359
5-23 Essential matters for educational improvement 359
5-24 Senior welfare service uses (%) 360
5-25 Senior welfare services in demand (%) 361
5-26 Rural population trends 369
5-27 Aging in rural areas 370
6-1 R&D budgets of MAFRA, the RDA, and the KFS 385
6-2 Share of R&D expenditure by R&D entity 386
6-3 Institutions related to agro-food R&D and their business 389
6-4 Market size estimates for environment-friendly agricultural products (2015-2019) 401
6-5 The 2050 Roadmap to reduce greenhouse gas emissions in
agriculture, livestock, and fishery 422
6-6 Reduction measures distributed and targeted following the revised 2030 roadmap 424
6-7 Tasks for agricultural and livestock industries included in
the 2nd national climate change adaptation plan 427
6-8 Targets of ‘The 2nd Master Plan for International Development Cooperation’ 431
6-9 Strategies and implementation tasks of Korea’s international development
cooperation projects 432
6-10 Status of Korea’s ODA project budgets for agriculture (2016-2020) 433
6-11 Smart farm distribution goals and performance 448
6-12 Status of MAFRA’s smart farm support projects 452
6-13 Classification of domestic support according to the UR Agreement on Agriculture 464
6-14 Objectives by previous direct payment type 466
6-15 Details of MAFRA’s budget for direct payments in 2016-2019 467
6-16 A summary of previous direct payments (as of 2019) 469
6-17 Growth rates in agricultural income according to direct payments for rice 475
6-18 Unit price system of the area-based direct payments 481
6-19 Obligations to fulfill under the public-purpose direct payment program 482
6-20 Number of workers in agriculture and agriculture-related industries 487
6-23 Number of foreign agricultural workers introduced through
the employment permit system (E-9) 508
6-24 Status of sojourn of foreign agricultural workers introduced through
the employment permit system (E-9) 508
6-25 Number of foreign agricultural workers introduced through
the seasonal worker program (C-4) 509
6-26 Share of employment permit applications by year 510
6-27 Number of applications in the agricultural sector by business type and year 5 1 1
6-28 Number of foreign agricultural workers (C-4) each local government applied to
employ through the seasonal worker program 5 1 1
1-1 South Korea in Northeast Asia 26
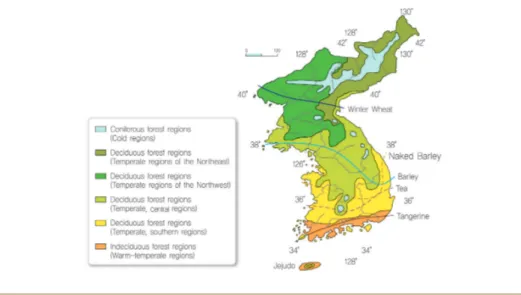
1-2 Climate and vegetation distribution 27
1-3 MAFRA’s account and fund flows 38
1-4 MAFRA’s budget and its share to national budget 39
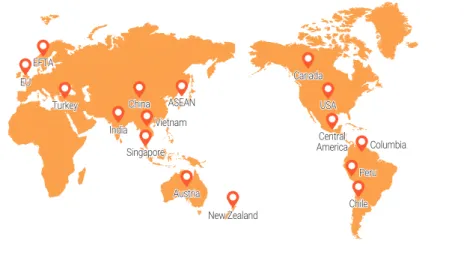
1-5 Countries in free trade agreements with Korea (as of February 2020) 55
1-6 Paradigm shift in agricultural administration 59
1-7 Agricultural vision and implementation tasks 61
1-8 Key rural indicators 62
1-9 Key indicators related to the rural economy 62
1-10 Key indicators related to rural communities 63
2-1 Countries in free trade agreements with Korea (as of February 2020) 80
2-2 Real farm income in total and by source (2003~2019) 82
2-3 Farmland area trends (1975~2018) 83
2-4 Capital intensity trends (1990~2018) 84
2-5 Changes in fixed assets per farm household (1963~2019) 84
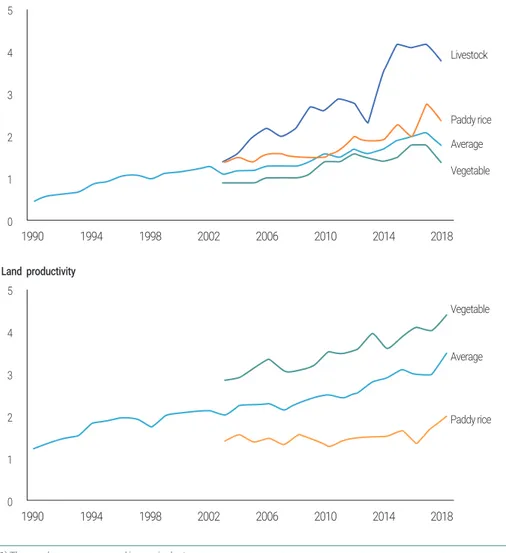
2-6 Changes in labor and land productivity (1990~2018) 86
2-7 Farming income by land size (1992~2017) 88
2-8 Land/ labor productivity and labor intensity by land size (1992~2017) 89
2-9 Farming with subsidiary businesses 91
2-10 Key indicators of farm household economy (1996=100) 100
2-11 Farming and non-farming income trends (1996~2019) 101
2-12 Trends of farm households’ terms of trade (2005=100) 103
2-13 Farming income, farm receipts, and management expenditures (1996=100) 103
2-14 Urban-rural income gap (1996~2019) 104
2-15 Farm households/ expenditure trends (1996~2019) 105
2-16 Farm households/ expenditure trends (1996~2019) 106
2-17 Changes in farm households’ purposes for debt 107
2-18 Organizational structure of Nonghyup 113
3-1 Trends in the rice cultivation area and rice yield 127
3-2 Rice stocks and inventory ratios 130
3-3 Trends in meat consumption and production 148
3-4 Number of farms raising Korean cattle and cattle raised 150
3-5 Beef production and consumption 150
3-6 Trends in the number of farms raising dairy cows and dairy cows raised 152
3-7 Milk consumption and domestic production 153
3-8 Trends in the number of pig farms and pigs raised 155
3-9 Trends in pork production and consumption 156
3-10 Trends in the number of broiler farms and broilers raised 158
3-11 Trends in chicken meat production and consumption 158
3-12 Trends in the number of layer farms and layers raised 161
3-13 Trends in egg consumption and production 161
3-14 Trends in the vegetable cultivation area and production 164
3-15 Trends in per capita annual consumption of vegetables 168
3-16 Trends in per capita annual consumption by major item of vegetables 169
3-17 Trends in the fruit cultivation area and production 172
3-18 Trends in per capita annual fruit consumption 175
3-19 Trends in per capita annual consumption by major item of fruit 176
3-20 Trends in the flower cultivation area 179
3-21 Trends in flower sales 181
3-22 Trends in per capita flower consumption 183
3-23 Trends in the ginseng cultivation area and production 186
3-24 Trends in the mushroom cultivation area and production 187
3-25 Trends in the cultivation area and production of tea leaves 189
3-26 Per capita annual consumption of specialty crops 190
3-27 Forest area and forest growing stock by age class 195
3-28 Status of domestic log production and use (as of 2019) 203
4-1 Distribution route of horticulture produce (2018) 220
4-2 Number of integrated marketing units 227
4-3 Transaction flow chart 231
4-4 Public wholesale markets’ volume traded and share to the total 233
4-5 Wholesale markets’ transaction flows 234
4-6 Big 3 Discount chain stores and their sales 237
4-7 Purchase amount of agro-fishery and livestock products by online marketplace type 238
4-8 Changes in food manufacturing’s ratio in added value (real) to total manufacturing 249
4-9 Food import and export trends 253
4-10 Imports and exports of agricultural machinery 263
4-11 Pesticide production trends(supply quantity) 271
4-12 Pesticide production trends(supply value) 272
4-13 Pesticide imports and exports 273
4-14 Changes in GNI per capita (constant prices in 2015) 281
4-15 Relative poverty rates (in disposable income) 281
4-16 Demographic changes and outlook 282
4-17 Number of one-person households and projections (as of 2017) 283
4-18 Women’s participation ratio in economic activities 284
4-19 Number of female householders and projections 284
4-20 Agro-food trades 285
4-21 Agro-food transactions online by outlet 287
4-23 Food purchase frequency 290
4-24 Food purchasing places 291
4-25 Online purchase frequency 291
4-26 Year-on-year change in online purchase frequency 292
4-27 Eco-friendly food purchase 292
4-28 Home-meal replacement 292
4-29 Functional food purchase 293
4-30 Energy intake rate by nutrient 295
4-31 Bound and MFN applied tariffs for agricultural products, 2012 301
4-32 Korea’s free trade agreements (as of June 2020) 306
5-1 Rural population changes 319
5-2 Five-year plans for life quality improvement 340
5-3 Core items of the rural service standards 342
5-4 Number of counties achieving core items in the service criteria 343
5-5 Number of social economic organizations by year (cumulated) 344
5-6 Urban and rural residents’ settlement satisfaction levels (2014-2019) 345
5-7 Satisfaction gap between urban and rural residents 345
5-8 Contract-based approach for policy implementation 348
5-9 Reorganizing procedure for policy implementation 349
5-10 Korea’s administrative districts and urban-rural categorization 368
5-11 Changes in policy environment and rural development policies 379
5-12 Net influx of population by city and county 380
5-13 Policy supports necessary for ideal rural life 381
6-1 Agro-food R&D implementation system 387
6-2 Trend of environment-friendly farming 389
6-3 Status of the area of environment-friendly agriculture by region (2019) 389
6-4 Shares of distribution channels of environment-friendly agricultural products 400 6-5 Changes in average annual maximum, mean, and
minimum temperatures by season (1912-2017) 416
6-6 Changes in the extreme climate index from 1912 to 2017 417
6-7 Distribution of the subtropical climate region according to climate change:
based on RCP6.0 417
6-8 Prospects for deviation ratios of annual precipitation on the Korean Peninsula in the early,
mid, and late 21st century by scenario: compared to 1981-2010 model climate values 418
6-9 Changes in the unit yield of mid-late maturing rice based on the RCP 8.5 scenario 419
6-10 Greenhouse gas emission trends in agriculture (in 1,000 tons of CO2eq) 422
6-11 Climate change adaptation cases: apple mango and banana cultivation sites
in Jeolla bukdo Province 425
6-12 Movement of producing areas of major crops 425
6-13 Status of MAFRA’s agricultural ODA project budgets (2015-2020) 434
6-14 Status of the RDA’s agricultural ODA project budgets (2015-2020) 435
6-15 Status of the KFS’s forest ODA project budgets (2015-2020) 436
6-16 Linkage between Fourth Industrial Revolution technologies and smart agriculture 445
6-17 Share of farms by smart farm item 448
6-18 Fourth Industrial Revolution technologies for smart rural areas 457
6-19 Changes in the rice price and the amount received by farmers 474
6-20 Changes in the agricultural policy paradigm 478
6-21 Basic structure of the public-purpose direct payment program 480
6-22 Annual rates of change in the number of agricultural employees: 1994-2019 489
6-23 Annual rates of change in the number of workers in agriculture-related industries:
2013-2019 490 6-24 Annual rates of change in the number of workers in education, culture, health care,
Agriculture
in KOREA
2020
1. The Land and Population 2. The National Economy and Agriculture 3. Agricultural and Rural Budget 4. The Past and Present of Korea’s Agricultural Policy
Introduction
Korea is located on the Korean Peninsula in East Asia. It has a history of around five thousand years. In the early 20th century, the nation went through
the colonial rule of Japan. After World War II, it was partitioned along the 38th
parallel: the North was under the Soviet Union and the South under the U.S. occupation. Then, the Korean War broke out and the nation divided into North Korea (officially, the Democratic People’s Republic of Korea) and South Korea (officially, the Republic of Korea). South Korea (afterward, Korea) was established
in 1948 and observed its 75th Independence Day in 2020.
The Peninsula’s position shows the characteristics of continental climates with seasonal winds blowing from the Asian continent and extensive seasonal differences in precipitation. In summer, it is hot and humid; in winter, it is cold and dry. Geographically, Korea is a small country with a lot of mountains.
As Korea is under the influence of Asia’s monsoon climates-high temperatures and humidity in summer, rice farming has long been developed. Historically, it thought highly of agriculture as the foundation of national growth. However, it did not have plenty of arable lands, and farmers tried hard to maximize yields from available lands. While the nation was rapidly industrialized, many farmers
left for cities. In the 21st century, as many changes happen in the rural landscape,
the Korean government pursues various novel policies for agricultural restructuring to keep pace with international norms.
CHAPTER 01
Intr oduction Agricultur al Resour ces and Structur e Agricultur al Industr y Trends by Item Agricultur e-r elated Industries Rur al Communities and Sustainable De velopment Main Issues in Agricultur al and Rur al P olicy
Before discussing the main topics of Korean agriculture, let me walk you through its geographic, economic, and demographic characteristics, as discussed in the sections below.
1. Land and Population
Area and Topography
The Korean Peninsula is located at 33-43 degrees north latitude and 124-132 degrees east longitude. The Korean Peninsula, extending southward, is bordered by Aprok and Tuman rivers in the north, the East Sea in the east, the South Sea in the south, and the Yellow Sea in the west.
The total area of the Peninsula is 223,000 ㎢, with the South occupying 100,284㎢ of the total. Farmlands take 17.1% of the total, forests 63.5%, and others 19.4%. The Peninsula’s coastlines reach 14,963 km in total. As it is tilted eastward, most mountains are in the east side and rivers flow westward or southward. And wide plains are located in the middle or downstream of those rivers.
Climate
Geographically positioned in the mid-latitudes of the northern hemisphere, Korea has a temperate climate. Its four seasons-spring, summer, autumn, and winter-are distinct. Situated between the Asian continent and the Pacific Ocean, it has a continental climate influenced by seasonal winds. As a result, unlike the seasonal changes of West European countries and other mid-latitude countries, its winter is cold and the summer is sweltering. Spring and autumn generally have clear and dry days thanks to migratory anticyclones. The average annual temperature ranges from 6℃ to 16℃, and the regional differences in average yearly temperatures are rather dramatic. Except for the mountainous areas, temperatures range from 10℃ to 16℃. The monthly average temperature of August-the hottest month of the year-is 25℃, while that of January-the coldest month-is -0.7℃.
Intr oduction Agricultur al Resour ces and Structur e Agricultur al Industr y Trends by Item Agricultur e-r elated Industries Rur al Communities and Sustainable De velopment Main Issues in Agricultur al and Rur al P olicy
The annual amount of precipitation is 1,500mm in the southern region and 1,300mm in the central region. By season, 50% to 60% of the yearly rainfall comes in summer and 5% to 10% in winter. Northwesterly seasonal winds are generally stronger than southwesterly winds. In autumn (September and October), southwesterly winds change into northwesterly winds. Typically, winds are weak, and the effect of land and sea breezes becomes clear in coastal regions. Humidity is the highest in July, mostly ranging from 80% to 90%. It is the lowest from January to April, when it varies from 30% to 50%. September and October generally have pleasant weathers with humidity posting around 75%.
During the rainy season in summer, torrential rains start from the southern coastal region in late June, reaching the central area, and continues for about 30 days. Occasionally the rainy spell comes in early September. Typhoons come around the Korean Peninsula between June and October, and two or three of them hit the nation on average.
Population
As of 2020, Korea’s population is 51.3 million, or 0.7% of the world’s 7.79 billion,
ranking 28th globally (Korea Population, Health and Welfare Association, 2020).
The population growth rate gradually declined from 2% in 1970 to 0.5% in 1990. In terms of population density, Korea ranked third in the world in 2015 with a population density of 519 persons/㎢.
According to the 2020 World Population Report (Korea Population, Health, and Welfare Association, 2020), those aged between 15 and 64 accounted for 71.7% and those aged 65 or older for 15.8%. One of the main demographic characteristics that have appeared recently is population aging. The aging index (the elderly-youth ratio) has steadily risen from 6.9 in 1960 to 126.5 in 2020. During the same period, the old-age dependency ratio has increased from 5.3 to 22.1. The difference between the aging index of cities and rural areas has been widening considerably. In 2018, the aging indices of cities and rural areas posted 98.7 and 189.6, respectively (Statistics Korea, 2018).
The farm population in 2019 was 2.25 million-4.3% of the total. And the number of farm households amounted to 1.01 million. Although the number of farm households increased to 2.6 million in the latter half of the 1960s, it decreased sharply afterward. The leading causes were industrialization and urbanization amid rapid economic growth. The ratio of farm household population has gradually reduced to the level of advanced countries (2%-4%), such as the United States, Japan, France, Germany, and Australia.
The economically active population accounted for 62.9% of the total in 2019. The number of people working in agriculture and forestry was 1.40 million, or 5.1% of the total population. However, the figure has since been on the decrease.
Intr oduction Agricultur al Resour ces and Structur e Agricultur al Industr y Trends by Item Agricultur e-r elated Industries Rur al Communities and Sustainable De velopment Main Issues in Agricultur al and Rur al P olicy
2. National Economy and Agriculture
An Overview of the Korean Economy
Korea’s modern era started with tragic events. In the early 20th century, it
intended to adopt a western economic system. However, before it fulfilled the conversion, the nation was annexed by Japan. Later, the Korean War broke out in 1950 and pulled the nation into chaos. The nation, rising from the ashes after the war, had to rebuild its economic foundation.
The Korean government endeavored to grow the economy in the 1960s. It set up the Economic Planning Board and made five-year economic development plans to build industrial infrastructures and increase exports. The government increased investments for economic development and provided financing for exporters.
Achieving the high growth in the 1960s and 1970s, the government intervened
in the market and distributed resources efficiently. The 2nd oil shock at the end
of the 1970s pushed the national economy into turmoil. However, using the crisis as an opportunity, the government reformed financial markets and pursued industrial restructuring. As a result, its economy revitalized at an annual growth rate of 6% to 9%.
In the mid-1980s, the value of the U.S. dollar, oil prices, and international interest rates dropped drastically. Korea used these external changes to grow further. It achieved a high current account surplus and stabilized commodity prices. Nevertheless, the public’s demand for economic democratization became strong. In 1987, the government listened to the public’s call and pursued fairness and welfare, along with efficiency and growth. Besides, labor-management disputes occurred frequently, and average wages rose sharply.
In 1992, a civilian government took power and tried to differentiate itself from the past military regime. It announced the five-year plan for economic development and emphasized people’s participation and creativity. It disbanded the Economic Planning Board, which used to lead economic growth. Besides, it pursued a market economy through reforms. The nation gained membership to the World Trade Organization (WTO) and the Organization for Economic Cooperation and Development (OECD). Despite its endeavors for new growth, Korea was hit hard by the financial crisis at the end of 1997. It requested the International Monetary Fund (IMF) a financial bailout, and its economy went through fundamental changes.
A new government took over in 1998 and sought to restructure the overall society aggressively. Thanks to such effort, the economy quickly escaped the shock of the financial crisis. In August 2001, Korea ultimately came out of the IMF’s bailout program. Although Korea’s foreign currency reserves were nearly
run out, it came to hold the world’s 6th largest volume of reserves in 2015.
After the financial crisis, the government pursued market competition, economic democratization, growth, and fair distribution. Recently, the economic recession nationwide negatively impacts Korea, and the government aims to recover growth potential and create more jobs.
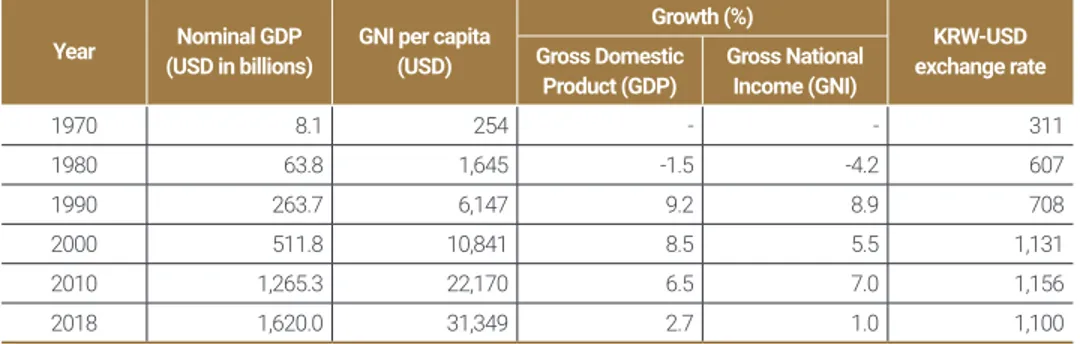
According to the Bank of Korea’s National Accounts and the World Bank’s World Development Indicators, Korea’s nominal gross domestic product (GDP)
in 2018 was approximately USD 1.62 trillion, ranking 12th globally. Its GNI per
Intr oduction Agricultur al Resour ces and Structur e Agricultur al Industr y Trends by Item Agricultur e-r elated Industries Rur al Communities and Sustainable De velopment Main Issues in Agricultur al and Rur al P olicy
Economic Development and the Role of Agriculture
Korea went through modernization and industrialization in the past 60
years, and it has become an economic power-10th biggest in the world. Korea’s
economic structure has grown through primary, secondary, and tertiary industries. Although there were not enough statistics available at the time of the country’s establishment, the working population in the primary industry must have reached at least 80% to 90%. However, the number of people working for agriculture, forestry, and fisheries was about 1.39 million in 2019, which was merely about 5.1% of the total economically active population.
The reduction in the agricultural workforce resulting from economic advancement is a common phenomenon among advanced countries. Nonetheless, Korea experienced structural changes two to five times faster than in developed countries. For example, it took around 100 years for developed countries in Europe and the U.S. to be industrialized. However, in Korea, it took only 30 years. The average time for agriculture to be reduced to 5% of the total GDP was 120 years for European countries, including Britain, Germany, France, the Netherlands, and Denmark, 95 years for the U.S., 75 years for Japan, and 30
Table 1-1 Main indices of national accounts
Year (USD in billions)Nominal GDP GNI per capita (USD)
Growth (%)
KRW-USD exchange rate Gross Domestic
Product (GDP) Gross National Income (GNI)
1970 8.1 254 - - 311 1980 63.8 1,645 -1.5 -4.2 607 1990 263.7 6,147 9.2 8.9 708 2000 511.8 10,841 8.5 5.5 1,131 2010 1,265.3 22,170 6.5 7.0 1,156 2018 1,620.0 31,349 2.7 1.0 1,100
years for Korea.
The Korean economy is often said to be on the level of advanced countries, but its agriculture is, in fact, on the level of developing countries. If the relative ratio of agriculture in OECD countries is considered, which was about 1% in 2019, Korea’s figure shows a level that is about two times higher. And the same is true for the relative ratio of the number of farmers to the total population, which was about 2% to 3% in OECD countries.
The ratio of agricultural GDP to total GDP decreased over time, from 25.4% in 1970 to 13.7% in 1980, 7.5% in 1990, and 1.7% in 2018. Concerning the agricultural workforce, the ratio of the number of farmers to total population decreased from 49.5% in 1970 to 32.4% in 1980, 17.1% in 1990, 10.2% in 2000, and to 5.0% in 2018. In this way, the agriculture’s share in GDP was reduced quickly, whereas the percentage of those employed in the agricultural sector was reduced relatively slowly.
Such changes in industrial structure can be considered a decline in agriculture. But these are changes happening in the industrial transition and do not need to be interpreted as deterioration of agriculture.
In most countries, agriculture was the driving force for industrialization during the initial phase of economic development regardless of the type of national system. The ground for capitalism was laid through the dissolution of pre-modern land ownership, which had been the production base for agriculture. And the high levels of growth had been achieved through the supply of cheap labor from rural villages. Many countries, including the U.K. and Japan, went through such transformations.
Agriculture has played significant roles in the Korean economy. First, it has produced and supplied foods for the nation. Korea achieved self-sufficiency in rice production in 1978 through the Green Revolution-a significant achievement
Intr oduction Agricultur al Resour ces and Structur e Agricultur al Industr y Trends by Item Agricultur e-r elated Industries Rur al Communities and Sustainable De velopment Main Issues in Agricultur al and Rur al P olicy
considering that Korea’s staple grain is rice. Although the nation’s self-sufficiency rate has continued to fall since then, a stable supply of foods has been firmly established as agriculture’s vital role.
Second, agriculture contributes to developing other industries. Exchanges in agricultural products and daily necessities help advance commerce and transportation. Besides, crops and livestock products are used as raw materials for different industries.
Third, agriculture preserves the natural environment and national territory. Although synthetic chemicals have caused pollution problems in modern times, agriculture is an environment-friendly industry. Green plants purify the air, while the rural landscape provides amenities. Recently, agriculture’s non-economic functions, such as flood control, water resource development, air purification, and land preservation, gain attention. Also, various evidence shows that the economic values of such “public good” functions are much greater than the amount of agricultural production.
Fourth, agriculture preserves genetic resources. At present, over one million Table 1-2 Changes in agriculture’s status in nation economy
Classification
Relative ratio in GDP Relative ratio of employment Agriculture,
forestry, and
fisheries Agriculture Forestry Fisheries
Agriculture, forestry, and fisheries Agriculture and forestry Fisheries 1970 29.1 25.4 2.0 1.7 50.4 49.5 0.9 1980 16.0 13.7 1.1 1.2 34.0 32.4 1.6 1990 8.7 7.5 0.4 0.8 17.9 17.1 0.8 2000 4.4 3.7 0.2 0.4 10.6 10.2 0.4 2010 2.5 2.0 0.2 0.3 6.6 - -2018 2.0 1.7 0.1 0.2 5.0 -
-Note: The ratios in agriculture/ forestry and in fisheries were not separately calculated after 2009. Source: Bank of Korea, each year, National Accounts.
species live on the earth. Such a diversity of biological species plays a vital role in maintaining natural harmony. Korea, with four distinct seasons, has the
world’s 6th largest genetic resources of plants. Its potential for advancing
bio-industries by utilizing agricultural genetic resources is very high.
Fifth, agriculture promotes economic and social stability. Food is an indispensable element for humans to live. Therefore, a decline in agriculture will soon cause a drop in related industries and make the nation’s economic and social functions unstable. Also, agriculture maintains the population of rural villages by creating jobs. When rural communities decline, urban problems will become more serious. Also, it is a matter of time that rural villages’ traditional culture will disappear. The natural landscape, which provides healing to people, can only be maintained through agriculture, forestry, and fisheries.
References
Korea Population, Health, and Welfare Association, 2020, The 2020 World
Population Report.
Statistics Korea, 2018, The Population and Housing Census. Bank of Korea, each year, National Accounts.
Intr oduction Agricultur al Resour ces and Structur e Agricultur al Industr y Trends by Item Agricultur e-r elated Industries Rur al Communities and Sustainable De velopment Main Issues in Agricultur al and Rur al P olicy
3. Agricultural and Rural Budget
National Total Expenditures and Agricultural/Rural Budget
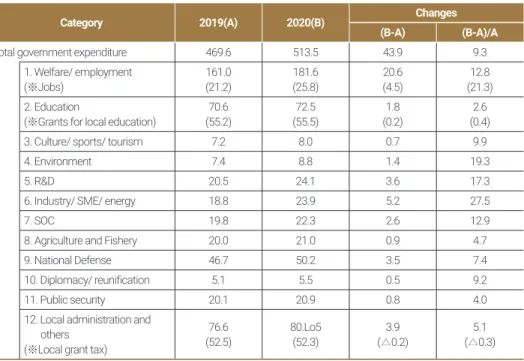
The total national spending in 2020 amounts to KRW 482 trillion, up 1.2% from the previous year. To break down the figure, welfare/employment takes KRW 181.6 trillion, followed by local administration (KRW 80.5 trillion), education (KRW 72.5 trillion), defence (KRW 50.2 trillion), R&D (24.1 trillion), industry/SME/ energy (KRW 23.9 trillion), SOC (KRW 22.3 trillion), agriculture and fishery (KRW 21.0 trillion), public security (KRW 20.9 trillion), environment (KRW 8.8 trillion), culture/sports/tourism (KRW 8.0 trillion), and diplomacy/reunification (KRW
Table 1-3 2020 budget distribution by sector
(in KRW trillions, %, %p)
Category 2019(A) 2020(B) Changes (B-A) (B-A)/A
Total government expenditure 469.6 513.5 43.9 9.3
1. Welfare/ employment
(※Jobs) 161.0(21.2) 181.6(25.8) (4.5)20.6 (21.3)12.8
2. Education
(※Grants for local education) (55.2)70.6 (55.5)72.5 (0.2)1.8 (0.4)2.6
3. Culture/ sports/ tourism 7.2 8.0 0.7 9.9
4. Environment 7.4 8.8 1.4 19.3
5. R&D 20.5 24.1 3.6 17.3
6. Industry/ SME/ energy 18.8 23.9 5.2 27.5
7. SOC 19.8 22.3 2.6 12.9
8. Agriculture and Fishery 20.0 21.0 0.9 4.7
9. National Defense 46.7 50.2 3.5 7.4
10. Diplomacy/ reunification 5.1 5.5 0.5 9.2
11. Public security 20.1 20.9 0.8 4.0
12. Local administration and others
(※Local grant tax)
76.6
5.5 trillion). The nation’s budget for the Ministry of Agriculture, Food, and Rural Affairs (MAFRA) is KRW 15.8 trillion (3.1% of the total), 7.6% up from the previous year. MAFRA’s budget plan for 2020 focuses on the revision of the public-purpose direct payment program, farmers’ income stability, rural life quality, and the formation of frameworks for the agro-food industry in pursuit of innovative growth.
MAFRA’s budget plan and size
The Ministry’s budgets are composed of the general account and five items of the special account.
•General account: The Ministry’s general expenditures, including its operation.
•Special account for rural development tax management (afterward, the rural development account): This account is from rural development tax revenues and set for efficiently implementing related projects. It is composed of the account for special rural taxes and the other for structural improvement. •Special account for innovative city construction (afterward, the innovative
city account): This account is set for implementing projects to move public organizations to rural areas and to build innovative cities.
•Special account for energy projects (afterward, the energy account): This account is set for stabilizing energy prices and implementing energy-related projects.
•Special account for balanced national development (afterward, the balanced development account): This account is set for implementing projects to narrow regional balance gaps and improve the quality of life for all Koreans. It is composed of sub-accounts for regional autonomy, regional support, Jeju
Intr oduction Agricultur al Resour ces and Structur e Agricultur al Industr y Trends by Item Agricultur e-r elated Industries Rur al Communities and Sustainable De velopment Main Issues in Agricultur al and Rur al P olicy
Special City, and Sejeong Special City.
•Special account for grain management (afterward, the grain account): This account is set to control the demand and supply of grains following the Grain Management Act.
MAFRA operates eight funds as follows:
•Fund for agricultural product price stability (afterward, the price stability fund): This fund is set for improving distribution systems and stabilizing prices to expand agro-food export and seek growth in agriculture and food industries.
•Fund for farmland management (afterward, the farmland fund): This fund is set for efficiently managing existing farmland and forming new farmland areas.
•Fund for livestock industry development (afterward, the livestock fund): This fund is for developing the livestock industry by stabilizing prices, improving the industrial structure, raising productivity, and strengthening competitiveness.
•Fund for FTA implementation (afterward, the FTA fund): This fund is set to secure financial resources necessary to help farmers who suffer or may suffer from damages from free trade agreements.
•Fund for direct payments to compensate for income reduction (afterward, the direct payment fund):This fund is for stabilizing farm households’ income when rice prices decline.
•Fund for public function improvement in rural areas (afterward, the public function fund): This fund, partly transferred from the direct payment fund, is newly set in 2020 for improving rural areas’ pubic functions.
This fund is to stabilize farming businesses through the government’s compensation for disasters through reinsurance.
•Fund for grain security clearance (afterward, the security clearance fund): This fund is set to manage the principal and interest repayment concerning grain securities issued for grain management.
Figure 1-3 MAFRA’s account and fund flows
(in KRW 100millions)
Fund for public fund management (Finance Ministry) R 7,813 T 6,157 T : Transfer R : Repay T 4,000 T 16,073 T 26,274 T 1,500 T 1,567 1,946T R 13,368 R 12 R 5,500 Fund for public
function improvement in rural areas Special account for
balanced national development
Special account energy projects
Special account for innovative city
construction Special account for grain management Special accounts
rural development tax management General accounts
Fund for rural disaster insurance
Fund for FTA implementation
Fund for livestock industry development
Fund for grain security clearance Fund for farmland management
Fund for stabilizing agricultural product prices 26,314
Revenue : 200 Expenditure : 6,819
Revenue : 429
Expenditure : 269 Expenditure : -Revenue : -Revenue : 21,065 Expenditure : 21,065
Revenue : 111,589 / Expenditure : 95,147 Revenue : 205 / Expenditure : 75,007
4,988 5,999 11,235 13,603 32,624 24,808 Fund for direct payments -T 1,193T 1,193
Note: All numbers are total numbers.
Intr oduction Agricultur al Resour ces and Structur e Agricultur al Industr y Trends by Item Agricultur e-r elated Industries Rur al Communities and Sustainable De velopment Main Issues in Agricultur al and Rur al P olicy
MAFRA’s finance (budget), including affiliated organizations1) and funds2),
increased 1.5 times from 2005 (KRW 12.4 trillion) to 2020 (KRW 19.1 trillion), and the annual average growth for a recent decade is 2.9%. The finance size has continuously declined from 8.3% in 2005 to 4.2% in 2020. The Ministry’s budget, excluding affiliated organizations, posted a relatively small increase from KRW 10.3 trillion in 2005 to KRW 15.8 trillion in 2020.
Financial input in the agricultural sector has consistently expanded due to the opening of the agricultural produce market and aggravating conditions for farming businesses. The government executed the rural structural improvement program to prepare for the Uruguay Round in 1992 and put in KRW 82
1) The Rural Development Administration and the Korea Forest Service.
2) The price stability fund, the livestock fund, the farmland fund, the rice income fund, the FTA fund, the disaster
Figure 1-4 MAFRA’s budget and its share to national budget
(in KRW 100 millions) 250,000 200,000 150,000 100,000 50,000 0 7.0% 6.5% 6.0% 5.5% 5.0% 4.5% 4.0% 2005 2006 2007 2008 2009 2010 2011 2012 2013 2014 2015 2016 2017 2018 2019 2020
Budget for agriculture, forestry, and fisheries Budget for MAFRA MAFRA’s budget (%) to national budget
trillion (including KRW 10 trillion from the Ministry and KRW 13 trillion from local governments). The investment plan at the time focused on renovating production bases, improving distribution platforms, and upgrading facilities. KRW 119 trillion in total, since then, was invested between 2004 and 2013 for balanced development for rural and urban communities.
The sector of farm household income stability takes the largest portion of the Ministry’s budget (27.8% in 2020), followed by grain management and distribution reforms (23.0% in 2020) and the sectors for the innovative growth and competitiveness enhancement (21.5% in 2020). The ratio of competitiveness enhancement was high in the late 2000s. However, recently, the proportion of farm household income stability and grain management has increased, indicating that the budget for direct payments has expanded.
Table 1-4 Budget share by sector (%)
Category 2011 2012 2013 2014 2015 2016 2017 2018 2019 2020 Innovative growth 17.3 20.1 22.7 22.8 21.2 21.1 19.3 20.1 20.9 21.5 Farm household income stability 18.7 14.5 15.5 17 17.8 20.9 25.8 24.3 21.1 27.8 Rural welfare 2.8 2.7 2.9 3.1 3.4 3.0 3.0 11.4 11.9 7.6 Rural development 9.5 9.0 9.3 8.9 8.6 8.7 8.8 Grain management 10.7 10.6 10.7 11.2 11.2 11.1 9.8 22.8 24.7 23.0 Distribution reform 12.9 13 15.2 13.5 13.1 11.6 11.5 Renovation against disasters 18.9 21.7 15.4 14.8 15.4 15 13.8 13.6 13.6 12.2 Food industry 5.3 4.9 5.4 5.7 6.0 5.7 5.2 4.8 4.7 4.8 Other expenses 3.8 3.5 2.9 3.0 3.2 2.8 2.9 0.2 0.2 0.2
Note: The innovative growth sector includes agricultural competitiveness enhancement, and the renovation against disasters includes production base renovation.
Intr oduction Agricultur al Resour ces and Structur e Agricultur al Industr y Trends by Item Agricultur e-r elated Industries Rur al Communities and Sustainable De velopment Main Issues in Agricultur al and Rur al P olicy
Agriculture and Rural Budget Status in 2020
Directions
The agriculture and rural budget for 2020 focuses on rural reforms for humans and the environment by investing in the social and public values of rural areas and the innovative growth of the agro-food industry.
First, the budget plan intends to restructure the direct payment program and stabilize farmers’ income and business management.
•Targeting balanced crop production by reforming the existing direct payment scheme focused rice to support other crops.
•Advancing the demand and supply forecast system for crop producers. •Expanding insurance covering agricultural disasters and enhancing SOC
investment to prevent disasters.
Second, the budget plan aims to improve rural life quality for inclusive growth in rural communities.
•Revitalizing the local economy by expanding local food consumption and enhancing social farming by providing rehabilitation services.
•Improving rural life quality by using rural development programs and planning for regional development phase-by-phase through effective rural space planning.
•Spreading the healthy diet culture and working for animal welfare.
Third, the budget plan targets executing projects for innovative growth in the agro-food industry.
•Creating innovative valleys for smart farming and advancing smart farming technologies.
•Supporting youth start-ups and creating new jobs.
•Building a growth base for new industries with potential, such as insects/ microorganisms and foodservice sectors.
Fourth, the budget plan is to supply safe food for the public and improve the industrial environment.
•Strengthening safety measures in food production and preventing the distribution of inappropriate products.
•Resolving livestock excretion and foul smell problems and improving the livestock farming conditions to prevent animal diseases.
Budget Expenditure by Sector
The Agriculture Ministry’s total expenditure (budget and fund operation) in 2020 amounts to KRW 15.78 trillion, 7.6% up from the previous year (KRW 14.66 trillion). Its general budget expenditure posts KRW 7.83 trillion, down 17.4% year-on-year, while its general fund expenditure is KRW 7.94 trillion, up 53.3% year-on-year.
By sector, farm household income stability, innovative growth, food, and grain management sectors increased by 42.1%, 10,9%, 8,5%, and 0.2%, respectively. On the other hand, rural welfare and anti-disaster renovation sectors decreased by 31.1% and 3.3%, respectively.
Table 1-5 MAFRA’s total expenditure in 2020 (in KRW hundred millions)
Category 2019 Budget (A) 2020 budget (B) Change(B-A) %
Budget + fund (total expenditure) 14,659.6 15,774.3 1,114.7 7.6
Budget 9,475.7 7,829.1 △1,646.6 △17.4
Intr oduction Agricultur al Resour ces and Structur e Agricultur al Industr y Trends by Item Agricultur e-r elated Industries Rur al Communities and Sustainable De velopment Main Issues in Agricultur al and Rur al P olicy
References
Agro- food Policy Management Center, 2020, The Report on Agri-food
Programs, KREI.
MAFRA, 2019, The Overview of 2020 Budget and Fund Operation. Table 1-6 Details of the MAFRA’s total expenditure in 2020
(in KRW 100 millions) Category budget 2019 (A) 2020 budget (B) YoY % % (B-A) % Total expenditure 146,596 100.0 157,743 100.0 11,147 7.6 Section Implementation expenditure 142,321 97.1 153,284 97.2 10,963 7.7 Agriculture 135,048 92.1 145,379 92.2 10,331 7.6 • Innovative growth 30,587 20.9 33,908 21.5 3,321 10.9
• Farm household income 30,859 21.1 43,858 27.8 12,999 42.1
• Rural welfare/ development 17,389 11.9 11,976 7.6 △5,4131) △31.1
• Grain mgmt/ distribution reform 36,249 24.7 36,324 23.0 75 0.2
• Renovation against disasters 19,964 13.6 19,314 12.2 △6502) △3.3
Food 6,924 4.7 7,515 4.8 591 8.5
Other expenditure 349 0.2 390 0.2 41 11.7
Basic expense 4,275 2.9 4,459 2.8 184 4.3
Note: Decrease from the previous year expanded due to projects transferred to provinces.
1) Rural projects transferred to provinces (KRW 565.5 billion), 2) Production base renovation projects transferred to provinces (KRW 178.8 billion)
4. The Past and Present of Korea’s Agricultural Policy
As World War II ended in 1945, Korea was liberated from Japanese colonial rule. However, amid the conflict between communism and capitalism, two different governments were established in the north and the south in 1948. The Korean War broke out in 1950, and North Korea (The Democratic People’s Republic of Korea, DPRK) and South Korea (The Republic of Korea, ROK) confronted each other at the forefront of the Cold War Era. Since then, the two Koreas have walked different political and economic paths. This section explores past and current agricultural policies of the Republic of Korea (afterward, Korea). Korea’s agricultural policies went through significant changes over time. Before its industrialization (from government establishment to the 1950s), the nation was an agrarian society, with an industrial structure centered on agriculture. Agriculture, as a major industry, provided food and jobs. However, agricultural productivity was low, and the nation relied on food aids from the U.S. During the industrialization period (until the mid-1980s), the agricultural sector provided a cheap labor force for the manufacturing industry and achieved food self-sufficiency through the Green Revolution. Besides, it started the Saemaul Movement to put more energy into developing rural areas.In the late 1980s, the major characteristics of Korean agriculture were globalization and agricultural reforms. Its economy followed the global trend of free trade, and the agricultural sector had to open its market to the world. The government implemented agricultural reforms to reorganize systems and policies for market-oriented frameworks.
Intr oduction Agricultur al Resour ces and Structur e Agricultur al Industr y Trends by Item Agricultur e-r elated Industries Rur al Communities and Sustainable De velopment Main Issues in Agricultur al and Rur al P olicy
competitiveness and raising rural sustainability. Significant changes at home and abroad in the 2010s included low growth, the demographic cliff, the 4th industrial revolution, climate change, an increase in rural villages going through population aging and decline, and the public’s pursuit of various values. Amid these changes, problems in the growth-oriented agricultural policy were criticized, and policies to secure agricultural and rural sustainability became important.
Agricultural Policy before Industrialization (up to the 1950s)
Establishing Smallholding through Land Reform
The Korean society liberated from Japanese colonial rule in 1945 held an industrial structure centered on agriculture. It was a typical agrarian society, with around 80% of the total population working for farming.
The characteristics of agriculture at the time were the broad relationship between landowners and tenant farmers and the small farming system. Around two-thirds of lands were tenanted farms. 85% of farmers did farming on tenanted farms, regardless of their size. They worked hard on small land smaller than 1 ha. Suffering from low productivity and expensive farm rent, they could not produce food enough to feed their families.
Against this backdrop, the newly independent government’s top agenda was farmland reform, which would stabilize farmers’ livelihood and improve agricultural productivity.
The 1st Constitution of Korea confirmed on land reform by specifying that farmland should be distributed to farmers. The land reform kicked off in early 1950 after the Land Reform Act was established in June 1949. Farmlands that were not cultivated by their owners and those larger than 3 ha were subject to
distribution. The government forcibly purchased them and distributed them to small-income farmers and farmworkers.
The area distributed through the land reform amounted to 585,000 ha. Also, the area sold off by landowners was 713,000 ha. In total, 60% of the total lands in Korea were transferred to farmers through land reform.
The land reform intended to establish the smallholding system, guaranteeing farmers’ minimum income. Well-educated children from farm households became an excellent labor force, serving as the engine for national growth. Besides, the collapse of the landed class removed the barrier to Korea’s capitalism, which had significance in history.
Food Insufficiency and Grain Import
At the time, agricultural productivity in Korea was very low. Food crops’ productivity was around 1/4 to 1/3 of today’s, and rice production per 10a was only 160kg. Low technologies, insufficient infrastructures, and lack of production elements, such as fertilizers, chemicals, and farming machines, were the reasons behind low productivity.
Additionally, the Korean War for three years worsened food insufficiency. Therefore, the government focused on its agricultural policy to secure grains and solving food insufficiency. It introduced the grain purchasing system and made a plan to increase food production. The U.S. offered a large amount of crop aids from 1956 to 1964 in accordance with the U.S. Public Law 480.
The crop aid from the U.S. helped considerably to resolve food insufficiency. However, it decreased grain prices and farmers’ income, leading to a decline in local grain production in the long term. Especially, with the collapse of the production base for wheat, whose price competitiveness was weak, Korea had to import the crop continuously even after the U.S. aid ended.
Intr oduction Agricultur al Resour ces and Structur e Agricultur al Industr y Trends by Item Agricultur e-r elated Industries Rur al Communities and Sustainable De velopment Main Issues in Agricultur al and Rur al P olicy
Agricultural Policy during Industrialization
Production Increase in Staple Grains The military regime took power in 1961 and tried to earn popularity through economic development. As its biggest concern was to resolve livelihood problems before economic growth, the government put in public funds in 1961 to clear off high-interest private loans. Besides, it established the Price Main tenance of Agricultural Pro
ducts Act to guarantee the production cost of agricultural products.
The government also integrated the Agricultural Bank and agricultural cooperatives in August 1961 to establish the National Agricultural Cooperative Federation for financing, marketing, and agricultural extension. Although the new organization contributed to promoting agricultural financing programs and extension projects, some critics say it was under the government’s direct control without autonomy. The government established the Rural Development Administration in 1962 and set the framework for agricultural extension projects for farming education and livelihood improvement by reshuffling local administrative organizations.
The 1st 5-year economic development plan, launched in 1962, was the first
comprehensive economic development program in Korea’s history. It was a Rice testing ground for a new variety, Tongil-rice
starting point of Korea’s high growth for the next 30 years of modernization. Its target in agriculture was to achieve food self-sufficiency through agricultural production increases. To fulfill the goal, the government carried out land reclamation projects for farmland expansion, land consolidation and water system projects for production base rearrangement, and extension projects for productivity increase.
The 2nd 5-year economic development plan, launched in 1967, aimed to
execute large-scale agricultural development programs for food production increases and implemented measures to support prices for rice and other crops-keeping rice prices high and buying barley at high prices from farmers while selling it at low prices to consumers. Besides, the government intended to develop agriculture and manufacturing simultaneously by processing local agricultural produce for domestic and overseas markets but failed to achieve a substantial outcome.
The national economy achieved high growth of 10% per year during the 1st and 2nd economic plans. However, the focus on manufacturing expanded gaps between agriculture and manufacturing and between rural areas and cities, causing massive rural-to-urban migration. As a result, the rural population peaked at 16 million (53% of the total population) in 1967 and started to decrease.
Green Revolution and the Saemaul Movement
As the rapid economic growth expanded the gap between urban and rural areas, the government’s economic target changed to balancing growth and stability. It implemented various programs for balanced development by investing in agriculture and fisheries. Still, its focus was on increasing food production. To fulfill the target, the government executed large-scale rural development projects and pursued developing new rice varieties, such as Tongil,
Intr oduction Agricultur al Resour ces and Structur e Agricultur al Industr y Trends by Item Agricultur e-r elated Industries Rur al Communities and Sustainable De velopment Main Issues in Agricultur al and Rur al P olicy
mechanizing farming works, and supporting agricultural product prices.
In particular, Tongil, developed in 1971 in cooperation with the International Rice Research Institute (IRRI), substantially expanded rice production. New technologies, such as hotbeds, early cultivation, top dressing, and pest control, contributed significantly to increasing general rice varieties’ yield per
unit area. As a result, rice production sharply grew from 3.5 million tons in the late 1960s to 5 million tons in the late 1970s.
The Saemaul Movement, launched by the former President Park Jung-hee in 1970, influenced rural communities considerably. With an emphasis on diligence, self-help, and collaboration, the national drive started as a movement to improve the village environment. Using materials provided by the government, such as cement and rebars, farmers broadened village roads, renovated roofs, built town halls, and cleaned up small streams.
The national campaign encouraged farmers to resolve for a better living and transformed rural villages remarkably. Although it was a government-led movement, it significantly changed the rural landscape and gained global attention as an ideal rural development model.