Large step-phase measurement by a
reduced-phase triple-illumination interferometer
Behnam Tayebi,1 Mohammad Reza Jafarfard,1 Farnaz Sharif,2 Young Sik Song,1 Dongsoo Har,3 and Dug Young Kim1,*
1Department of Physics, Yonsei University, 50 Yonsei-ro, Seodaemun-gu, Seoul 120-749, South Korea 2Center for Functional Connectomics, Korea Institute of Science and Technology, Seoul 136-791, South Korea 3The Cho Chun Shik Gradate school for Green Transportation, Korea Advanced Institute of Science and Technology
(KAIST), 335 Gwahk-ro, Yueong-gu, Daejeon 305-701, South Korea *dykim1@yonsei.ac.kr
Abstract: We present a reduced-phase triple-illumination interferometer
(RPTII) as a novel single-shot technique to increase the precision of dual-illumination optical phase unwrapping techniques. The technique employs two measurement ranges to record both low-precision unwrapped and high-precision wrapped phases. To unwrap the high-high-precision phase, a hierarchical optical phase unwrapping algorithm is used with the low-precision unwrapped phase. The feasibility of this technique is demonstrated by measuring a stepped object with a height 2100 times greater than the wavelength of the source. The phase is reconstructed without applying any numerical unwrapping algorithms, and its noise level is decreased by a factor of ten.
©2015 Optical Society of America
OCIS codes: (110.5086) Phase unwrapping; (090.5694) Real-time holography; (120.5050)
Phase measurement.
References and links
1. P. Ferraro, D. Alferi, S. De Nicola, L. De Petrocellis, A. Finizio, and G. Pierattini, “Quantitative phase-contrast microscopy by a lateral shear approach to digital holographic image reconstruction,” Opt. Lett. 31(10), 1405– 1407 (2006).
2. G. Coppola, P. Ferraro, M. Iodice, and S. De Nicola, “Method for measuring the refractive index and the thickness of transparent plates with a lateral-shear, wavelength-scanning interferometer,” Appl. Opt. 42(19), 3882–3887 (2003).
3. H. V. Pham, C. Edwards, L. L. Goddard, and G. Popescu, “Fast phase reconstruction in white light diffraction phase microscopy,” Appl. Opt. 52(1), A97–A101 (2013).
4. Y. Park, W. Choi, Z. Yaqoob, R. Dasari, K. Badizadegan, and M. S. Feld, “Speckle-field digital holographic microscopy,” Opt. Express 17(15), 12285–12292 (2009).
5. D. Khodadad, E. Hällstig, and M. Sjödahl, “Dual-wavelength digital holographic shape measurement using speckle movements and phase gradients,” Opt. Eng. 52(10), 101912 (2013).
6. S. Lee, J. Y. Lee, W. Yang, and D. Y. Kim, “Autofocusing and edge detection schemes in cell volume measurements with quantitative phase microscopy,” Opt. Express 17(8), 6476–6486 (2009).
7. G. Popescu, T. Ikeda, R. R. Dasari, and M. S. Feld, “Diffraction phase microscopy for quantifying cell structure and dynamics,” Opt. Lett. 31(6), 775–777 (2006).
8. P. Bergström, D. Khodadad, E. Hällstig, and M. Sjödahl, “Dual-wavelength digital holography: single-shot shape evaluation using speckle displacements and regularization,” Appl. Opt. 53(1), 123–131 (2014). 9. G. Rajshekhar, B. Bhaduri, C. Edwards, R. Zhou, L. L. Goddard, and G. Popescu, “Nanoscale topography and
spatial light modulator characterization using wide-field quantitative phase imaging,” Opt. Express 22(3), 3432– 3438 (2014).
10. M. R. Jafarfard, B. Tayebi, S. Lee, Y.-S. Bae, and D. Y. Kim, “Optimum phase shift for quantitative phase microscopy in volume measurement,” J. Opt. Soc. Am. A 31(11), 2429–2436 (2014).
11. T. Colomb, S. Krivec, H. Hutter, A. A. Akatay, N. Pavillon, F. Montfort, E. Cuche, J. Kühn, C. Depeursinge, and Y. Emery, “Digital holographic reflectometry,” Opt. Express 18(4), 3719–3731 (2010).
12. V. Bianco, M. Paturzo, and P. Ferraro, “Spatio-temporal scanning modality for synthesizing interferograms and digital holograms,” Opt. Express 22(19), 22328–22339 (2014).
13. Y. Sung, N. Lue, B. Hamza, J. Martel, D. Irimia, R. R. Dasari, W. Choi, Z. Yaqoob, and P. So, “Three-dimensional holographic refractive-index measurement of continuously flowing cells in a microfluidic channel,” Phys. Rev. A 1(1), 014002 (2014).
14. C. Falldorf, S. Huferath-von Luepke, C. von Kopylow, and R. B. Bergmann, “Reduction of speckle noise in multiwavelength contouring,” Appl. Opt. 51(34), 8211–8215 (2012).
15. H. Y. Huang, L. Tian, Z. Zhang, Y. Liu, Z. Chen, and G. Barbastathis, “Path-independent phase unwrapping using phase gradient and total-variation (TV) denoising,” Opt. Express 20(13), 14075–14089 (2012). 16. J.-F. Weng and Y.-L. Lo, “Integration of robust filters and phase unwrapping algorithms for image
reconstruction of objects containing height discontinuities,” Opt. Express 20(10), 10896–10920 (2012). 17. Y. Wang, S. Yang, and X. Gou, “Modified Fourier transform method for 3D profile measurement without phase
unwrapping,” Opt. Lett. 35(5), 790–792 (2010).
18. H. Zhang, H. Su, and X. Y. Su, “Automatic phase unwrapping algorithm for reconstruction of three-dimensional objects,” Opt. Lett. 32(21), 3119–3121 (2007).
19. J. Gass, A. Dakoff, and M. K. Kim, “Phase imaging without 2π ambiguity by multiwavelength digital holography,” Opt. Lett. 28(13), 1141–1143 (2003).
20. J. Kühn, T. Colomb, F. Montfort, F. Charrière, Y. Emery, E. Cuche, P. Marquet, and C. Depeursinge, “Real-time dual-wavelength digital holographic microscopy with a single hologram acquisition,” Opt. Express 15(12), 7231–7242 (2007).
21. P. Ferraro, L. Miccio, S. Grilli, M. Paturzo, S. De Nicola, A. Finizio, R. Osellame, and P. Laporta, “Quantitative Phase Microscopy of microstructures with extended measurement range and correction of chromatic aberrations by multiwavelength digital holography,” Opt. Express 15(22), 14591–14600 (2007).
22. M. R. Jafarfard, S. Moon, B. Tayebi, and D. Y. Kim, “Dual-wavelength diffraction phase microscopy for simultaneous measurement of refractive index and thickness,” Opt. Lett. 39(10), 2908–2911 (2014).
23. J. Min, B. Yao, P. Gao, R. Guo, B. Ma, J. Zheng, M. Lei, S. Yan, D. Dan, T. Duan, Y. Yang, and T. Ye, “Dual-wavelength slightly off-axis digital holographic microscopy,” Appl. Opt. 51(2), 191–196 (2012).
24. A. Wada, M. Kato, and Y. Ishii, “Large step-height measurements using multiple-wavelength holographic interferometry with tunable laser diodes,” J. Opt. Soc. Am. A 25(12), 3013–3020 (2008).
25. I. Yamaguchi, J.-i. Kato, and S. Ohta, “Surface shape measurement by phase-shifting digital holography,” Opt. Rev. 8(2), 85–89 (2001).
26. T. Tahara, A. Maeda, Y. Awatsuji, T. Kakue, P. Xia, K. Nishio, S. Ura, T. Kubota, and O. Matoba, “Single-shot dual-illumination phase unwrapping using a single wavelength,” Opt. Lett. 37(19), 4002–4004 (2012). 27. B. Tayebi, M. R. Jafarfard, F. Sharif, Y. S. Bae, S. H. H. Shokuh, and D. Y. Kim, “Reduced-phase
dual-illumination interferometer for measuring large stepped objects,” Opt. Lett. 39(19), 5740–5743 (2014). 28. C. J. Mann, P. R. Bingham, V. C. Paquit, and K. W. Tobin, “Quantitative phase imaging by three-wavelength
digital holography,” Opt. Express 16(13), 9753–9764 (2008).
29. P. Picart, E. Moisson, and D. Mounier, “Twin-sensitivity measurement by spatial multiplexing of digitally recorded holograms,” Appl. Opt. 42(11), 1947–1957 (2003).
30. P. Memmolo, V. Bianco, M. Paturzo, B. Javidi, P. A. Netti, and P. Ferraro, “Encoding multiple holograms for speckle-noise reduction in optical display,” Opt. Express 22(21), 25768–25775 (2014).
31. M. Paturzo, P. Memmolo, A. Tulino, A. Finizio, and P. Ferraro, “Investigation of angular multiplexing and de-multiplexing of digital holograms recorded in microscope configuration,” Opt. Express 17(11), 8709–8718 (2009).
32. M. Paturzo, P. Memmolo, L. Miccio, A. Finizio, P. Ferraro, A. Tulino, and B. Javidi, “Numerical multiplexing and demultiplexing of digital holographic information for remote reconstruction in amplitude and phase,” Opt. Lett. 33(22), 2629–2631 (2008).
33. C. Wagner, W. Osten, and S. Seebacher, “Direct shape measurement by digital wavefront reconstruction and multiwavelength contouring,” Opt. Eng. 39(1), 79–85 (2000).
1. Introduction
Quantitative phase imaging (QPI) is of fundamental significance for industrial applications as a high-accuracy, noncontact, label-free, 3D imaging technique [1–15]. There are numerous phase retrieval techniques for various industrial applications; however, 2π-ambiguity is a common problem in all of the QPI methods. The ambiguity problem arises whenever the object height is greater than the wavelength of the light source.
Methods for remedying the phase ambiguity problem are typically classified into three categories. The first method concerns numerical algorithms that solve phase jumps less than 2π, and does not require any more physical components to unwrap the phase. However, such methods are usually time consuming and cannot unwrap phase jumps greater than 2π [16–18]. The second method concerns dual-wavelength phase unwrapping techniques for measuring stepped objects, along with reducing the phase-unwrapping running time. Since these methods use various wavelengths, the alignment of the beams on the optical axes of the system and chromatic aberration generate inevitable sources of errors. Furthermore, the synthetic wavelength of the imaging system limits the maximum measurement range [19–24]. Dual-illumination QPI is the third phase imaging technique that has recently been demonstrated to unwrap large stepped phases. In this single wavelength method, two independent interferograms with different illumination angles are recorded to reconstruct an unwrapped phase [25]. Despite this advantage, single-shot imaging is difficult and requires a
complex setup [26]. The reduced-phase dual-illumination interferometer is categorized in this group [27] and it features the advantages of the dual-illumination technique in addition to having a simple setup. Using this last method, the unwrapped phase can be reconstructed by calculating the phase difference of the different illumination beams.
Growing uncertainty with the increasing measurement range is a common problem in all optical phase unwrapping techniques mentioned above. Accordingly, the multiple-wavelength method has recently been developed to increase the phase precision to that of the single-wavelength methods. In this method, the precision is preserved by the use of intermediate synthetic wavelength steps generated from the three wavelengths, in concert with the use of the hierarchical optical phase unwrapping technique [28]. It has been demonstrated that multiplexing and de-multiplexing can be implemented easily in the frequency-domain in single shot digital holography techniques [29–32].
In this study, we present a reduced-phase triple-illumination interferometer (RPTII) to increase the precision of dual-illumination unwrapping techniques. The proposed unwrapping technique is based on the simultaneous recording of the phase of the illuminating beams. Different illuminating angles give rise to a different spatial frequency, measurement range, and precision for each reconstructed phase. The information carried by the different spatial frequencies can be separated in the Fourier domain, which makes single-shot imaging possible. Furthermore, the higher measurement range reconstructs a low-precision unambiguous phase, while the lower measurement range reconstructs a high-precision ambiguous phase. At this stage, the unambiguous phase is compared with the ambiguous phase by the hierarchical optical phase unwrapping algorithm to unwrap the high-precision phase. The feasibility of this system is demonstrated for an object with both small and large steps.
2. Reduced-phase triple-illumination interferometer
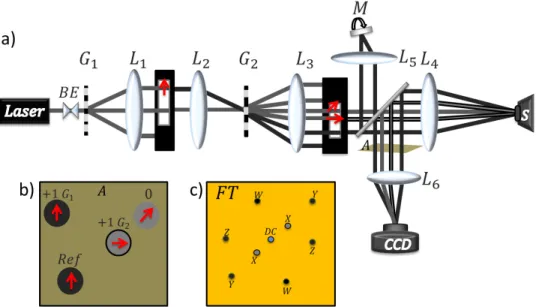
The schematic diagram of our proposed RPTII setup is shown in Fig. 1(a). A grating is placed in front of a collimated laser to produce multiple diffracted beams along the x-axis of the transverse coordinate system. A lens L1 of focal length f1 is placed at a distance f1 from the grating. Another lens L2 of focal length f2 is used to form a magnifying 4f system; the Fourier plane of L1 is located at the back focal plane of L2 such that the distance between the two lenses is (f1 + f2). Another grating is placed at the focal plane of L2 to make a two dimension multiple diffracted beams in the transverse coordinate system . The second grating makes an angle of 45° with respect to the first grating. A lens L3 of focal length f3 is placed at a distance f3 from the second grating. Two masks at the focal planes of L1 and L3 select the zeroth- and first-order diffracted beams from the first and second grating, whereas other diffracted beams are blocked by the mask. One polarization plate is located at the focal plane of L1, and two polarization plates are located at the focal plane of L3 to avoid unwanted interference between the beams. The polarization states of the first-order beams of both gratings are perpendicular, and the zeroth-order beam does not have an orthogonal polarization state with both beams (see Fig. 1). A lens L4 with focal length f4 is placed at the distance f3 + f4 from L3 to form a different magnification. Therefore, the first grating and sample are separated by 2(f1 + f2 ) + 2(f3 + f4 ).
The lens systems L1-L2 and L3-L4 determine the angle between the first-order beam of the first grating and the sample plane. The lens system L3-L4 determines the angle of incidence of the first-order beam of the second grating at the sample plane. The zeroth-order beam illuminates the sample along the optical axis of the lenses. The first-order beams of the first and second grating illuminate the sample with angles of θ and θ′, respectively.
Fig. 1. (a) Reduced-phase triple-illumination interferometer (RPTII). (b) Position of the beams in plane A. (c) Intensity plot of 2D Fourier transform of the interferogram obtained by a charge-coupled device (CCD). G1 and G2 show first and second grating, M is mirror and the
red arrows indicate the polarization state of each beam.
A reflective sample is placed at the front focal plane of L4. As shown in Fig. 1, another lens L5 focuses one of the beams of the beam splitter on a mirror in order to have a reference beam. To avoid unwanted interference components at the Fourier domain, the selected beam must have the same polarization state with the first-order beam of the first grating. Another lens L6 is placed after the beam splitter to combine the three sample beams with the reference beam to form an interference pattern on the CCD plane. The modulation frequencies of the off- axis interferogram on the CCD can be controlled by changing the magnifications of the lens system and tilting the mirror. Because of the triple beams used in our reduced-phase triple-illumination interferometer (RPTII), the experimental setup is little more complicated than those of dual-wavelength digital holographic microscopy [19–24] or the reduced-phase dual-illumination interferometer (RPDII) [27]. However, complexity in experimental setup and difficulties in optical alignments associated with the third beam in our RPDII is necessary and inevitable in order to reduce measurement noise.
The intensity of the interference pattern formed by the three beams and the reference beam at the CCD plane can be expressed as:
( )
( )
( )
(
)
( )(
)
2 2 2 2 2 ' ' 0 1 2 0 1 2 0 ' ' 0 2 ' ' 2 0 2 0-2 ' 0 1 2 . 4 4.cos( , ) 2 . .cos( , .cos
4 ) 2 . . cos( , . 1 cos ) 4 2 . . .cos( , 1- cos p s p s p p s p s p p s p O r r r b p p x r y b s p p b p x y p s p s x I E E E E E E E E E E q x h x y E E q y h x y E E q x q y h x y E E q x h x y π ϕ π θ λ λ π ϕ θ ϕ λ π θ ϕ λ + + + + + = + + + = + + + + + + + + + + − + − + + + + 0-1) b s (1)
where Erp, E0s + p, E1s, and E2′p are the amplitudes of the electric fields for the reference, zeroth-order, and first-order of the second grating, and the first-order of the first grating, respectively. The indices S and P show different polarization states for each beam. The qx, qy, and qxꞌ are the spatial frequencies of the off-axis interferometer. θ and θꞌ are the angles between both first-order incident beams and the zeroth-order beam on the sample plane,
respectively. φ0b, φ2pb, φ0-1sb, and φ0-2pb are the background phases of the different illumination beams that must be measured separately without the sample.
The Fourier transform of the 2D interference data separates different spatial frequencies in the frequency domain. Figure 1(b) shows the positions of the beams on the plane “A” illustrated by a green color in Fig. 1(a); each pair of the indicated beams make interference pattern at CCD according to their polarization state. The position of the phase directions in Fourier domain are related to Fig. 1(b) as follow: A pair of spots labeled with “W” are the interference of the Ref. and + 1G1 beams, A pair of spots labeled with “X” show the interference of 0th and + 1G2 beams. A pair of spots labeled with “Y” represents the interference of Ref. and 0th beams. Two spots labeled with “Z” show the interference of beams 0th and beam + 1G1.To extract different phase components, the real image components of the different illumination directions are selected in the frequency domain. The extracted phases can be written as [25]:
0( , )x y O( , )x y ϕ =ϕ (2a) 0 1( , )x y O( , ) (1 cos )x y ϕ− =ϕ − θ (2b) ' 0 2( , )x y O( , ) (1 cos )x y ϕ− =ϕ − θ (2c)
where φo, φ0, φ0-1, and φ0-2 are the object phase, the phase of the zeroth-order beams, the phase difference of the zeroth-order beam and the beam with incident angle θ, and the phase difference of the zeroth-order beam and the beam with incident angle θꞌ, respectively. These phase differences are the object phases that are reduced by factors hereafter referred to as phase reduction factors. The phase reduction factor determines the measurement range of the interferometer; the reconstructed phase is not wrapped in this range. The inverse of the reduction factor magnifies the uncertainty for the larger measurement range.
Three incident beams with different illumination directions and polarization states make two different measurement ranges, which are determined by the angles between the incident beams. The incident angle between the two beams can be adjusted by changing the grating pitches or the magnification of the 4f systems. The phase reduction factors for the interferometer from Eq. (2b) and (2c) can be written as:
1 (1 cos )
R = − θ (3a)
' 2 (1 cos )
R = − θ (3b)
where R1 is less than R2; therefore, the first measurement range is larger than the second one. If the sample height is less than the first measurement range and more than the second one, the extracted phases from Eq. (2b) and (2c) are unwrapped and wrapped, respectively. However, the precision of the reconstructed phase by the wrapped phase is higher than that of the unwrapped phase. In virtue of having higher precision, the wrapped phase is unwrapped by the unwrapped phase using hierarchical optical phase unwrapping algorithm.
3. Hierarchical optical phase unwrapping
The hierarchical optical phase unwrapping method was employed to increase the precision of the unwrapped phase in the multiple-wavelength methods [28]. In the absence of noise, the jumps of a single-wavelength phase can be solved by comparing it with the dual-wavelength unwrapped phase. However, in the presence of noise, the source wavelengths must satisfy the following equation for applying the hierarchical optical phase unwrapping algorithm [33]:
1(1 4 1) 4
K+ εK+ K εK
Λ − ≥ Λ (4)
where ɅK + 1 is the synthetic wavelength and εK + 1 is its associated noise; ɅK is the larger synthetic wavelength and εK is its associated noise. The condition for selecting the intermediate angle in the multiple-illumination method is similar to the above condition for
multiple-wavelength method. The condition depends on the noise level of each step and can be expressed as: 1 1 1 (1 4 ) 1 4 K K K K R + − ε + ≥R ε (5)
where RK is the phase reduction factor of the Kth step, and εK is the noise of the Kth measurement range. In the presence of noise, the phase reduction factor at each step is restricted by the phase reduction factor and noise level of the previous step. At this stage, the unambiguous phase is employed to unwrap the ambiguous phase by recognizing of the interference order. The correct integer is determined as [26]:
'
(2 (1 cos( )) 0.5)
N = floor Δ −z θ + (6)
where ∆z is the phase difference between the unambiguous phase and the ambiguous phase. The integer must be added to the original ambiguous phase by:
1 2(1 cos( ))' K K N z z θ + = + − (7)
The ambiguities of the larger angle phase are unwrapped, and the finale phase precision is improved to the precision of the larger angle phase.
4. Experimental results
We performed experiments using a diode laser operating at wavelength of λ = 532 nm. The periods of the first and second grating were 9.1 μm and 14.3 μm, respectively. The magnifications of the first and second 4f systems were 0.5 and 3, respectively. As a result, the angles θ and θꞌ were 0.7° and 2.2°, respectively, in front of the sample (paraxial approximation). The tolerance in the groove spacing of the grating used in our experiment was 0.05%; therefore, the tolerance in the incident angle was less than 0.1%.
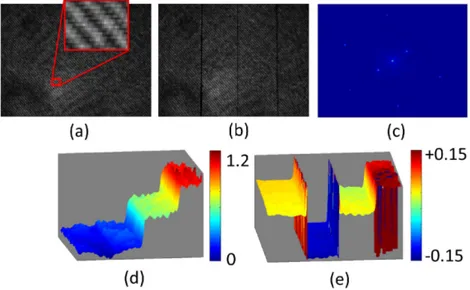
Fig. 2. (a) An experimentally obtained 2D interference pattern of the reference surface (b) An experimentally obtained 2D interference pattern of a three-step object. (c) Intensity plot of 2D Fourier transform of the interferogram shown in (b). (d) and (e) are reconstructed 3D height profiles of the sample with a pseudo color scale bar in mm for the low-precision unambiguous phases and the high-precision ambiguous phases, respectively.
Figure 2 shows experimental results of the RPTII. Figures 2(a) and 2(b) show interference patterns of the reference surface and a three-step object with a height of 0.15, 0.66 and 1.17 mm. Figure 2(c) shows a 2D intensity pattern of the Fourier-transformed interferogram in Fig. 2(b). The real-image components of the four states are separated by employing a filter for each phase. Figure 2(d) shows the reconstructed image by the phase of the zeroth-order and 0.7° incident beams; its measurement range is about 3.45 mm. The noise level of the reconstructed image is amplified by the inverse of the reduction factor. Figure 2(e) shows a reconstructed image by the zeroth-order and 2.2° incident beams; its measurement range is about 0.35 mm. The root mean squares of the noise level for the ambiguous and unambiguous phases are 0.004 mm and 0.043 mm, respectively. The noise level in Fig. 2(e) is therefore ten times less than that in Fig. 2(d).
The black edges in Fig. 2(b) generate high frequency components in the frequency domain, and these are removed by a Gaussian low-pass filter in the frequency domain. Even though the phase information is lost on the edges of stepped sample, the amount of phase jump on a step edge can be obtained as long as R.hmax is less than λ/2 [27], where hmax is the maximum step height, R is the reduction factor in Eq. (3). To unwrap the ambiguous phase, Eq. (5) above must be satisfied in the following manner:
' ' 1 (1 4 ) 1 4 1 cos 1 cos 1 1 (1 4(0.013)) 4(0.012) 1 cos(2.23 ) 1 cos(0.71 ) 1.253 0.647 ο ο ε ε θ θ − ≥ − − − ≥ − − ≥ (8)
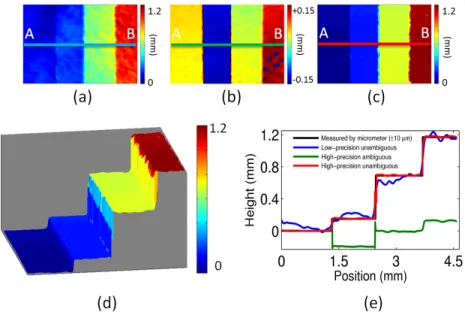
Figures 3(a) and 3(b) are 2D reconstructed images of the unambiguous and ambiguous phases in Fig. 2. Figures 3(c) and 3(d) are 2D and 3D unwrapped phases, respectively, of the wrapped phase in Fig. 2(e). Figure 3(e) shows three cross-sectional height profiles along the line from points A to B. The blue, green, and red lines correspond to Figs. 3(a)-3(c), respectively. As shown in Fig. 3(e), the red line has a higher precision, and its noise level is the same as the noise level of the green line.
Fig. 3. (a)-3(c) show restored 2D pseudo color height profiles of low-precision unambiguous, high-precision ambiguous, and high-precision unambiguous phases, respectively. (d) Reconstructed 3D height profile of the sample with a pseudo color scale bar in mm of the high-precision unambiguous phase. (e) Three horizontal cross sections of the reconstructed height profile along line AB shown in 3(a)-3(c) with blue, green, and red lines, respectively.
5. Conclusion
We have presented an RPTII as a single-shot, high-precision, single-wavelength method for measuring long-range stepped objects without numerical unwrapping algorithms. The technique improves the precision of the reduced-phase dual-illumination interferometer by recording selected phases and phase difference of the three beams simultaneously. The experimental results demonstrate the feasibility of our proposed technique. The maximum measurement range of a conventional interferometric method without numerical unwrapping is the wavelength of the laser used in interferometry. Unlike previous methods, the measurement range of our RPTII can be varied without limit by changing the diffraction orders of the multiple beams projected on a detector array, as long as the noise in the interference pattern is sufficiently small. The measurement range of the RPTII is mostly limited in practice by speckle noises in the interference pattern. The maximum measurement range we can obtain is 3.5 mm, which is 2100 times larger than the wavelength of the laser. Since the noise level of our RPTII can be reduced further by using speckle noise reduction methods, we believe that the maximum measurement range can be significantly improved in future studies. We expect that this method can be used in other phase imaging, digital holography, and interferometry techniques.
Acknowledgments
This work has been financially supported by the MEST through the National Research Foundation of Korea (Grant No. 2012R1A4A1029061) and by the Ministry of Education Science Technology of Korea through the BK21 program’s financial support of the Institute of Physics and Applied Physics at Yonsei University.