Design and characterization of the
Multi-Energy monochromatic X-ray Beam in
X-ray Imaging Systems
Daehong Kim
The Graduate School
Yonsei University
Design and characterization of the
Multi-Energy monochromatic X-ray Beam in
X-ray Imaging Systems
A Dissertation
Submitted to the Department of Radiological Science
and the Graduate School of Yonsei University
in partial fulfillment of the
requirements for the degree of
Doctor of Philosophy
Daehong Kim
Table of Contents
List of Figures ··· iii
List of Tables ···
viii
Abstract ···
ix
Chapter 1: Introduction ··· 1
1.1. Overview ··· 1
1.2. State-of-the-art of multi-energy X-ray imaging ··· 4
1.3. Introduction and limitation of dual-energy imaging method ··· 9
1.4. Objectives of this study ··· 19
Chapter 2: Characteristics of emission and detection of X-ray ··· 21
2.1. Tube potentials and characteristics of filters ··· 22
2.2. Detector configuration ··· 27
2.3. Process of emission and detection ··· 29
Chapter 3: Simulation study of the proposed design for triple-energy X-ray beam ··· 30
3.1. X-ray beam shaping ··· 31
3.2. Quantitative indices ··· 36
3.3. Measurement of designed X-ray beam ··· 47
3.4. Monte Carlo simulation ··· 50
3.5. Discussion ··· 60
Chapter 4: Experiment with the designed X-ray beam ··· 65
4.2. Linear attenuation coefficients and mean energy ··· 70
4.3. Results of density map ··· 75
4.4. Discussion ··· 78
Chapter 5: Summary and Conclusion ··· 81
References ··· 84
List of Figures
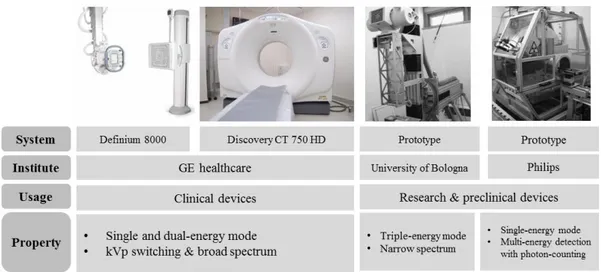
Figure 1.1. Multi-energy X-ray imaging devices and their characteristics of
operation.
Figure 1.2. Current types of multi-energy X-ray imaging systems for
dual-energy imaging by using a charge-integrating method with a broad
X-ray spectrum as a clinical device.
Figure 1.3. Signals were differentiated by the energies of their photons with a
one shot scan of a broad X-ray spectrum using the photon-counting
method.
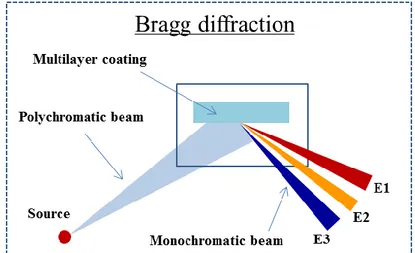
Figure 1.4. Monochromatic beams produced by using Bragg diffraction on a
multilayer coating crystal.
Figure 1.5. Monochromatic beams produced by using a filter.
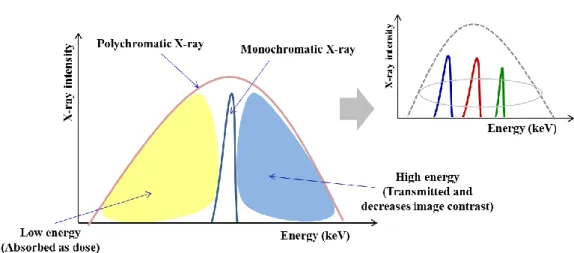
Figure 1.6. Relationship between polychromatic and monochromatic X-ray
beams for energy and X-ray intensity.
Figure 1.7. Phantom images acquired with energy subtraction, equivalent
thickness, and synthetic methods. (a) and (b) were obtained with 70
and 140 kV, respectively. Aluminum images were acquired with the
energy subtraction (c), equivalent thickness (e), and synthetic
methods (g). PMMA images were acquired by the energy
subtraction (d), equivalent thickness (f), and synthetic methods (h).
The arrow in (a) indicates the profile detailed in Figure 1.7 and 1.8.
Figure 1.8. Comparison of the profiles in the aluminum image acquired with
the energy subtraction, equivalent thickness, and synthetic methods.
Figure 1.9. Profiles of the PMMA image acquired with the energy subtraction,
equivalent thickness, and synthetic methods.
Figure 2.1. Initial X-ray beam was simulated ROTANODE
TM. Its operating
tube voltage ranges from 40 to 120 kV, and has a 0.7 mm
equivalent aluminum filter.
Figure 2.2. The micro-focus X-ray source tube for the experimental study with
photon-counting detector. The operating tube potential ranges from
20 to 90 kV, and has a 0.15 mm beryllium filter.
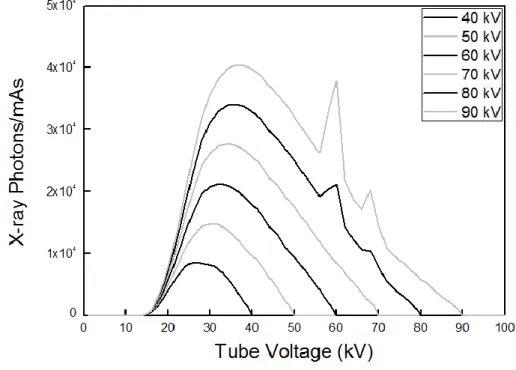
Figure 2.3. The X-ray spectra as functions of photon energy for various tube
potentials.
Figure 2.4. Filter materials for beam shaping used in this study.
Figure 2.5. The charge-integrating amorphous selenium (a-Se) detector for
acquiring signal from monochromatic X-ray beam for simulation
and experimental study.
Figure 2.6. The charge-integrating amorphous selenium (a-Se) detector for
acquiring signal from monochromatic X-ray beam for simulation
and experimental study.
Figure 2.7. Flow of emission and detection of X-ray from source to detector.
Figure 3.1. Illustration of geometry to acquire spectrum of designed X-ray
beam with initial X-ray source, filter, and a-Se detector.
Figure 3.2. The relationship between the number of photons and X-ray beam
shaping was simulated by using a Ba filter with increasing filter
thickness at 50 kV.
Figure 3.3. The alternation of relative X-ray beam shaping with increasing
filter thickness was simulated by using a Ba filter with increasing
filter thickness at 50 kV.
Figure 3.4. Mean energy with respect to tube potential using Ba filter at 2, 7,
and 8 HVL thicknesses and mean energy of K-edge, and without
filtration.
Figure 3.5. Mean energy using various filter materials corresponds to the
increasing tube potential at 7 HVL.
Figure 3.6. Results of mean energy ratio comparing various filter materials at 7
HVL through a 2 cm PMMA.
Figure 3.7. Results of mean energy ratio of comparing various filter materials
at 7 HVL through a 0.5 cm aluminum filter.
Figure 3.8. Illustration of geometry to acquire phantom image with designed
X-ray beam by using initial X-ray source, filter, and a-Se detector.
Figure 3.9. The signal (aluminum) and background (PMMA) were obtained to
evaluate contrast variation ratio and exposure efficiency by
simulation study. The effect of filtered X-ray beam was shown with
signal and noise of signal and background. The proton quantities of
unfiltered and filtered X-ray beam are each 3.8×10
6.
Figure 3.10. Contrast of the image obtained with filtered X-ray beam can be
higher than that acquired with unfiltered X-ray beam.
Figure 3.11. Exposure efficiency by considering the SNR and the number of
photons through 2 cm PMMA and 0.5 cm Al object for designed
beam obtained with Ba filter at various filter thickness.
Figure 3.12. Exposure efficiency considering the SNR and the number of
photons through 2 cm PMMA and 0.5 cm Al object for the designed
beam obtained with all filters at 7 HVL filter thickness.
Figure 3.13. The recorded spectrum of the CZT detector and the simulated
incident spectrum at tube voltage of 50 kV and I filter. The spectra
were normalized with respect to the integrated energy.
Figure 3.14. The recorded spectrum of the CZT detector and the simulated
incident spectrum at tube voltage of 60 kV and Ba filter. The
spectra were normalized with respect to the integrated energy.
.
Figure 3.15. The recorded spectrum of the CZT detector and the simulated
incident spectrum at tube voltage of 70 kV and Gd filter. The
spectra were normalized with respect to the integrated energy.
Figure 3.16. X-ray spectra for proposed TE monochromatic X-ray beam by
generating I, Ba, and Gd filters with 50, 60, and 70 kV, respectively.
Figure 3.17. In photon-counting mode, energy binning was performed from 90
kV broad spectrum to match the energies of proposed TE
monochromatic X-ray beam.
Figure 3.18. The cubic phantom of I, Al, and PMMA is on the detector for
obtaining linear attenuation coefficient and thickness density map.
Figure 3.19. Linear attenuation coefficient maps of I, Al, and PMMA obtained
with proposed TE X-ray beams and photon-counting method. (a),
(b), and (c) are the attenuation coefficients at 50, 60, and 70 kV,
respectively, with I, Ba, and Gd filters, respectively. (d), (e), and (f)
are the attenuation coefficients map at 29.34, 37.57, and 45.87 keV,
respectively.
Figure 3.20. (a), (b), and (c) are thickness density maps of I, Al, and PMMA
acquired with TE X-ray beams. (d), (e), and (f) are thickness
density maps of I, Al, and PMMA with the photon-counting method.
Figure 4.1. Mean energy ratio was estimated for images obtained with
proposed TE X-ray beam by measuring log intensity of the image
and known thickness of the phantom.
Figure 4.2. Contrast variation ratio was measured by the proposed and
conventional methods at E_1, E_2, and E_3.
Figure 4.3. Exposure efficiencies were measured by proposed and conventional
methods at E_1, E_2, and E_3.
Figure 4.4. Log intensity measurements by using the proposed method to
obtain linear attenuation coefficients with respect to increasing Al
thickness from 0.1 to 0.6 cm for E_1, E_2, and E_3.
Figure 4.5. Log intensity measurements by using proposed method to obtain
linear attenuation coefficients with respect to increasing PMMA
thickness from 1 to 6 cm for E_1, E_2, and E_3.
Figure 4.6. Log intensity measurements by using photon-counting method to
obtain linear attenuation coefficients with respect to increasing Al
thickness from 0.1 to 0.6 cm for E_1, E_2, and E_3.
Figure 4.7. Log intensity measurements by using the photon-counting method
to obtain linear attenuation coefficients with respect to increasing
PMMA thickness from 1 to 6 cm for E_1, E_2, and E_3.
Figure 4.8. (a) I, (b) Al, and (c) PMMA are obtained with the proposed TE
monochromatic X-ray beams with I, Ba, and Gd filters for 50, 60,
and 70 kV, respectively. (d) I, (e) Al, and (f) PMMA are the
material density maps obtained with the photon-counting method.
Figure 4.9. Thickness density maps of I, Al, and PMMA obtained by the
proposed TE X-ray beams and photon-counting methods.
List of Tables
Table 2.1. Filter materials, Z number, density, and K-edge energy.
Table 3.1. Tube operating range summary for different quantitative indices
considering mean energy ratio, exposure efficiency, and contrast
variation ratio.
Table 3.2. Proposed triple-energy X-ray beam and binning of photon-counting
method.
Table 3.3. Linear attenuation coefficients and mean energies of I, Al, and
PMMA with Monte Carlo simulation for proposed method.
Reference energy is K-edge energies of I, Al, and PMMA.
Table 3.4. Linear attenuation coefficients and mean energies of iodine,
aluminum, and PMMA with Monte Carlo simulation for
photon-counting method. Reference energy is the energies as binned in the
photon-counting system.
Table 4.1. The experimental results of the linear attenuation coefficients and
mean energies of I, Al, and PMMA for proposed method.
Reference energy is K-edge energies of I, Al, and PMMA.
Table 4.2. The experimental results of the linear attenuation coefficients and
mean energies of I, Al, and PMMA for photon-counting method.
Reference energy is the energies of binned in photon-counting
system.
ABSTRACT
Design and characterization of the
Multi-Energy monochromatic X-ray Beam in
X-ray Imaging Systems
Daehong Kim Dept. of Radiological Science
The Graduate School Yonsei University
Multi-energy X-ray imaging (or spectral imaging) is widely used in medical, industrial, and security fields. In the medical field, multi-energy X-ray imaging systems are suitable for contrast enhancement of lesions, quantitative analysis of specific materials, and functional imaging of the human body. Therefore, the dual-energy (DE) system was widely adopted for use in clinical examinations by operating dual-source, dual-layer detectors, and fast kV-switching. Recently, a photon-counting
detector has been developed that can obtain multiple pieces of information about an object by discriminating between the detected photon energies of the X-rays from broad energy band by the application of specific integrated circuits (ASIC). Quasi-monochromatic beam can be generated by using Bragg diffraction and filter design for multi-energy X-ray imaging. The aim of this dissertation is to develop a triple-energy (TE) monochromatic X-ray beam with filter designed to separate three materials, and the results of an image acquired with the proposed TE monochromatic X-ray beam were compared to an image obtained with the photon-counting method through both simulation and experimental measurement.
Various monochromatic X-ray beams, having filter materials (Al, Cu, I, Ba, Ce, Gd, Er, and W) with K-edge energy, were generated with a charge-integrating detector by simulation based on empirical models. An appropriate filter thickness was decided through comparison between the mean energy of a filtered beam and the K-edge energy of the filter. Quantitative indices such as mean energy ratio, contrast variation ratio, and exposure efficiency were estimated for each monochromatic beam using Monte Carlo simulation. The mean energy of each filter material was characterized with respect to increasing the tube potential due to the K-edge energy of the filter. The values of mean energy ratio of the filtered beam were below that of the result without a filter for all filter materials in a phantom study. This means that the filtered X-ray beam is monochromatic, thereby maintaining minimal beam hardening by the K-edge filter. Filtered X-ray beams obtained with I, Ba, and Ce were of a higher contrast than an unfiltered X-ray beam, in accordance with tube potential. In exposure efficiency, the
filtered beams using I, Ba, Ce, and Gd filters outperformed the unfiltered X-ray beams at same tube potential.
The TE monochromatic X-ray beams were generated by I, Ba, and Gd filters at 50, 60, and 70 kV from the simulation results, respectively. The spectra of the simulated TE monochromatic beams were compared to the experimental results obtained with the photon-counting detector. The results indicate that the energy peaks of the simulated spectra were well matched to those of experimental spectra. The thickness density map that was acquired with TE monochromatic beams was compared to that obtained with photon-counting method for both the simulation and experiment. In the simulation results, the thickness map obtained by using TE monochromatic beams were estimated to 1.00, 1.00, and 0.99 cm for iodine, aluminum, and PMMA, respectively, when the true values of the thickness density were 1.00 cm for each. In the simulation results of the photon-counting method, the thickness density maps of iodine, aluminum, and PMMA were 1.00, 0.96, and 1.07 cm, respectively. The thickness density maps of iodine, aluminum, and PMMA obtained with TE monochromatic beams were compared with the photon-counting method. The resultant thickness densities of iodine, aluminum, and PMMA were 0.57, 0.52, and 1.99 cm by the TE monochromatic method when the true values of the thickness density were 0.50, 0.50, and 2.00 cm for iodine, aluminum, and PMMA, respectively. In the photon-counting method, the thickness densities of iodine, aluminum, and PMMA were 0.50, 0.51, and 2.05, respectively.
In this paper, we proved that TE monochromatic X-ray beams are a reliable design with tube voltages and additional filters for triple-energy imaging. The proposed
additional filtration has proven its feasibility as the imaging method with a high accuracy of material thickness over the three materials, and this method can be used in the multi-energy X-ray imaging technique for medical imaging.
Keywords: Multi-energy X-ray imaging, monochromatic X-ray beam,
Chapter 1: Introduction
1.1. Overview
Multi-energy techniques have been developed to perform material segmentation in X-ray imaging, based on dual-energy (DE) systems such as dual-energy digital radiography (DEDR) and dual-energy computed tomography (DECT) in clinical environments [1, 2]. Clinical interest in DEDR has been maintained over the years, particularly for chest imaging and bone densitometry. DECT imaging has been also introduced to clinical practices for detecting urinary stones and heart diseases [3, 4].
While DE imaging systems were of benefit for the contrast enhancement of particular materials among other materials, the quantitative analysis of mixed material and functional imaging for lung ventilation or perfusion imaging in the case of DECT, DE imaging systems caused excessive radiation doses to the patient during examination. Moreover, the X-ray spectra generated at low and high peak tube potentials have a high degree of spectral overlap, resulting in smaller spectral separation. The smaller spectral separation makes it harder to discriminate between two materials, particularly for materials with close atomic numbers. Therefore, previous work has reported that spectral separation could be increased by using additional filtration for one or both tube potentials (kV) [5]. The work has demonstrated
optimizing the added filtration for DE imaging focused on chest radiography and mammotomography [6].
The success of material decomposition for X-ray imaging is dependent on the additional energy with DE. Therefore, triple-energy devices have been developed to improve the accuracy of decomposition and to reduce the projection error in preclinical environments for small animal imaging. These works proved that the decomposition accuracy can be improved by using both triple-energy monochromatic X-ray beams and triple-energy X-ray beams [7, 8].
More recently, many research studies have been focused on photon-counting detectors for realizing multi-energy X-ray imaging, which can resolve energy fluence since application-specific integrated circuits (ASIC) combined with semiconductor detectors based on cadmium telluride (CdTe) and cadmium zinc telluride (CZT) can discriminate between X-ray energies.
One possibility is the application of a photon-counting X-ray detector, which allows for improvements of the contrast-to-noise ratio (CNR) by energy weighting from the acquired image, counting each X-ray photon and measuring its energy in both simulation and experimental study [9, 10]. Another advantage of the photon-counting method is the possibility of K-edge imaging using a contrast agent with a K-edge such as gadolinium and iodine [11–13]. It was shown that heavy metals could be distinguished and quantified independently from a single scan. Photon-counting detectors have been used to reduce radiation doses compared to conventional (charge-integrating) detectors. Through photon-counting, projection-based weighting, and image-based weighting, the expected dose reduction could be estimated by setting the
CNR to be the same as that of the flat-panel image acquired at a certain dose level, by plotting CNR as function of air kerma [14] .
Generally, DE systems are able to use both single-energy (SE) and DE modes when performing examinations. The energy spectra of these systems had a broad band-window, thereby leading to giving an increased dose to patients and the decreased contrast of the images. As mentioned above, since the devices use a triple-energy beam with Bragg diffraction and a photon-counting detector to produce or read out the information of specific photon energy, they can improve the image quality, reduce the radiation dose, and discriminate between materials that share similar intensities on the image. Current devices that use multi-energy X-ray imaging systems were specified such as system name, institute of development, usage, and properties in figure 1.1.
1.2. State-of-the-art of multi-energy X-ray imaging
1.2.1 Dual-energy and photon-counting system
The signal acquisition mechanism of DE X-ray imaging systems includes dual-source CT, rapid kV switching, and dual-layer detectors [15–18] as shown in figure 1.2. The geometry of these systems means they must be able to acquire two images successfully without patient motion during the examination. The dual-source systems need two detectors that correspond to low- and high-energy X-ray sources geometrically. The kV switching method is widely used for DEDR and DECT, which alternate the tube potential during the scan to remove the motion artifact in a moment. Dual-layer detectors use single source and stacked dual-layer detectors. The front and rear detectors measure the low- and high-energy data, respectively. Since the aim of clinical DE X-ray imaging systems is to reduce scan times and movement artifacts, dual-source, kV switching, and dual-layer detectors were developed for image acquisition.
As shown in figure 1.3, the photon energy from one shot scanning was measured by the photon-counting method with complicated circuits such as ASIC. Therefore, a user can select the energy bins prior to scanning with respect to the energy within the photon energy ranges of the incident X-ray spectrum. The merit of the photon-counting method is that it collects the various signal information effectively with one shot of
X-ray exposure [9], thereby enhancing image contrast, reducing radiation dose, and separating the various materials.
Figure 1.2 Current types of multi-energy X-ray imaging systems for dual-energy imaging by using a charge-integrating method with a broad X-ray spectrum as a clinical device.
Figure 1.3 Signals were differentiated by the energies of their photons with a one shot scan of a broad X-ray spectrum using the photon-counting method.
1.2.2 Monochromatic X-ray
Investigating the issue of radiation dose to the patient for procedures such as CT examinations leads to reducing the radiation dose while maintaining image quality. The goal of the usage of a monochromatic X-ray beam is to reduce the radiation dose, improve the contrast of images, and suppress the fog of soft tissue. A monochromatic imaging system using Bragg diffraction was developed by previous work [19]. They dealt with the quasi-monochromatic X-ray beams, with tunable energy in a range of 26–72 keV, which was produced by Bragg diffraction on a Highly Oriented Pyrolytic Graphite (HOPG) crystal. The image acquisition mechanism of a monochromatic beam using Bragg diffraction is illustrated in figure 1.4.
Filter design technology was also introduced for obtaining a monochromatic X-ray beam in a group [20], as shown in figure 1.5. The results of previous work have reported that the filtered X-ray beams called with quasi-monochromatic X-ray beams were produced by the initial X-ray beam having a broad energy range and using additional filter materials with K-edge energies. They focused studying how the monochromatic X-ray beam is expected to yield enhanced tomographic image quality with a low dose. The effect of filter materials with different atomic numbers (Z) provided the energy-tunable beam due to the K-edge energy of the filter material. The shape of the quasi-monochromatic X-ray beam was dependent on both the filter materials and the tube potentials. The low-energy beam was absorbed by the filter material before the low-energy photons arrived at the object. The high tube potential
produced a spectrum tail over the peak energy of the monochromatic X-ray beam. Thus, the design of filter requires the appropriate selection of filter materials, filter thickness, and tube potentials.
Figure 1.4 Monochromatic beams produced by using Bragg diffraction on a multilayer coating crystal.
The merits of monochromatic X-ray beams are illustrated in figure 1.6. The contrast of the X-ray imaging depends on the radiation energy; usually, high X-ray energies result in a decreased contrast, while low energies are absorbed in the object, thus have a smaller probability of reaching the detector. Polychromatic X-ray spectra contain a large quantity of unnecessary photons and deliver images with deteriorated contrast. Monochromatic X-ray beams reduce radiation dosage to an object, enhance the image contrast, and increase the information given by a material. Multi-energy imaging is possible with monochromatic X-ray beam, particularly TE X-ray imaging for its generation of multiple X-rays with monochromatic energy.
Figure 1.6 Relationship between polychromatic and monochromatic X-ray beams for energy and X-ray intensity.
1.3. Introduction and limitation of dual-energy
imaging method
1.3.1 Energy subtraction
In DR imaging, energy subtraction, equivalent thickness, and synthetic method were used for enhancement of bone and tissue. The linear attenuation coefficient
) (E
can be represented as a function of energy (E) that is a combination of photoelectric absorption and Compton scattering within the diagnostic energy ranges [21]. Hence, above the K-edge of a material for diagnostic radiography, the linear attenuation coefficient can again be described by a set of basis functions [22, 23]. These basis functions are used to produce an energy-selective image such as bone and tissue with a dual-energy technique in accordance with an empirical model due to the characteristics of the bremsstrahlung x-ray spectrum [22]. Based on the previously mentioned energy subtraction method, a dual-energy subtraction image was derived from the difference between logarithmic intensity images utilizing low and high energy. In case of a monoenergetic source, no beam hardening can occur because the X-ray have only one energy. Therefore, the X-ray intensity can be measured at the detector and described as:
x
e
I
where I0 depicts the incident X-ray intensity,
is the value of a linear attenuationcoefficient over the material thickness x [24]. If an object includes the soft-tissue thickness ts and bone thickness
t
b, with the low- and the high-energy beams (energy level for i = 1 is 70 kVp and for i = 2 is 140 kVp), the log transmission measurements) /
ln(I0i Ii will be given by:
,
)
(
)
(
)
/
ln(
I
01I
1
Y
1
sE
1t
s
bE
1t
b (1.2),
)
(
)
(
)
/
ln(
I
02I
2
Y
2
sE
2t
s
bE
2t
b (1.3)where
s and
b are linear attenuation coefficients of soft tissue and bone [24, 25]. By combining equations (1.2) and (1.3), the weighting factor for energy subtraction can be given by the ratio of low- and high-energy linear attenuation coefficients:),
(
/
)
(
E
1E
2w
s
s
s (1.4)).
(
/
)
(
E
2E
1w
b
b
b (1.5)Therefore, the equations for the energy subtraction of bone and tissue images are:
),
/
ln(
)
/
ln(
I
01I
1w
I
02I
2Bone
s (1.6)).
/
ln(
)
/
ln(
I
02I
2w
I
01I
1Tissue
b (1.7)In the case of polychromatic X-rays, is calculated as
,
)
(
)
(
)
(
max max 0 0 0 0
E EdE
E
I
dE
E
I
E
(1.8)where I0(E) is the incident x-ray spectrum and Emax is the maximum energy of
the spectrum. We generated the spectrum from the tungsten anode spectral model using interpolating polynomials (TASMIP) code to calculate the weighting factors ws and
b
w [26, 28]. The ratios of linear attenuation coefficients (i.e., weighting factors) in equations (1.4) and (1.5) can be determined by the exposed dual energy spectra. The mass attenuation functions of bone and soft tissue were computed from the NIST data [27] within the diagnostic energy range.
1.3.2 Equivalent thickness and synthetic methods
According to the previous work, photoelectric effect and Compton scattering are dominant at a diagnostic x-ray range. These two effects can be represented by two set of basis functions
f
1(
E
)
andf
2(
E
)
:).
(
)
,
,
(
)
(
)
,
,
(
)
,
,
,
(
x
y
z
E
a
1x
y
z
f
1E
a
2x
y
z
f
2E
(1.9)In projection radiography, the relative detected X-ray photon flux is defined by
(
)
(
)
exp
( , , , ),
0dE
E
D
E
S
I
I
xyzE ds (1.10)where S(E)is the X-ray spectrum and D(E) is the detector efficiency. The transmitted intensity is line integral in the direction of the beam of the attenuation coefficient weighted by the incident X-ray spectrum and the detector efficiency. The attenuation coefficient is expressed as
)
(
)
(
)
(
E
A
1f
1E
A
2f
2E
U
(1.11) with
a
x
y
z
ds
A
i i(
,
,
)
i
1
,
2
.
(1.12)Because aluminum is close to bone whereas PMMA behaves like soft tissue, the two basis functions
f
1(
E
)
andf
2(
E
)
can be replaced with energy dependence of these two materials.Thus equation (1.11) is rewritten as
al al PM PM
E
t
E
t
E
U
(
)
(
)
(
)
(1.13)where
PM and
al are the linear attenuation coefficient of PMMA and aluminum. PMt
andt
al are the equivalent thickness of PMMA and aluminum. When the monochromatic X-ray beams are used at two different energies, equations (1.10) and (1.13) can be expressed as following,
)
(
)
(
)
/
ln(
I
01I
1
Y
1
PME
1t
PM
alE
1t
PM (1.14),
)
(
)
(
)
/
ln(
I
02I
2
Y
2
PME
2t
PM
alE
2t
al (1.15)where
ln(
I
0i/
I
i)
is log measurement at two different energies. Equations (1.14) and (1.15) can be inverted to,
2 13 1 12Y
a
Y
a
t
PM
(1.16),
2 23 1 22Y
a
Y
a
t
al
(1.17)where
Y
i
ln(
I
0i/
I
i)
. The a coefficients are function of the attenuation coefficients PM
and
al . The two equations of (1.16) and (1.17) are only valid for monochromatic X-ray beams. Therefore, the equations have to extended to polychromatic X-ray beams as following, 3 2 18 3 1 17 2 1 16 2 2 15 2 1 14 2 13 1 12 11 a Y a Y a Y a Y a YY a Y a Y a tPM (1.18) . 3 2 28 3 1 27 2 1 26 2 2 25 2 1 24 2 23 1 22 21 a Y a Y a Y a Y a YY a Y a Y a tal (1.19)
The a coefficients in equations (1.18 and 1.19) were determined by using the known combined thickness of PMMA and that of aluminum (
t
PM andt
al) and the log intensity measurementsY
1 andY
2 corresponding to the thickness for the dual energy calibration procedure as explained in the previous work [22]. In this work, thickness of PMMA is 1, 2, 3, 4, 5, and 6 cm and thickness of aluminum is 0.1, 0.2, 0.3, 0.4, 0.5, and 0.6 cm. Thus we construct the matrix equation for aluminum and PMMA thickness from equation (1.18) and (1.19). Then the a coefficients can be calculated by using inverse matrix from the equations. The synthesized monochromatic image can be formed from the equivalent thickness information, which is plotted on the basisprojection plane with characteristic angles. The equation with the two vectors is expressed by
).
sin(
)
cos(
al
PMt
t
C
(1.20)The scalar C represents the conversion of the equivalent thicknesses of PMMA and aluminum to a unique equivalent thickness of a material having a characteristic angle
. The angle was determined by the equation of Lehmann et al. [23] as following equation
.
tan
1 1 2 2 1
a
a
a
a
al PM (1.21)From this equation (1.21), it is possible to cancel any given material from the image and fill the resulting cavity with any other given material. It is called with material look-alike, which is within the synthesized monochromatic region and able to achieve material cancellation.
The phantom images are displayed in Figure 1.7 for the three methods and two materials. The comparisons of profiles of the phantom images are plotted in Figure 1.8. When the results acquired with the cylindrical phantom were compared, the relative intensity of aluminum with the equivalent thickness and the synthetic methods was 2.17 times higher than that obtained with the energy subtraction method in terms of the
profiles in Figure 1.8. The relative intensity of PMMA achieved with the synthetic method was 5.69 times better than that achieved with the energy subtraction method, as shown in figure 1.9. Although using the equivalent thickness method improved the relative intensity of the PMMA, the method resulted in aluminum shadows in the PMMA image. In contrast, the synthetic method can effectively remove the aluminum hole shadows and enhance the PMMA intensity, as shown in Figure 1.9.
However, theses method for DE imaging such as energy subtraction, equivalent thickness, and synthetic method were limitation in projection error in case of superimposed three materials. Since the energy subtraction and the equivalent thickness are assuming that the two basis materials for separating bone and tissue image, the methods are limited for discriminating three materials. Synthetic method produces a certain material by synthesize with characteristic angle two basis materials such as aluminum and PMMA. However, the synthetic method was also generated from two basis materials similar to equivalent thickness, and the method need complex imaging process due to the polychromatic X-ray energy. Therefore, the monochromatic triple-energy (TE) beam is needed to reduce projection error, maximize image contrast, and minimize radiation dose.
Figure 1.7 Phantom images acquired with energy subtraction, equivalent thickness, and synthetic methods. (a) and (b) were obtained with 70 and 140 kV, respectively. Aluminum images were acquired with the energy subtraction (c), equivalent thickness (e), and synthetic methods (g). PMMA images were acquired by the energy subtraction (d), equivalent thickness (f), and synthetic methods (h). The arrow in (a) indicates the profile detailed in Figure 1.8 and 1.9.
Figure 1.8 Comparison of the profiles in the aluminum image acquired with the energy subtraction, equivalent thickness, and synthetic methods.
Figure 1.9 Profiles of the PMMA image acquired with the energy subtraction, equivalent thickness, and synthetic methods.
1.4. Objectives of this study
It is challenging to discriminate between more than three materials using a DE imaging system due to the lack of the information available through the DE method. Moreover, spectral overlap causes inaccurate information in materials for multi-energy X-ray imaging. The efforts of researchers to obtain monochromatic X-ray beams are performed to maximize the performance metric (figure of merit) depending on several parameters such as added filtration, kV setting, dose allocation, and tube loading. However, there is a need for studies focused on DE imaging system that validate the results with experimental data.
The purpose of this work was to perform simulation and experimental studies to minimize the overlapped triple-energy X-ray spectra and to separate three materials from the separated spectra. The significant accomplishment of this work is the determination of X-ray beam for triple-energy imaging with imaging parameter combinations of added filtration and kV settings.
In this doctoral thesis investigation, the development of material decomposition methods with multi-energy technique in X-ray imaging system is reported that uses a filter design with both simulated and experimental measurements.
In chapter 2, the process of emission and detection of X-ray spectra is investigated with Monte Carlo and empirical simulation. Initial X-ray beam generation, transmission through filters, and the detection of X-rays on the detector are reported. The characteristics of the filter materials are discussed, and charge-integrating and
photon-counting detector are described for the purposes of the present study. Two types of X-ray source are described: clinical X-ray source and micro focus X-ray source were used for the charge-integrating and photon-counting detector.
In chapter 3, the Monte Carlo simulation of the X-ray beam design was performed for TE X-ray imaging. The X-ray beam was designed with filter materials and tube potential, then the designed X-ray beams were evaluated for their spectral distributions, mean energy ratio, contrast variation ratio, and exposure efficiency in accordance with tube potentials, filter materials, and their thickness compared with an unfiltered X-ray beam at the same tube potentials. The spectra of the designed monochromatic TE beams are compared to the spectra measured by photon-counting detector. Then, the designed spectra were used for acquiring three materials imaging by a displayed thickness density map.
In chapter 4, the performance of the triple-energy X-ray beams are evaluated experimentally. The image quality between the designed TE X-ray beams and conventional X-ray beams is evaluated by measuring their mean energy ratio, contrast variation ratio, and exposure efficiency. The designed TE X-ray beams were implemented to acquire a thickness density map of iodine, aluminum, and PMMA images, and their results were compared with density maps acquired by the photon-counting method.
Chapter 2: Characteristics of emission and
detection of X-ray
In this chapter, the emission and detection of X-rays emitted from a tube to a detector were theoretically described with an X-ray source, filter materials, and detector. This study was conducted using a tungsten anode spectral model that uses an interpolated polynomials (TASMIP) simulation code developed by Siewerdsen et al. that is based on an empirical X-ray generation model [28]. The model includes X-ray spectra, the selection of elemental and compound filters, and the calculation of beam quality characteristics. We simulated the X-ray spectra from a tungsten (W) target with tube potentials ranging from 40 to 90 kVp in 10 keV increments, using both a 12° anode angle and intrinsic tube filtration (0.7 mm aluminum equivalent) as shown in figure 2.1, and with filter thicknesses ranging from 2 to 8 half-value layer (HVL). Filter materials were selected in a range of Z=13 to 74, including K-edge energies for generating a monochromatic X-ray beam.
2.1. Tube potentials and characteristics of filters
2.1.1 X-ray source
Radiation is generated by the deceleration of fast electrons entering a metal anode (i.e. Bremsstrahlung).The radiation energy depends on the electron velocity, which in turn depends on the acceleration voltage between the cathode and anode. The X-ray spectrum has a broad energy band due to the emission origin. The empirical model used in this study was designed to provide a flexible toll for the calculation of X-ray spectra, the application of X-ray filters, and the analysis of spectral characteristics [28]. The initial spectrum was simulated with consideration of the tube potential (kV), inherent filter (mm Al), and ripple voltage.
The ray source was modeled primarily as a tungsten target within a diagnostic X-ray energy range of 40–90 kV and K-edge energy of filters. A tungsten target has merits for low- to medium-energy X-ray imaging, which yields the ample modification of beam currents, tube potential, and filtration. Therefore, a beam can be shaped with an appropriate attenuating filtration. The tube potentials contribute in varying degrees to the X-ray spectra as a function of the energy, as shown in figure 2.2. The simulated X-ray spectra used in this study are referred to the commercial X-ray tube (ROTANODETM, Toshiba, Japan) for obtaining TE monochromatic X-ray beam with a charge-integrating detector. The operating tube potential ranges from 40 to 120 kV, and has an inherent filter (0.7 mm aluminum). The micro-focus X-ray source
(L8601-01TM, Hamamatsu, Japan) was used for a photon-counting detector, which measures the information of energy by binning, and the micro-focus of the source is illustrated in figure 2.2. The operating tube voltage ranges from 20 to 90 kV, and has an inherent filter (0.15 mm beryllium).
Figure 2.1 Initial X-ray beam was simulated ROTANODETM. Its operating tube voltage ranges from 40 to 120 kV, and has a 0.7 mm equivalent aluminum filter.
Figure 2.2 The micro-focus X-ray source tube for the experimental study with photon-counting detector. The operating tube potential ranges from 20 to 90 kV, and has a 0.15 mm beryllium filter.
Initial X-ray spectra for 40, 50, 60, 70, 80, and 90 kV were generated by empirical model in a commercial X-ray tube (ROTANODETM), as shown in figure 2.3. The shapes of spectra were calculated as functions of photon energy for various tube potentials. From 40 to 70 kV, continuous energy spectra were illustrated. The peak energies of tungsten target were shown at 80 and 90 kV. The K-edge and K-alpha energies of tungsten target were 59.31 and 69.53 keV, respectively. With increasing tube potential, the peak energy (i.e. characteristic X-ray) of the tungsten target material was observed with continuous X-ray as well. The number of photons for 40, 50, 60, 70, 80, and 90 kV are as emitted per 1 mAs.
2.1.2. Filter materials
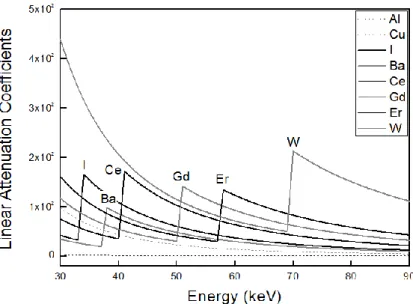
The simulation and experiment were carried out for various filters consisting of pure elemental materials in foil form (including Al, Cu, I, Ba, Ce, Gd, Er, and W). Al (Z=13) and Cu (Z=29) are widely used as filters to reduce the low energy in X-ray imaging devices. The K-edge energies of Al and Cu are 1.56 and 8.98 keV, respectively. I (Z=53), Ba (Z=56), Ce (Z=58), Gd (Z=64), Er (Z=68), and W (Z=74) have K-edge peaks from 30 to 70 keV, as shown in figure 2.4. Therefore, these materials could be tailored to transmit lower energy X-rays with high flux rather than X-rays at or greater than the K-edge. The specific information for each material (Z number, density, and K-edge) is listed in table 2.2.
Table 2.1 Filter materials, Z number, density, and K-edge energy. Materials Z Density (g/cm3) K-edge Aluminum (Al) 13 2.70 1.56 Copper (Cu) 29 8.96 8.98 Iodine (I) 53 4.93 33.17 Barium (Ba) 56 3.50 37.44 Cerium (Ce) 58 6.77 40.44 Gadolinium (Gd) 64 7.90 50.24 Erbium (Er) 68 9.07 57.49 Tungsten (W) 74 19.30 69.53
2.2. Detector configuration
2.2.1 Charge-integrating detector
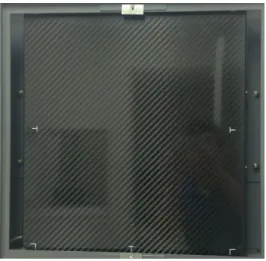
The direct conversion detector (FDXD 1417, DRtech, Seongnam, Korea) composed of thin-film transistor (TFT)-amorphous selenium (a-Se) was modelled through Monte Carlo simulation study. GATE simulation used in this study toolkit models detector signal as the absorbed energy of all primary and secondary absorption events [29]. It has a size of 356×427 mm2, a 2,560×3,072 array of pixels, a pixel pitch of 139×139 μm2
, and a thickness of 500 μm, as shown in figure 2.5. This detector used for validating the multi-energy monochromatic X-ray beam on both simulated and experimental measurement.
Figure 2.5 The charge-integrating amorphous selenium (a-Se) detector for acquiring signal from monochromatic X-ray beam for simulation and experimental study.
2.2.2 Photon-counting detector
The photon-counting system (as shown in figure 2.6) that is able to perform both DR and CT mode was constructed with CZT (eV2500, eV Products, Saxonburg, PA) detector, which consisted of a linear row of four CZT crystals 12.8 mm in length, 3 mm in width, and 3 mm in thickness. Each crystal was divided into 16 pixels, yielding a total of 64 pixels, with each pixel having an effective pitch of 0.8 mm. The linearity of count rate range of this detector is less than 1.2×10⁶ cps/mm2 based on a thickness-dependent study, thereby avoiding the pulse pile-up effect by high flux X-ray [10]. The energy-resolving capability of the detector sorted the photons into user-definable energy bins.
Figure 2.6 The photon-counting detector for validation compared to monochromatic triple-energy X-ray beam.
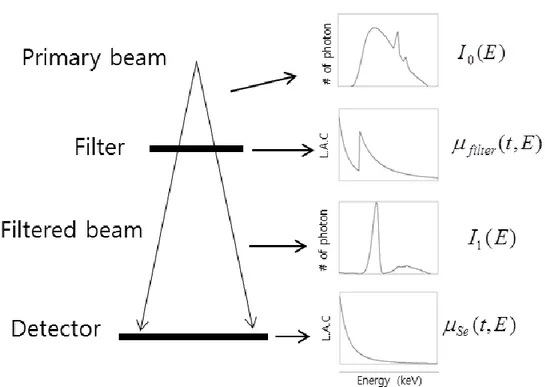
2.3. Process of emission and detection
The schematic flow is illustrated for emission and detection of photons in figure 2.7. If the primary X-ray beam is I0(E), the primary beam is shaping through the filter
) , ( Et filter
having a Z number, and the then filtered X-ray beam I1(E) is produced. The filtered X-ray beam I1(E) is detected by reaching the detectorse( Et, ). As shown in figure 2.7, the filtered spectrum (narrow beam) was shaped in accordance with the linear attenuation coefficients of the filter material.
Chapter 3: Simulation study of the proposed
design for triple-energy X-ray beam
In this chapter, we report X-ray beam shaping in combinations with tube potentials and filter materials with an empirical model. Appropriate filter thicknesses were determined with mean energy with respect to increasing HVLs of materials at a given tube potential. Filter materials were selected in a range of Z=13 to 74, including K-edge energy for monochromatic X-ray beam. Appropriate filter thickness were decided with reference to the results of variations of mean energy of filtered spectra. Then, the filtered spectra were validated to mean energy ratio, contrast variation ratio, and exposure efficiency as quantitative indices. Appropriate tube potentials and filter materials were proposed for performing triple-energy X-ray imaging. The obtained spectrum of triple-energy X-ray beam by simulation is compared to the experimental results by photon-counting detector. The linear attenuation coefficients of iodine, aluminum, and PMMA were produced by using a triple-energy beam for obtaining a thickness density map of three materials. The thickness density map acquired with the proposed triple-energy beam is compared to that obtained with the photon-counting method.
3.1. X-ray beam shaping
Initial X-ray beams were generated using an empirical model (i.e., TASMIP code), and then filter materials were combinations with the initial X-ray beams. The simulation tool for spectrum measurement and quantitative evaluation used a Geant4 Application for Tomographic Emission (GATE) Monte Carlo platform to model X-ray beam through filter and object. GATE is well validated, with highly realistic simulations [29]. The geometry of simulation was illustrated for monochromatic X-ray beam design as shown in figure 3.1. The initial beam in accordance with alternations of tube potentials is exposed to the detector through the filter. Detected X-ray beams are sorted by number of photons and the photon energy in GATE. Therefore, we obtained the filtered X-ray spectrum for each tube potential and filter material.
Figure 3.1 Illustration of geometry to acquire spectrum of designed X-ray beam with initial X-ray source, filter, and a-Se detector.
We simulated the monochromatic X-ray beam by increasing filter thickness at each tube potential. The filter thickness was increased from 2 to 8 HVL for observing the reduction in photon number by filtering. The number of photons in filtered beam is reduced to 128 times compared to the number of photons of initial beam at 7 HVL. The mean energy of each filtered beam was distributed by tube potential at the filter thickness of 7 HVL. Since tube loading can reduce the quantity of filtered beam to 128 times, the 7 HVL filter thickness was used to shape the X-ray beam. If 8 HVL is used as filter thickness, it is insufficient because the photon quantity of the filtered beam is reduced to 256 times. The plots of energy spectra in accordance with filter thickness for absolute and relative numbers of photons are illustrated in figures 3.2 and 3.3, respectively. Since maximum K-edge energy of a filter was about 70 keV, tube potential of more than 100 kV is not sufficient for spectral shaping. Therefore, we selected tube potential ranging from 40 to 90 kV. The relationship between the number of photons and X-ray beam shaping by Ba filter was indicated as having a high-energy range and narrow beam shaping, with increasing HVL at 50 kV, in figure 3.2. The quantity of the initial X-ray beam of 50 kV is reduced to 128 times, but tube loading can be controlled by increasing number of photons (i.e., mAs). The relative spectra by using 2, 7, and 8 HVL Ba filter at 50 kV are shown in figure 3.3. The spectral quality exhibits a complex distribution with higher tube potential (≥ 80 kV), where filtering has a greater effect on controlling mean energy change. Filtered X-ray beam is more narrow than the unfiltered X-ray beam. The mean energy of the narrow beam is expected to be close to the mean energy of K-edge energy of a filter. From figure 3.3, it
can be seen that there is significant beam hardening for the unfiltered case, regardless of tube potential.
Figure 3.2 The relationship between the number of photons and X-ray beam shaping was simulated by using a Ba filter with increasing filter thickness at 50 kV.
The mean energy of filtered X-ray spectrum is not dependent on the number of photons; it is only affected by distribution of X-ray spectrum. A plot of the mean of the filtered energy spectra for Ba at various filter thicknesses is shown in figure 3.4. The K-edge energy of Ba is 37.44 keV, while with an unfiltered spectrum, mean energy increases with increasing tube potential. Increasing filter thickness results in an increase in the mean energy due to more efficient pre-hardening of the spectra and, as a result, a qualitatively more quasi-monochromatic beam. When using 2 HVL thicknesses, the trend of mean energy increases similarly to that of an unfiltered beam. The trend of mean energy is similar between 7 and 8 HVL thicknesses at all tube potentials. Mean energy is rapidly more increased over the 70 kV with 7 and 8 HVL thicknesses than with the K-edge energy of Ba. Thus, K-edge peak of Ba does not contribute to the spectrum due to the existence of high energy with high tube potential.
A plot of the mean of the filtered energy spectra for various filter materials at 7 HVL indicates relatively invariant mean energies within some tube potential operating range with K-edge energy materials, as shown in figure 3.5. Mean energies of Al and Cu filters increased corresponding to the increasing tube potential. Higher Z corresponds to a higher mean energy within the range of 40 to 60 kV. The order of increasing invariant mean energies corresponds to the increasing K-edge energies of each material up to approximately 60 kV. However, the tungsten K-characteristic X-rays bias the spectrum more than the filter’s K-edge at tube potentials greater than 60 kV and, hence, shift the mean energy of the spectrum, leading to an inversion of the rank order of mean energies with increasing Z. Overall, mean energy is increasing
because the X-ray spectra is shifted to the high energy by filter. This means that the shapes of spectra were broad to narrow.
Figure 3.4 Mean energy with respect to tube potential using Ba filter at 2, 7, and 8 HVL thicknesses and mean energy of K-edge, and without filtration.
Figure 3.5 Mean energy using various filter materials corresponds to the increasing tube potential at 7 HVL.
3.2. Quantitative indices
We evaluated the filtered spectra as quantitative indices of mean energy ratio, contrast variation ratio, and exposure efficiency. In this study, the quantity of photons of filtered and unfiltered X-ray beam was set to 3.8×10⁶ for evaluating the mean energy ratio, contrast variation ratio, and exposure efficiency. Mean energy was calculated as the ratio of post-object mean energy to pre-object mean energy as follows:
max max max max 0 0 0 0)
(
)
(
)
(
)
(
E pre pre E pre pre pre E post post E post post post objdE
E
I
dE
E
I
E
dE
E
I
dE
E
I
E
ME
, (3.1)where I(E) is the X-ray intensity at a given energy, dE . The smaller degree of alternation of mean energy can be observed when MEobj mean energy of object of pre- and post-object is close to unity. Blocks of aluminum (thickness of 0.5 cm) and polymethyl methacrylate (PMMA) (thickness of 2 cm) were used for evaluating the mean energy when X-ray photons pass through the matter in the proposed method.
Another way to characterize the effect of contrast when filtered X-ray beam is used was to compare the contrast of unfiltered X-ray beam. Contrast (C) is defined with the following equation:
back signal backS
S
S
C
, (3.2)where Ssignal is the signal obtained from image, and Sback is the background of the image. Therefore, the contrast variation ratio can be defined as the ratio of contrast obtained in the beam-filtered case to contrast in the unfiltered beam case at the same tube operating potential with the following equation:
unfiltered filteredC
C
C
var , (3.3)where Cfiltered is the contrast when X-ray beam is filtered, and Cunfiltered is the contrast when X-ray beam is unfiltered at same tube potential.
We used exposure efficiency to evaluate the influence of X-ray beam and tube potential, which is assumed to be related to more desirable dose efficiency quantitative index. The exposure efficiency is defined as:
osure
N
S
S
Eff
back signal backexp
/
2 exp
, (3.4)where, Sback and Ssignal are the intensity of the background and of the signal, respectively. N is the noise (standard deviation) in the background region.
Figure 3.6 shows results of mean energy ratio of comparing various filter materials at 7 HVL through a 2 cm PMMA. Choice of an appropriate operating range for tube potential is dependent on the filter material, with a wider range of tube potentials for the higher Z materials (40–80 kV) than for the lower Z materials (40–50 kV), as indicated by the values of kV for which the plot remains close to unity. However, filters having low K-edge energy out of spectral energy such as Al and Cu are nearly the invariant mean energy ratio in all tube potentials because their K-edge energy does not contribute to shaping the ray beam. Mean energy ratio obtained with filtered X-ray beam is lower than that acquired with unfiltered X-X-ray beam for all tube potentials. Thus, filtered X-ray beam can reduce beam hardening by shaping a broad spectrum to a narrow beam. The mean energy of the narrow beam is maintained after the X-ray beam is through the object.
Figure 3.7 compares various filter materials at 7 HVL through a 0.5 cm Al. Mean energy ratio of filtered beam is reduced with comparison to unfiltered beam at the same tube potential. The mean energy ratio of I filter rapidly increases from 50 to 70 kV, and reduces from 70 to 90 kV. The mean energy ratio of Ba filter increases from 60 to 80 kV, and reduces from 80 to 90 kV. The mean energy ratio of Ce filter increases from 60 to 90 kV. The mean energy ratio of Gd increases from 80 to 90 kV. The mean energy of Al, Cu, Er, and W filters are almost equal. It is thought that K-edge energy of Al and Cu is influenced by tube potential. Considering K-edge energy of Er and W, the mean energy ratio of Er and W is expected to increase at more than 90 kV. The result indicated the same trend in case of mean energy ratio of PMMA in figure 3.6.
Figure 3.6 Results of mean energy ratio comparing various filter materials at 7 HVL through a 2 cm PMMA.
Figure 3.7 Results of mean energy ratio of comparing various filter materials at 7 HVL through a 0.5 cm aluminum filter.
The geometry of simulation was illustrated for image acquisition with the design X-ray beam, as shown in figure 3.8. The initial beam is emitted to the detector through the filter and phantom. The phantom image was used to evaluate contrast variation ratio and exposure efficiency.
Figure 3.8 Illustration of geometry to acquire phantom image with designed X-ray beam by using initial X-ray source, filter, and a-Se detector.
In figure 3.9, the phantom images were acquired to evaluate contrast variation ratio and exposure efficiency. Incident photon number was 3.8×10⁶ for each simulation condition. Aluminum is located at the center (white) as a signal, and the peripheral part is PMMA as a background (black). The first row is the image when using Al filter with 7 HVL thicknesses. The images by using unfiltered and filtered X-ray beams with Cu, I, Ba, Ce, Gd, Er, and W are displayed. The last row is the images made by using no filtration from 40 to 90 kV. The results for contrast variation ratio and exposure efficiency are illustrated in figures 3.9 and 3.10, respectively.
Figure 3.9 The signal (aluminum) and background (PMMA) were obtained to evaluate contrast variation ratio and exposure efficiency by simulation study. The effect of filtered X-ray beam was shown with signal and noise of signal and background. The proton quantities of unfiltered and filtered X-ray beam are each 3.8×10⁶.
As illustrated in figure 3.10, higher Z filters and higher tube potential appear to have less gain than lower Z filters because the designed X-ray beam by filter at high tube potential increases the transmission of the X-ray beam. Al and Cu are decreased with increasing tube potentials due to the too low K-edge energy. If one is interested in using the technique to reduce beam hardening without degrading contrast, then I, Ba, and Ce are appropriate for filter materials. Contrast of image obtained with filtered X-ray beam is higher compared with that acquired with unfiltered beam in this study. Thus, filtered X-ray beam is efficient to enhance image contrast in a specific tube potential range.
Figure 3.10 Contrast of the image obtained with filtered X-ray beam can be higher than that acquired with unfiltered X-ray beam.
Mean energy only takes into account designed X-ray beam characteristics. Contrast results are impacted by beam hardening in part but also take into account detector characteristics. However, noise is not included in either of the above results. Thus, to more completely characterize the system response, we include X-ray noise, detector efficiency, and incident beam characteristics by examining the exposure efficiency. The number of photons were 3.8×10⁶ for each X-ray beam.
From the simulation results, exposure efficiency increased with increasing filtration for almost all tube potentials. Figure 3.11 indicates the exposure efficiency considering both signal-to-noise ratio and the number of photons (exposure) on images obtained with monochromatic X-ray beam with increasing Ba filter thicknesses. In case of Ba filter, exposure efficiency increases between 40 to 80 kV when using 2, 7, and 8 HVL filter thicknesses. The exposure efficiency with changing tube potential illustrates that more filtration for a given tube potential yields better exposure efficiency (SNR2/exposure) in figure 3.11. The exposure efficiency is considered a reasonable surrogate for dose efficiency, and is ultimately a more easily measured quantity. Al and Cu filter reduced the exposure efficiency. The range of exposure efficiency with filtered beam is higher than the conventional beam from 40 to 50 kV for all filters, as shown in figure 3.12. The exposure efficiency obtained with monochromatic X-ray beam with I, Ba, and Ce filters is increasing in the range of 50 to 60 kV compared to that acquired with unfiltered beam at the same exposure. Overall, monochromatic X-ray beam generated by I, Ba, Ce, and Gd filters were higher exposure efficiency than that acquired with unfiltered X-ray beam. The evaluated quantitative indices for mean