A model for estimating body shape biological
age based on clinical parameters associated
with body composition
Chul-Young Bae1
Young Gon Kang2
Young-Sung Suh3
Jee Hye Han4
Sung-Soo Kim5
Kyung Won Shim6
1MediAge Research Center, Seoul, Korea; 2Chaum Power Aging Center, College of Medicine, CHA University, Seoul, Korea; 3Health Promotion Center, Keimyung University Dongsam Medical Center, Daegu, Korea; 4Department of Family Medicine, College of Medicine, Eulji University, Seoul, Korea; 5Department of Family Medicine, College of Medicine, Chungnam National University, Daejeon, Korea; 6Department of Family Medicine, Ewha Womans University Mokdong Hospital, Ewha Womans University, Seoul, Korea
Correspondence: Young Gon Kang Chaum, College of Medicine, CHA University, Pie’n Polus 2F, 4-1 Cheongdam-Dong, Gangnam-Gu, Seoul 135-948, South Korea Tel +82 255 564 38 Fax +82 255 564 39 Email [email protected]
Background: To date, no studies have attempted to estimate body shape biological age using
clinical parameters associated with body composition for the purposes of examining a person’s body shape based on their age.
Objective: We examined the relations between clinical parameters associated with body
composition and chronological age, and proposed a model for estimating the body shape biological age.
Methods: The study was conducted in 243,778 subjects aged between 20 and 90 years who
received a general medical checkup at health promotion centers at university and community hospitals in Korea from 2004 to 2011.
Results: In men, the clinical parameters with the highest correlation to age included the
waist-to-hip ratio (r = 0.786, P , 0.001), hip circumference (r = -0.448, P , 0.001), and height (r = -0.377, P , 0.001). In women, the clinical parameters with the highest correlation to age include the waist-to-hip ratio (r = 0.859, P , 0.001), waist circumference (r = 0.580,
P , 0.001), and hip circumference (r = 0.520, P , 0.001). To estimate the optimal body shape biological age based on clinical parameters associated with body composition, we performed a multiple regression analysis. In a model estimating the body shape biological age, the coefficient of determination (R2) was 0.71 in men and 0.76 in women.
Conclusion: Our model for estimating body shape biological age might be a novel approach to
variation in body shape that is due to aging. We assume that our estimation model would be used as an adjunctive measure in easily predicting differences in body shape with the use of clinical parameters that are commonly used to assess the status of obesity in a clinical setting.
Keywords: chronological age, body shape, biological age
Introduction
Substantial changes in body composition occur over the aging process. Many studies have suggested that over the course of the aging process, the amount of fat tends to increase and is preferentially stored in the abdominal area, while skeletal muscle mass and bone mineral density decline.1–4 Understanding how changes in body composition,
especially fat distribution, affect the risk for many chronic diseases such as cardiovas-cular diseases and type 2 diabetes mellitus, is a primary concern.
It is well known that body mass index (BMI) is one of the most popular clinical parameters for estimating body composition, and it is a reliable indicator for body fat mass percentage (BFM%). It is also an obesity index whose causal relationship with morbidity and mortality has been well established.5–7 Because it can be efficiently used to determine obesity in a
large-sized population, BMI is frequently used for the assessment of obesity in a clinical setting. O R I G I N A L R E S E A R C H open access to scientific and medical research Open Access Full Text Article
Number of times this article has been viewed
This article was published in the following Dove Press journal: Clinical Interventions in Aging
It has been reported, however, that the distribution of body fat rather than its amount is more likely to be associated with health-related risks,8 and that abdominal obesity is an independent risk
factor for raising the morbidity and mortality as such.9–11 This
has led to an emphasis on the importance of other parameters, including the abdominal obesity index in particular, than BMI in assessing obesity.
Measures for abdominal obesity include waist circumfer-ence (WC), waist-to-hip ratio (WHR), and abdominal sagittal diameter. In addition, abdominal obesity is also evaluated by measuring the amount of body fat using ultrasonography, computed tomography, and magnetic resonance imaging. Of the various types of measures that are used to assess obesity, the amount of visceral body fat measured on computed tomography scans is known to best indicate abdominal obesity;12–14 however,
its use is somewhat restricted because of the cost and exposure to irradiation. Accordingly, in an actual clinical setting, WC and WHR are mainly used to assess abdominal obesity. According to several previous studies examining various parameters that are commonly used to assess abdominal obesity in a clinical setting, WC was a more reliable parameter than WHR in making a diagnosis of abdominal obesity.15 In addition, these studies
have also shown that WC was also the most reliable indicator in predicting the amount of visceral fat.10,16,17
Body fat is redistributed with increasing age, as more of it becomes located in the abdominal cavity.14,18 The reason
for this redistribution is not really known, but declining testosterone and growth hormone levels in combination with declining rates of lipolysis of visceral fat associated with aging may play a role in men.19 Low testosterone levels
have been shown to be associated with increased visceral fat mass in men.20 In women, the declining estrogen levels after
menopause may be a critical factor. While several studies have investigated the relationship between weight change, obesity, and visceral fat with age and the risk of developing lifestyle-related diseases,21–24 the effect of maintaining one’s
youthful body shape (in terms of appearance) on reducing such risks has been given significantly less attention.
Several recent studies have reported the difference in body shape between men and women, and they have examined age-related differences in body shape using three-dimensional body scans. It has become more and more clinically impor-tant to assess body shape based on the pattern of body fat distribution and redistribution, rather than to assess obesity simply based on an increased amount of body fat. Meanwhile, several approaches have been used to objectively assess body shape from this context.25–30 Presumably, the assessment of
body shape based on three-dimensional body scans might
be unavailable in a clinical setting. Therefore, it might also be mandatory to conduct studies to assess the status of body shape associated with age using clinical parameters that are currently used to assess obesity in a clinical setting.
It remains problematic that in general, anthropometric measures such as BMI or WHR are insufficient for the assess-ment of this redistribution.31 In addition, anthropometric
measures have been mainly used to assess the status of obesity based on body composition up until the present.
Age after birth is a measure of the degree of aging in individual, this is termed as chronological age or calendar age, which is a definition of aging as a function of time. Aging is characterized by a time-related decline in physiological func-tions and changes in morphology, and is usually assessed by the chronological age, which is defined as time elapsed since birth. Chronological age fails to provide an accurate indicator of the aging process. Because tissues age at different rates and because diseases vary enormously among individuals, humans become increasingly different from one another with age. But, biological age estimates the functional status of an individual in reference to his or her chronological peers on the basis of how well he or she functions in comparison with others of the same chronological age.32,33 Biological age is estimated based
on aging biomarkers that are subject to change depending on one’s calendar age. Overall, biological age is a more reliable indicator of the degree of aging and one’s health status as compared to an individual’s calendar age. To date, a variety of models for estimating biological age have therefore been proposed to meet relevant study objectives. To estimate the physical, biochemical, and hormonal biological ages, we have also previously proposed the models for estimating biological ages using relevant biomarkers;34 however, we did not propose
a model for estimating body shape biological age using the clinical parameters associated with body composition.
Given this background, we conducted the current study to examine the correlations of age with BMI, BFM%, lean body mass percentage (LBM%), WC, and the WHR using clinical parameters associated with body composition. In addition, by using these parameters, we also proposed a model of body shape biological age that estimated a person’s body shape based on their age. Thus, our estimation model will help people understand the above correlations, and it will promote bidirec-tional communication between physicians and patients.
Methods
Subjects
The current study was conducted in 243,778 subjects aged between 20 and 90 years; the subjects comprised
men and women who received a general medical checkup for health promotion and disease prevention at health promo-tion centers at university and community hospitals during a period ranging from June 2004 to January 2011. In the current study, exclusion criteria included the presence of uncontrolled hypertension and diabetes, and the subjects taking current medications for cardiovascular, pulmonary, hepatic, pancreatic, or renal diseases. Subjects were also excluded if their reported clinical parameters exceeded the standard deviations of the normal range.
Clinical parameters
To analyze the differences in clinical parameters due to aging, and to minimize the potential confounding effects of diseases or abnormal measurements, we set inclusion criteria considering both the standard deviations of parameters that were collected and the normal range which was established by the American Medical Association. Of these clinical parameters, we excluded those which were not in agreement with the inclusion criteria. Only the screened data were used for the statistical analysis.
For the clinical parameters associated with obesity, we collected data such as height, weight, WC, hip circumference (HC), LBM%, and BFM%. Height and weight were measured using height-measuring equipment and an electronic scale while subjects wore light clothes. As for WC, the thinnest area between the inferior part of the lowest rib and the iliac crest was measured as a unit of cm when subjects were in an upright position. As for HC, the location of the greater trochanter or the widest circumference was measured as a unit of cm. This was followed by the measurement of LBM% and BFM% using multifrequency segmental bioelectrical impedance (Inbody®, Biospace Co, Ltd, Seoul, Korea). BMI
was calculated using height and weight as shown below.
Then, using the measurements of WC and HC, the WHR was calculated:
BMI (kg/m2) = Weight (kg)/Height2 (m2) (1)
Statistical analysis
To identify the correlation between the clinical parameters and chronological age, a Pearson’s correlation analysis was performed. To propose a model for estimating body shape biological age, we performed a stepwise method in multiple regression analysis between the age and clinical parameters that had been selected by the correlation analysis. We employed multiple regression analysis with assigning vari-ance inflation factor to evaluate multicollinearity among the parameters. Statistical analysis was completed using SPSS 12.0 (SPSS Inc, Chicago, IL, USA). Statistical significance was set at P , 0.05.
Results
Baseline characteristics
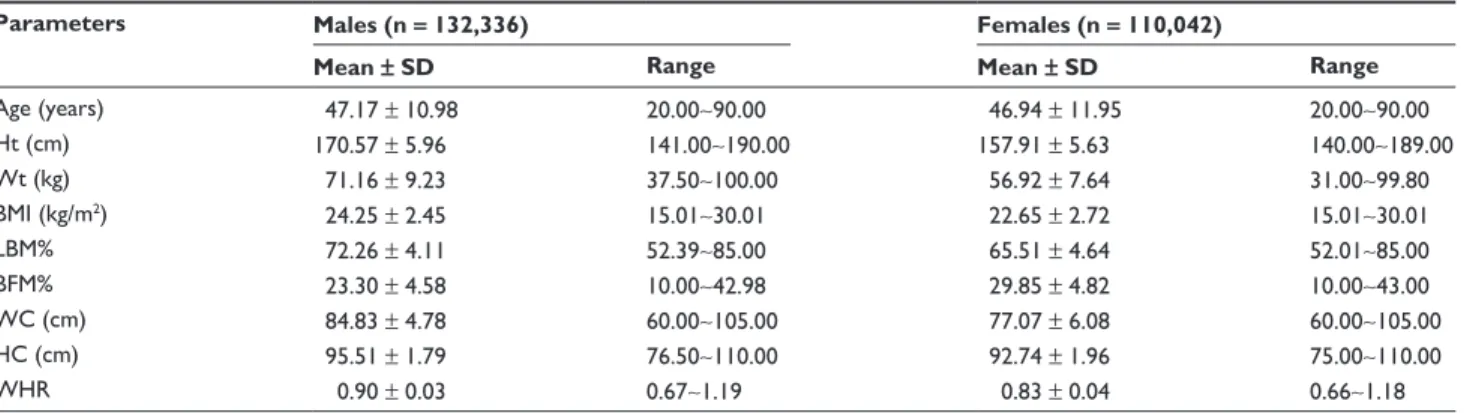
A total of 243,778 subjects participated in the current study, of which there were 132,336 men and 110,042 women. All the clinical parameters associated with obesity are represented in Table 1. Mean age was 47.17 ± 10.98 years in men and 46.94 ± 11.96 years in women. In men, mean height and weight were 170.57 ± 5.96 cm and 71.16 ± 9.23 kg, respectively. In women, these values were 157.91 ± 5.63 cm and 56.92 ± 7.64 kg, respectively.
The correlation between age
and the clinical parameters
associated with body composition
In men, the clinical parameters with the highest correlation with the age included the WHR (r = 0.786, P , 0.001), HC
Table 1 Clinical characteristics of study subjects by gender
Parameters Males (n = 132,336) Females (n = 110,042)
Mean ± SD Range Mean ± SD Range
Age (years) 47.17 ± 10.98 20.00∼90.00 46.94 ± 11.95 20.00∼90.00 Ht (cm) 170.57 ± 5.96 141.00∼190.00 157.91 ± 5.63 140.00∼189.00 Wt (kg) 71.16 ± 9.23 37.50∼100.00 56.92 ± 7.64 31.00∼99.80 BMI (kg/m2) 24.25 ± 2.45 15.01∼30.01 22.65 ± 2.72 15.01∼30.01 LBM% 72.26 ± 4.11 52.39∼85.00 65.51 ± 4.64 52.01∼85.00 BFM% 23.30 ± 4.58 10.00∼42.98 29.85 ± 4.82 10.00∼43.00 WC (cm) 84.83 ± 4.78 60.00∼105.00 77.07 ± 6.08 60.00∼105.00 HC (cm) 95.51 ± 1.79 76.50∼110.00 92.74 ± 1.96 75.00∼110.00 WHR 0.90 ± 0.03 0.67∼1.19 0.83 ± 0.04 0.66∼1.18
Abbreviations: SD, standard deviation; Ht, height; Wt, weight; BMI, body mass index; LBM%, lean body mass percentage; BFM%, body fat mass percentage; WC, waist
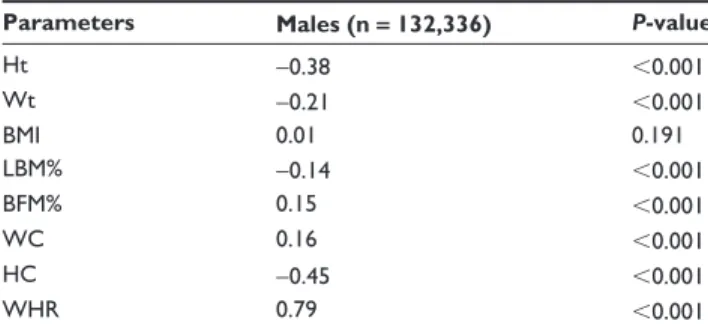
(r = -0.448, P , 0.001), and height (r = -0.377, P , 0.001). In women, the clinical parameters with the highest correla-tion with age included the WHR (r = 0.859, P , 0.001), WC (r = 0.580, P , 0.001), and HC (r = 0.520, P , 0.001). All of the collected data surrounding the clinical parameters had a significant correlation with age. In men, however, only the clinical parameters associated with obesity other than BMI (r = 0.005, P = 0.191) had a significant correlation with age (Tables 2 and 3).
Estimation of body shape biological age
based on clinical parameters associated
with body composition
To estimate the optimal body shape biological age based on the clinical parameters associated with body composition, we performed a multiple regression analysis. In a model for estimating body shape biological age in men, the coefficient of determination (R2) was 0.71, and the relevant clinical
param-eters included the WHR, WC, height, LBM%, and weight. In a model for estimating the body shape biological age in women, the coefficient of determination (R2) was 0.76, and the relevant
clinical parameters included the WHR, height, WC, LBM%, and weight (Tables 4 and 5). Figures 1 and 2 illustrate the correlations between biological age and chronological age in a model for estimating body shape biological age in men and women.
Discussion
As shown in the current study, a model for estimating body shape biological age was effective in predicting the age-related changes that occur in body shape based on clinical parameters associated with body composition (WHR, WC, height, LBM%, weight, and HC) in approximately 71% of men and approximately 76% of women. Regarding the correlation between age and the clinical parameters
associ-Table 3 Correlation coefficients between age and clinical
parameters in females
Parameters Females (n = 110,042) P-value
Ht -0.46 ,0.001 Wt 0.14 ,0.001 BMI 0.41 ,0.001 LBM% -0.43 ,0.001 BFM% 0.41 ,0.001 WC 0.58 ,0.001 HC 0.52 ,0.001 WHR 0.86 ,0.001
Abbreviations: Ht, height; Wt, weight; BMI, body mass index; LBM%, lean body
mass percentage; BFM%, body fat mass percentage; WC, waist circumference; HC, hip circumference; WHR, hip-to-waist ratio.
Table 4 Body shape biological age prediction model in males
(R2 = 0.705)
Parameters PRC ± SEM Standard PRC t P-value
WHR 281.419 ± 0.922 0.692 305.362 0.000 HC -1.595 ± 0.014 -0.260 -114.282 0.000 Ht -0.149 ± 0.005 -0.081 -27.987 0.000 LBM% -0.112 ± 0.007 -0.042 -15.500 0.000 Wt -0.052 ± 0.004 -0.043 -13.681 0.000
Abbreviations: PRC, partial regression coefficients; SEM, standard error of the
mean; WHR, waist-to-hip ratio; HC, hip circumference; Ht, height; LBM%, lean body mass percentage; Wt, weight.
Table 2 Correlation coefficients between age and clinical
parameters in males
Parameters Males (n = 132,336) P-value
Ht -0.38 ,0.001 Wt -0.21 ,0.001 BMI 0.01 0.191 LBM% -0.14 ,0.001 BFM% 0.15 ,0.001 WC 0.16 ,0.001 HC -0.45 ,0.001 WHR 0.79 ,0.001
Abbreviations: Ht, height; Wt, weight; BMI, body mass index; LBM%, lean body
mass percentage; BFM%, body fat mass percentage; WC, waist circumference; HC, hip circumference; WHR, waist-to-hip ratio.
ated with body composition, seven parameters other than BMI for men, and all of the eight parameters for women had a significant correlation with age. Of the clinical parameters that had a significant correlation with age. Of the clinical parameters that had a significant correlation with age in men, height, weight, LBM%, and HC had a negative correlation with age, while BFM%, WC, and the WHR had a positive correlation. In women, height and LBM% had a negative correlation with age, while weight, BMI, BFM%, WC, HC, and the WHR had a positive correlation.
Previous studies have shown that both men and women have experienced a decrease in height due to increased age, and this was more notable in women.35–43 A decrease in
height due to increased age mainly originates from changes in the vertebrae (eg, vertebral fracture, weakening of the paravertebral muscles, changes in posture, degenerative changes in the intervertebral disc, vertebral deformity, and kyphosis). In addition, its onset begins at the age of 45 years or so, and then it continues with increased age.36,37,43,44 It is
therefore known that a decrease in height due to increased age is associated with osteoporotic fractures, and it is also an indicator of the prediction of vertebral fractures and risks of developing femoral fractures in the elderly.45,46 In
Table 5 Body shape biological age prediction model in females
(R2 = 0.763)
Parameters PRC ± SEM Standard PRC t P-value
WHR 224.964 ± 0.922 0.768 244.049 0.000 Ht -0.245 ± 0.005 -0.115 -49.171 0.000
HC -0.631 ± 0.016 0.103 40.325 0.000
LBM% -0.200 ± 0.006 -0.077 -32.074 0.000 WC -0.123 ± 0.006 -0.063 -20.244 0.000
Abbreviations: PRC, partial regression coefficients; SEM, standard error of the
mean; WHR, waist-to-hip ratio; Ht, height; HC, hip circumference; LBM%, lean body mass percentage; WC, waist circumference.
Figure 1 The body shape BA prediction model in males.
Notes: The 45° line represents the theoretical normal aging line in males. The
experimental line is the predicted regression line on body shape BA, and both dotted lines mean the range of ± 1 standard deviation (67%). The equation: body shape BA: -16.958 + 281.419 (WHR) - 1.595 (HC) - 0.149 (Ht) - 0.112 (LBM%) - 0.052 (Wt).
Abbreviations: BA, biological age; WHR, waist-to-hip ratio; HC, hip circumference;
Ht, height; LBM%, lean body mass percentage; Wt, weight. 20 30 40 50 Chronological age Male Body shape BA 60 70 80 90 20 30 40 50 60 70 80 90 20 30 40 50 Chronological age Female Body shape BA 60 70 80 90 20 30 40 50 60 70 80 90
Figure 2 The body shape and BA prediction model in females.
Notes: The 45° line represents the theoretical normal aging line in females. The
experimental line is the predicted regression line on body shape BA and both dotted lines mean the range of 67%. The equation: body shape BA: -137.388 + 224.964 (WHR) - 0.245 (Ht) + 0.631 (HC) - 0.2 (LBM%) - 0.123 (WC).
Abbreviations: BA, biological age; WHR, waist-to-hip ratio; Ht, height; HC, hip
circumference; LBM%, lean body mass percentage; WC, waist circumference.
between a decrease in height and increased age. In a model for estimating body shape biological age, the degree of the correlation between the two parameters was significantly higher in women than men.
BMI is widely used for nutritional assessment, obesity classification, and as a prognostic variable for mortality; however, there are many limitations. First, BMI could potentially produce an inaccurate diagnosis of “overweight” and “obese” in some special populations such as athletes, body builders, and elderly patients.Second, BMI-associated mortality in specific situations is controversial.47
In a model for estimating the body shape biological age, we included the height and weight of men and only the height of women rather than the BMI. In addition, the correlation between BMI and age reached statistical significance only in women.
As shown in the current results, both men and women demonstrated a positive correlation between BFM% and
age, and a negative correlation between age and LBM%. In addition, we included only the LBM% in a model for estimating biological age. Previous studies have established that BFM% was increased and LBM% was decreased with increased age.48,49 An increase in BFM% due to increased
age originated from a decrease in LBM%, rather than from an increase in BFM% in men. It has been reported that an increase in BFM% rather than a decrease in LBM% might play a key role in causing an increase body fat due to aging in women.50,51
Regarding the distribution of body fat depending on body shape, it has been reported that abdominal obesity is a notable, independent risk factor for raising morbidity and mortality rates.9–11 Therefore, the clinical significance of
weight, BMI, and the BFM% would greatly vary depending on the types of abdominal obesity, (ie, android or gynoid type). Previous studies have shown that WC is the most reli-able indicator for reflecting the amount of visceral fat in the assessment of abdominal obesity.10,15–17 As shown in the
cur-rent results, both men and women had a positive correlation between increased age and both WC and the WHR; however, HC had a negative correlation with age in men and a positive correlation with in women. According to previous studies, the WHR was increased until the age of 55–64 years, and then it decreased thereafter in men, though it continually increased with increased age in women.52,53 These authors noted that
these findings occurred because of the redistribution of body fat due to changes in sex hormones in both men and women aged between 45 and 54 years.52,53 Other studies have also
shown that hormone therapy reduced the WHR, thus provid-ing more evidence for the redistribution of body fat because of hormonal changes.54,55 As shown in the current results, the
WHR was included in a model for estimating body shape biological age in both men and women. In addition, HC was included in this model for men, and both HC and WC were included for women. In particular, in estimating the body shape biological age, both men and women showed that the WHR was the most powerful factor. Previous studies have shown that WC is a more reliable indicator of predicting abdominal obesity. From a perspective that considers the differences in body shape due to aging, however, the WHR is a more powerful factor, and it better reflects differences in body shape.
In cross-sectional studies, the prevalence of high body weight or obesity (BMI . 30 kg/m2) increases with age
up to about age 60 and then declines.56 Although this does
not indicate that the excessive accumulation of body fat rarely occurs in the elderly, this does suggest that visceral obesity increasingly occurs because of the redistribution of body fat due to increased age, and this leads to changes in body shape.25–30,56 Accordingly, considering variation in
body shape due to aging, it would be more appropriate for clinical evaluation to be based on body shape due to the increased occurrence of visceral obesity, rather than the consistent application of clinical parameters for assessing obesity.
We propose that a model for estimating body shape bio-logical age be appropriate for assessing differences in body shape due to increased age with the application of clinical parameters associated with body composition. Moreover, by presenting the clinical parameters for assessing obesity that are commonly used in a clinical setting – and thereby comparing the results with those obtained from age-matched controls – our estimation model would be used to perform an overall analysis of the differences in body shape due to aging. Furthermore, by comparing one’s current body shape biological age with their calendar age (thereby expressing whether the body shape biological age is older or younger than one’s calendar age), our estimation model would be easily accepted by people, and it would also be of help for facilitating communication between physicians and patients. In addition, it would also be of help for providing the motives to improve the status of obesity, and for set-ting personal goals. In a model for assessing body shape biological age, however, we did not include the factors that might affect the clinical parameters associated with obesity, including the amount of physical activity, eating habits
such as nutritional intake, and socioeconomic status, and we excluded the data of some subjects who were suspected of having diseases or conditions based on certain criteria. There were also limitations in the current study in that we did not perform a detailed analysis of the participants’ medical history such as a present illness, a past history, and a family history.
Conclusion
Our model for estimating body shape biological age might be a novel approach to variation in body shape that is due to aging despite several limitations. We assume that our estimation model would be used as an adjunctive measure in easily predicting differences in body shape with the use of clinical parameters that are commonly used to assess the status of obesity in a clinical setting. Our results will provide baseline data for further studies to examine not only the effects of changes in body shape due to the aging pro-cess on the degree of aging in individuals, the rate of aging progression, and life expectancy, but they will also provide information surrounding correlations between body shape, disease, morbidity, and mortality.
Disclosure
The authors report no conflicts of interest in this work.
References
1. Poehlman ET, Toth MJ, Fishman PS, et al. Sarcopenia in aging humans: the impact of menopause and disease. J Gerontol A Biol Sci Med Sci. 1995;50 Spec No:73–77.
2. Baumgartner RN, Stauber PM, McHugh D, Koehler KM, Garry PJ. Cross-sectional age differences in body composition in persons 60+ years of age. J Gerontol A Biol Sci Med Sci. 1995;50(6):M307–M316. 3. Christmas C, O’Connor KG, Harman SM, et al. Growth hormone and
sex steroid effects on bone metabolism and bone mineral density in healthy aged women and men. J Gerontol A Biol Sci Med Sci. 2002;57(1): M12–M18.
4. Evans WJ, Campbell WW. Sarcopenia and age-related changes in body composition and functional capacity. J Nutr. 1993;123(Suppl 2): 465–468.
5. Welborn TA, Knuiman MW, Vu HT. Body mass index and alternative indices of obesity in relation to height, triceps skinfold and subsequent mortality: the Busselton health study. Int J Obes Relat Metab Disord. 2000;24(1):108–115.
6. Strain GW, Zumoff B. The relationship of weight-height indices of obesity to body fat content. J Am Coll Nutr. 1992;11(6):715–718.
7. Whitlock G, Lewington S, Sherliker P, et al; for Prospective Studies Collaboration. Body-mass index and cause-specific mortality in 900 000 adults: collaborative analyses of 57 prospective studies. Lancet. 2009; 373(9669):1083–1096.
8. Després JP, Lemieux I, Prud’homme D. Treatment of obesity: need to focus on high risk abdominally obese patients. BMJ. 2001;322(7288): 716–720.
9. Reeder BA, Senthilselvan A, Després J, et al. The association of cardiovas-cular disease risk factors with abdominal obesity in Canada. Canadian Heart Health Surveys Research Group. CMAJ. 1997;157 Suppl 1:S39–S45.
10. Perry AC, Applegate EB, Allison ML, Miller PC, Signorile JF. Relation between anthropometric measures of fat distribution and cardiovascular risk factors in overweight pre- and postmenopausal women. Am J Clin
Nutr. 1997;66(4):829–836.
11. Seidell JC, Han TS, Feskens EJ, Lean ME. Narrow hips and broad waist circumferences independently contribute to increased risk of non- insulin-dependent diabetes mellitus. J Intern Med. 1997;242(5):401–406. 12. Després JP, Nadeau A, Tremblay A, et al. Role of deep abdominal
fat in the association between regional adipose tissue distribution and glucose tolerance in obese women. Diabetes. 1989;38(3):304–309. 13. Fujioka S, Matsuzawa Y, Tokunaga K, Tarui S. Contribution of
intra-abdominal fat accumulation to the impairment of glucose and lipid metabolism in human obesity. Metabolism. 1987;36(1):54–59. 14. Seidell JC, Oosterlee A, Deurenberg P, Hautvast JG, Ruijs JH. Abdominal
fat depots measured with computed tomography: effects of degree of obesity, sex, and age. Eur J Clin Nutr. 1988;42(9):805–815. 15. Pouliot MC, Després JP, Lemieux S, et al. Waist circumference and
abdominal sagittal diameter: best simple anthropometric indexes of abdominal visceral adipose tissue accumulation and related cardiovas-cular risk in men and women. Am J Cardiol. 1994;73(7):460–468. 16. Wei M, Gaskill SP, Haffner SM, Stern MP. Waist circumference as
the best predictor of noninsulin dependent diabetes mellitus (NIDDM) compared to body mass index, waist/hip ratio and other anthropometric measurements in Mexican Americans – a 7-year prospective study.
Obes Res. 1997;5(1):16–23.
17. Kim SM, Kim SS, Youn SJ, et al. What is the best simple anthropometric indexes of abdominal visceral fat in obese patients? The Korean Journal
of Obesity. 1998;7(2):157–168. [Korean].
18. Borkan GA, Hults DE, Gerzof SG, Robbins AH. Comparison of body composition in middle-aged and elderly males using computed tomography. Am J Phys Anthropol. 2005;66(3):289–295.
19. Östman J, Efendic´ S, Arner P. Catecholamines and metabolism of human adipose tissue. Acta Med Scand. 1969;186(1–6):241–246. 20. Seidell JC, Björntorp P, Sjöström L, Kvist H, Sannerstedt R. Visceral fat
accumulation in men is positively associated with insulin, glucose, and C-peptide levels, but negatively with testosterone levels. Metabolism. 1990;39(9):897–901.
21. Willett WC, Manson JE, Stampfer MJ, et al. Weight, weight change, and coronary heart disease in women: risk within the “normal” weight range. Obstet Gynecol Surv. 1995;50(7):525–528.
22. Huang Z, Willett WC, Manson JE, et al. Body weight, weight change, and risk for hypertension in women. Ann Intern Med. 1998;128(2): 81–88.
23. Jacobs EJ, Newton CC, Wang Y, et al. Waist circumference and all-cause mortality in a large US cohort. Arch Intern Med. 2010;170(15): 1293–1301.
24. Onat A, Hergenc G, Sari I, Karabulut A, Can G. Elevated cholesterol level predicts diabetes in centrally obese women but not men: relative roles of insulin resistance and central obesity. Circ J. 2007;71(9):1463–1467.
25. Wells JC. Sexual dimorphism of body composition. Best Pract Res
Clin Endocrinol Metab. 2007;21(3):415–430.
26. Wells JC, Cole TJ, Bruner D, Treleaven P. Body shape in American and British adults: between-country and inter-ethnic comparisons. Int
J Obes (Lond). 2008;32(1):152–159.
27. Wells JC, Cole TJ, Treleaven P. Age-variability in body shape associated with excess weight: the UK National Sizing Survey. Obesity (Silver
Spring). 2008;16(2):435–441.
28. Wells JC, Griffin L, Treleaven P. Independent changes in female body shape with parity and age: A life-history approach to female adiposity.
Am J Hum Biol. 2010;22(4):456–462.
29. Wells JC, Treleaven P, Cole TJ. BMI compared with 3-dimensional body shape: the UK National Sizing Survey. Am J Clin Nutr. 2007;85(2): 419–425.
30. Wells JC, Charoensiriwath S, Treleaven P. Reproduction, aging, and body shape by three-dimensional photonic scanning in Thai men and women. Am J Hum Biol. 2011;23(3):291–298.
31. Baumgartner RN. Body composition in healthy aging. Ann N Y Acad
Sci. 2000;904:437–448.
32. Finkel D, Whitfield K, McGue M. Genetic and environmental influ-ences on functional age: a twin study. J Gerontol B Psychol Sci Soc
Sci. 1995;50(2):P104–P113.
33. Borkan GA, Norris AH. Assessment of biological age using a profile of physical parameters. J Gerontol. 1980;35(2):177–184.
34. Bae CY, Kang YG, Kim S, et al. Development of models for predict-ing biological age (BA) with physical, biochemical, and hormonal parameters. Arch Gerontol Geriatr. 2008;47(2):253–265.
35. van Leer EM, van Noord PA, Seidell JC. Components of adult height and height loss. Secular trend and effects of aging in women in the DOM project. Ann Epidemiol. 1992;2(5):611–615.
36. Galloway A. Estimating actual height in the older individual. J Forensic
Sci. 1988;33(1):126–136.
37. Cline MG, Meredith KE, Boyer JT, Burrows B. Decline of height with age in adults in a general population sample: estimating maximum height and distinguishing birth cohort effects from actual loss of stature with aging. Hum Biol. 1989;61(3):415–425.
38. Albright F, Smith PH, Richardson AM. Postmenopausal osteoporosis.
J Am Med Assoc. 1941;116(22):2465–2474.
39. Adams P, Davies GT, Sweetnam P. Osteoporosis and the effects of ageing on bone mass in elderly men and women. Q J Med. 1970;39(156): 601–615. 40. Miall WE, Ashcroft MT, Lovell HG, Moore F. A longitudinal study of
the decline of adult height with age in two Welsh communities. Hum
Biol. 1967;39(4):445–454.
41. Trotter M, Gleser G. The effect of ageing on stature. Am J Phys Anthropol. 1951;9(3):311–324.
42. Gsell O. Longitudinal gerontological research over 10 years (Basel studies, 1955–1965). Gerontol Clin (Basel). 1967;9(2):67–80. 43. Borkan GA, Hults DE, Glynn RJ. Role of longitudinal change and
secular trend in age differences in male body dimensions. Hum Biol. 1983;55(3):629–641.
44. Ribot C, Tremollieres F, Pouilles JM, et al. Risk factors for hip fracture. MEDOS study: results of the Toulouse Centre. Bone. 1993;14 Suppl 1: S77–S80.
45. Briot K, Legrand E, Pouchain D, Monnier S, Roux C. Accuracy of patient-reported height loss and risk factors for height loss among postmenopausal women. CMAJ. 2010;182(6):558–562.
46. Hannan MT, Broe KE, Cupples LA, Dufour AB, Rockwell M, Kiel DP. Height loss predicts subsequent hip fracture in men and women of the Framingham Study. J Bone Miner Res. Epub November 9, 2011. 47. Chittawatanarat K, Pruenglampoo S, Kongsawasdi S, et al. The
varia-tions of body mass index and body fat in adult Thai people across the age spectrum measured by bioelectrical impedance analysis. Clin Interv
Aging. 2011:6; 285-294.
48. Bartali B, Benvenuti E, Corsi AM, et al. Changes in anthropometric measures in men and women across the life-span: findings from the InCHIANTI study. Soz Praventivmed. 2002;47(5):336–348. 49. Broadwin J, Goodman-Gruen D, Slymen D. Ability of fat and fat-free
mass percentages to predict functional disability in older men and women. J Am Geriatr Soc. 2001;49(12):1641–1645.
50. Shon CM, Kim JH, Shin SY, Cha KC. A study of age-related patterns in body composition by segmental bioelectrical impedance analysis for Koreans. Journal of the Korean Dietetic Association. 2001;7(2):153–158. [Korean].
51. Falciglia G, O’Connor J, Gedling E. Upper arm anthropometric norms in elderly white subjects. J Am Diet Assoc. 1988;88(5):569–574. 52. Ley CJ, Lees B, Stevenson JC. Sex- and menopause-associated changes
in body-fat distribution. Am J Clin Nutr. 1992;55(5):950–954. 53. Couillard C, Gagnon J, Bergeron J, et al. Contribution of body fatness
and adipose tissue distribution to the age variation in plasma steroid hormone concentrations in men: the HERITAGE Family Study. J Clin
Endocrinol Metab. 2000;85(3):1026–1031.
54. Haarbo J, Marslew U, Gotfredsen A, Christiansen C. Postmenopausal hormone replacement therapy prevents central distribution of body fat after menopause. Metabolism. 1991;40(12):1323–1326.
Clinical Interventions in Aging
Publish your work in this journal
Submit your manuscript here: http://www.dovepress.com/clinical-interventions-in-aging-journal Clinical Interventions in Aging is an international, peer-reviewed journal focusing on evidence-based reports on the value or lack thereof of treat-ments intended to prevent or delay the onset of maladaptive correlates of aging in human beings. This journal is indexed on PubMed Central, MedLine, the American Chemical Society’s ‘Chemical Abstracts
Service’ (CAS), Scopus and the Elsevier Bibliographic databases. The manuscript management system is completely online and includes a very quick and fair peer-review system, which is all easy to use. Visit http://www.dovepress.com/testimonials.php to read real quotes from published authors.
55. Troisi RJ, Wolf AM, Mason JE, Klingler KM, Colditz GA. Relation of body fat distribution to reproductive factors in pre- and postmenopausal women. Obes Res. 1995;3(2):143–151.
56. Seidell JC, Visscher TL. Body weight and weight change and their health implications for the elderly. Eur J Clin Nutr. 2000;54 Suppl 3: S33–S39.