physiologic intestinal
18
f-fDG uptake is associated with
alteration of gut microbiota and
proinflammatory cytokine levels in
breast cancer
Hai-Jeon Yoon
1,6, Han-Na Kim
2,3,6, Ji-In Bang
1, Woosung Lim
4, Byung In Moon
4,
nam Sun paik
4, Bom Sahn Kim
1,6*& Hyung-Lae Kim
5,6*The clinical significance of physiologic Fluorine-18-fluorodeoxyglucose (18F-FDG) intestinal uptake (IU) based on the predicted link with gut microbiota dysbiosis and inflammatory cytokine production was investigated in a cohort of breast cancer patients. A total of 114 patients were visually classified into the lower or higher IU group. The maximum and mean standardized uptake values of total bowel (TB SUVmax and TB SUVmean) were measured. The gut microbial abundance of the Citrobacter genus of the Enterobacteriaceae family showed a significant positive correlation with TB SUVmax and TB SUVmean (q = 0.021 and q = 0.010). The unclassified Ruminococcaceae showed a significant negative correlation with TB SUVmax (q = 0.010). The level of tumor necrosis factor alpha (TNF-α) was significantly increased in the high IU group (p = 0.017). The TNF-α levels showed a significant positive correlation with TB SUVmax (rho = 0.220 and p = 0.018) and TB SUVmean (rho = 0.250 and p = 0.007). Therefore, our findings suggest that the physiologic intestinal uptake may reflect subclinical inflammation and differences in the composition of the gut microbiome in breast cancer patients.
Fluorine-18-fluorodeoxyglucose (18F-FDG) positron emission tomography (PET) is important for the accurate
staging and management of breast cancer. Though this modality has been widely used for the evaluation of cancer, applications for PET have expanded to non-cancer pathophysiology.
The intestine, which is involved in diverse metabolic pathways, presents a variable range of 18F-FDG uptakes
(also referred to as the “physiologic uptake”) regardless of pathologic lesions. The mechanism and clinical signif-icance of physiologic intestinal uptake are not fully understood. Recently, several studies have suggested that the gut microbiota may play a role in the physiologic intestinal uptake1–4.
The gut microbiota is a community consisting of trillions of microorganisms residing along the intestinal tract. The low or high abundance of the specific microorganisms within the community is known to induced aberrant immune responses via the stimulation of monocyte-derived proinflammatory cytokines5,6. Moreover, it
has been hypothesized that a crosstalk between microbiota and estrogen synthesis occurs, indicating that micro-bial dysbiosis may be associated with developing hormone-related breast cancer7,8.
Recently, Kang et al. reported that the physiologic intestinal uptake of 18F-FDG was associated with different
abundances of specific intestinal bacteria in healthy subjects2. They postulated that the mucosal inflammation,
impaired barrier function and gut permeability caused by the dysbiosis contributes to physiologic intestinal
1Department of Nuclear Medicine, Ewha Womans University School of Medicine, Seoul, Republic of Korea. 2Medical
Research Institute, Kangbuk Samsung Hospital, Sungkyunkwan University, School of Medicine, Seoul, Republic of Korea. 3Department of Clinical Research Design and Evaluations, SAIHST, Sungkyunkwan University, Seoul, Republic
of Korea. 4Department of Surgery, School of Medicine, Mokdong Hospital, Ewha Womans University, Seoul, Republic
of Korea. 5Department of Biochemistry, Ewha Womans University, School of Medicine, Seoul, Republic of Korea. 6These authors contributed equally: Hai-Jeon Yoon, Han-Na Kim, Bom Sahn Kim and Hyung-Lae Kim. *email:
kbomsahn@ewha.ac.kr; hyung@ewha.ac.kr
uptake. However, their work did not clearly demonstrate a link between mucosal inflammation and physiologic intestinal uptake.
Our previous study found that increases in physiologic intestinal uptake are correlated to the serum lipid profile and obesity in breast cancer patients4. We also postulated that alterations in the composition of the gut
microbiota may affect lipid metabolism and physiologic intestinal uptake. However, the details of the relationship between the gut microbiota and the physiologic intestinal uptake could not be identified. Therefore, in this study, we investigated the relationship between the composition of gut microbiota with the range of physiologic intesti-nal uptakes by using high-throughput sequencing of the 16S rRNA gene in breast cancer subjects. Furthermore, the relationship of tumor necrosis factor alpha (TNF-α) and interleukin-1 (IL-1) with the range of physiologic intestinal uptakes were also investigated. With this study, we aimed to elucidate the clinical significance of phys-iologic intestinal uptake based on the predicted link with gut microbial dysbiosis and inflammatory cytokine production in a breast cancer cohort.
Materials and Methods
Subjects.
Participants were recruited from the patients who visited our institutional PET/CT Center for their initial breast cancer staging work up. Participants who met the following inclusion criteria were enrolled in this study: (1) Patients should not have a medication history that includes lipid-lowering drugs or probiotics taken within four weeks of enrollment, as these drugs can influence the gut microbiota; (2) Patients should not have a medication history of Metformin, which can influence intestinal FDG uptake; (3) Patients should not have under-gone neoadjuvant chemotherapy before PET/CT; (4) Patients who do not have concurrent inflammatory bowel disease, infectious colitis, etc., or have taken any antibiotics within six weeks of enrollment. Stool and blood sam-ples were collected from 121 female participants between the ages of 32 and 78 who underwent a PET/CT scan between April 2016 and February 2017. Among the participants, seven patients whose samples had undetectable cytokine levels were excluded.Demographics, laboratory data, and other clinical data were extracted from the medical chart, and question-naires were taken at the time of the initial visit. This study protocol was approved by the Institutional Review Board of Ewha University Medical Center (2016-01-017-002). The informed consents were obtained from all participants of the study. We followed all applicable institutional and governmental regulations concerning the ethical use of human volunteers during the study.
DNA extraction from fecal samples.
Fecal samples were frozen immediately after defecation at −20 °C and were placed at −70 °C within 24 hours. DNA extraction from the fecal samples was performed within one month by using the MOBio PowerSoil®
DNA Isolation Kit (MO BIO Laboratories, Carlsbad, CA) following the manufacturer’s instructions.PCR Amplification and sequencing of bacterial 16S rRNA gene.
Variable V3 and V4 regions of the 16S rRNA gene were amplified with the universal primers 341F (5′ TCG TCG GCA GCG TCA GAT GTG TAT AAG AGA CAG CCT ACG GGN GGC WGC AG 3′) and 805R (5′ GTC TCG TGG GCT CGG AGA TGT GTA TAA GAG ACA GGA CTA CHV GGG TAT CTA ATC C 3′), with each primer modified to contain a unique 8 nt barcode index by combination of Nextera XT DNA Library Preparation kit (Illumina, San Diego, CA). PCR reactions contained 5 ng/μL DNA template, 2 × KAPA HiFi HotStart Ready Mix (KAPA Biosystems, Wilmington, MA) and 2 pmol of each primer. Reaction conditions consisted of an initial incubation at 95 °C for 3 min, followed by 25 cycles of 95 °C for 30 s, 55 °C for 30 s, and 72 °C for 30 s. Samples were subjects to a final extension incuba-tion at 72 °C for 5 min. After PCR clean-up and index PCR, sequencing was performed on the Illumina MiSeq platform following the manufacturer’s specifications9,10.16S rRNA gene compositional analysis.
The DADA2 pipeline within the QIIME2 package (https:// qiime2.org) was used to filter out low quality and chimera errors and generate unique sequence variants11,12. Theamplicon sequence variants (ASVs) were produced by denoising with DADA2 and regarded as 100% operational taxonomic units (OTUs). QIIME2 constructed the Feature Table, which is the equivalent of the biome table and the representative sequence file. The sequences were mapped at 99% sequence identity to an optimized version of the GreenGenes database (version 13.8) containing the V3-V4 region to determine taxonomies.
Serum cytokine analysis.
Serum concentration of TNF-α and IL-1 was measured by an enzyme-linked immunosorbent assay (ELISA). Briefly, 96-well microtiter plates were coated with the capture antibody (human IL-1β or TNF-α capture; R&D Systems) and were incubated at 4 °C overnight, then treated with blocking buffer at room temperature. Diluted test samples and standard recombinant proteins (human IL-1β or TNF-α; R&D Systems) were added to each well, followed by incubation with the biotinylated detection antibody (human IL-1β or TNF-α detection; R&D Systems). After the incubation, Streptavidin-Horseradish Peroxidase (Thermo Scientific) was added to the plates, followed by the TMB Substrate Solution (Thermo Scientific) for 30 minutes. The reaction was stopped by addition of the stopping solution and the absorbance was measured at 450 nm in a VersaMax microplate reader (Molecular Devices, LLC, USA).18
F-FDG PET/CT and image analysis.
For the 18F–FDG PET/CT analysis, patients were instructed tofast for at least six hours before intravenous FDG administration (3.7 MBq per kg) and then to rest for one hour before the scan. Fasting blood glucose levels were measured before FDG administration and confirmed to be <140 mg/dL. A CT scan without contrast agent was obtained first, and then a PET scan was obtained from the skull base to the mid-thigh, using a Siemens Biograph mCT with 128 CT slices (Siemens Medical Solutions, Erlangen, Germany). Low-dose CT was acquired under a CARE Dose system (Siemens Medical Solutions, Erlangen, Germany) and CT-based attenuation correction was performed. The spatial resolution at the center
of the PET was 2.0 mm full width at half maximum (FWHM) in the trans-axial direction and 2.0 mm FWHM in the axial direction. PET scans were acquired for 2 min per bed position (5–7 positions) with 3D emission mode. PET images were reconstructed to 200 × 200 matrices and 3.4 mm × 3.4 mm pixel size with 3.0 mm slice thickness using a 3D-OSEM iterative algorithm (2 iterations and 21 subsets) with time of flight (TOF) and point spread function (PSF).
The physiologic intestinal FDG uptake (IU) was assessed visually and quantitatively by two independent nuclear medicine specialists. The analysis was carried out in consensus, and the interpreters were strictly blinded to clinical and laboratory data. For visual assessment, the range of IU was dichotomized as low and high. Briefly, patients with lower FDG uptake of the whole intestine compared to that of the liver were classified as the lower IU group, while patients with FDG uptake of at least one bowel segment greater than that of the liver were clas-sified as the higher IU group. For quantitative assessment, the maximum and mean standardized uptake values (SUVmax and SUVmean) in different bowel segments were measured by placing a three-dimensional volume of
interest (VOI)2,4. The SUV
mean was measured with a margin threshold of 40% SUVmax. For the precise
measure-ment of IU, the placemeasure-ment of VOI was carefully determined and adjusted to avoid possible spillover uptake from neighboring tissue and intraluminal stool by simultaneous review of PET and CT slice. The small bowel IU was measured at the third duodenum, jejunum, and distal ileum loop. The large bowel IU was measured at the cecum, hepatic flexure, splenic flexure, and descending colon-sigmoid junction. Then, SUVs of different bowel segments were averaged for a measure of the total bowel IU (TB SUVmax and TB SUVmean).
Statistical analysis.
Basic statistical analyses were performed using the MedCalc software. All data were presented as mean ± standard deviations. Exploratory and differential microbial composition analyses were con-ducted in QIIME2 (version 2017.12). Microbial richness, which measures the number of distinct ASVs in each sample, was measured based on the actual number of different taxa observed in a sample (“Observed ASVs”). The alpha diversity was also measured with two non-phylogenetic methods, the Shannon index, which is measured by accounting for both evenness and richness13, and the Pielou’s evenness, which quantifies how equal thecom-munity is numerically14. Additionally, Faith’s PD index was measured to find phylogenetic difference between
ASVs15. The Kruskal-Wallis test was used to examine the differences between groups in the alpha diversity.
For the analysis of beta diversity, the dissimilarity between groups was calculated as unweighted and weighted UniFrac16 values for phylogenetic differences and compared between the IU groups using pairwise Permutational
Multivariate Analysis of Variance (PERMANOVA) with 999 permutations17. A resulting p-value of less than 0.05
was considered statistically significant.
The abundance of taxa was compared between IU groups and correlated with TB SUVmax, as well as TB
SUVmean by the generalized linear models implemented in Multivariate Association with Linear Models
(MaAsLin) packages (https://huttenhower.sph.harvard.edu/maaslin) of RStudio (version 0.98.983), considering the effects of other variables (confounders) in the study population (i.e., age and BMI)18. All analyses in MaAslin
were performed using the default options. The resulting p-values were corrected for multiple comparisons on each phylogenetic level using Benjamini-Hochberg correction (FDR). A q-value less than 0.05 was considered statistically significant.
Results
Patient characteristics.
The baseline characteristics of 114 patients are summarized in Table 1. Based on the visual grade of intestinal FDG uptake (IU), 75 participants (65.8%) were classified in the lower IU group, while 39 participants (34.2%) were classified in the higher IU group. The binary logistic regression analysis showed that none of the demographic and laboratory features we measured had a significant relationship with visually graded IUs (Table 2). Based on the quantitative assessment of IU, the overall TB SUVmax was 1.99 ± 0.57(range 0.59–5.51) and TB SUVmean was 1.65 ± 0.42 (range 0.48–3.94). According to the linear regression analysis,
Mean ± SD (range)
Age (years) 50.26 ± 9.09 (32.00–78.00) Body mass index (kg/m2) 23.61 ± 3.19 (14.40–31.60)
DM, n (%) 3 (2.63) Hypertension, n (%) 14 (12.28) Smoking status, n (%) 11 (9.65)
White blood cell (103/mm3) 6.38 ± 1.90 (2.95–14.22)
Neutrophil (%) 59.61 ± 9.98 (36.30–83.20) Lymphocyte (%) 30.74 ± 8.59 (4.70–51.90) Monocyte (%) 5.50 ± 3.80 (0.80–34.80) Platelet (109/L) 261.18 ± 55.78 (148.00–447.00) Hematocrit (%) 39.55 ± 2.65 (31.10–44.70) Fasting glucose level (mg/dL) 99.39 ± 13.21 (75.00–173.00) Triglyceride (mg/dL) 125.20 ± 71.24 (32.00–418.00) Cholesterol (mg/dL) 186.48 ± 39.99 (34.00–313.00)
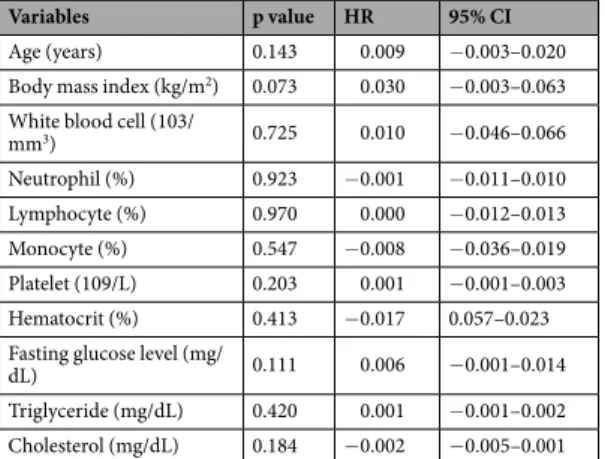
none of demographic and laboratory features measured had a significant correlation to the TB SUVmax (Table 3),
or the TB SUVmean (Table 4).
Comparison of alpha and beta diversity within and between the intestinal FDG uptake
groups.
The 16S RNA gene sequencing produced 3,809,809 sequences across 114 samples (mean of 31,266 sequences per sample). The alpha diversity of gut microbial taxa between the lower IU and higher IU groups did not show statistically significant differences in observed ASVs (116.13 ± 27.03 vs. 1092.35 ± 26.64, p = 0.235), evenness (0.80 ± 0.07 vs. 0.80 ± 0.05, p = 0.983), Shannon’s index (5.46 ± 0.71 vs. 5.41 ± 0.57, p = 0.498), and Faith’s PD (20.13 ± 2.56 vs. 20.04 ± 3.71, p = 0.682) (Fig. 1). Unweighted UniFrac-based beta diversity, which is aVariables p value Odds ratio 95% CI
Age (years) 0.651 1.010 0.968–1.054 Body mass index (kg/m2) 0.946 1.004 0.889–1.134
White blood cell (103/mm3) 0.567 1.061 0.867–1.298
Neutrophil (%) 0.676 1.008 0.970–1.048 Lymphocyte (%) 0.923 0.998 0.954–1.044 Monocyte (%) 0.150 0.837 0.656–1.067 Platelet (109/L) 0.102 1.006 0.999–1.013 Hematocrit (%) 0.045 0.858 0.738–0.997 Fasting glucose level (mg/
dL) 0.526 0.990 0.960–1.021 Triglyceride (mg/dL) 0.845 1.001 0.995–1.006 Cholesterol (mg/dL) 0.112 0.992 0.981–1.002
Table 2. Binary logistic regression analysis according to IU group.
Variables p value HR 95% CI
Age (years) 0.143 0.009 −0.003–0.020 Body mass index (kg/m2) 0.073 0.030 −0.003–0.063
White blood cell (103/
mm3) 0.725 0.010 −0.046–0.066 Neutrophil (%) 0.923 −0.001 −0.011–0.010 Lymphocyte (%) 0.970 0.000 −0.012–0.013 Monocyte (%) 0.547 −0.008 −0.036–0.019 Platelet (109/L) 0.203 0.001 −0.001–0.003 Hematocrit (%) 0.413 −0.017 0.057–0.023 Fasting glucose level (mg/
dL) 0.111 0.006 −0.001–0.014 Triglyceride (mg/dL) 0.420 0.001 −0.001–0.002 Cholesterol (mg/dL) 0.184 −0.002 −0.005–0.001
Table 3. Linear regression analysis according to TB SUVmax.
Variables p value HR 95% CI
Age (years) 0.336 0.004 −0.004–0.013 Body mass index (kg/m2) 0.246 0.015 −0.010–0.039
White blood cell (103/
mm3) 0.662 0.009 −0.033–0.051 Neutrophil (%) 0.999 0.000 −0.008–0.008 Lymphocyte (%) 0.889 −0.001 −0.010–0.009 Monocyte (%) 0.598 −0.006 −0.026–0.015 Platelet (109/L) 0.259 0.001 −0.001–0.002 Hematocrit (%) 0.402 −0.013 −0.043–0.017 Fasting glucose level (mg/
dL) 0.166 0.004 −0.002–0.010 Triglyceride (mg/dL) 0.622 0.000 −0.001–0.001 Cholesterol (mg/dL) 0.122 −0.002 −0.004–0.000
phylogenetic and qualitative index, demonstrated that there were no significant differences in distance between the lower IU and higher IU group (p = 0.102; Fig. 2A), while weighted UniFrac-based beta diversity, which is a phylogenetic and quantitative index, showed marginal significance (p = 0.062; Fig. 2B).
Association between gut microbial taxa composition and intestinal FDG uptake.
In the analysis of gut microbial abundance of patients in each of the visually graded IU groups, the genus Enterobacter, which belongs to the family Enterobacteriaceae, showed a trend of higher relative abundance in high IU group com-pared with low IU group (CE = 1.08; p < 0.001; q = 0.094; Supplement Fig. S1A). Conversely, the unclassified Ruminococcaceae trended towards being in lower relative abundance in the high IU group compared to the low group (CE = −0.386; p < 0.001; q = 0.083; Supplement Fig. S1B).Figure 1. Comparison of alpha diversity between lower and higher IU group by the Observed ASV (A),
Evenness (B), Shannon index (C), and Faith’s phylogenetic diversity (D) method.
Figure 2. Distance of beta diversity from the lower to higher IU group by unweighted UniFrac-based (A) and
Analyzing the correlation between TB SUVmax and gut microbial abundance after adjusting for age and
BMI, the Citrobacter genus showed a significant positive correlation with TB SUVmax (CE = 2.26; p < 0.001;
q = 0.021; Fig. 3A), while the unclassified Ruminococcaceae showed a negative association with the TB SUVmax
(CE = −0.536; p < 0.001; q = 0.099; Fig. 3B).
In the analysis of the correlation between TB SUVmean and gut microbial abundance, after adjustment of
age and BMI, bacterial species of the genus Citrobacter (CE = 3.38; p < 0.001; q = 0.002; Fig. 4A) and the genus
Veillonella, which belongs to the family Veillonellaceae, showed a positive correlation trend with TB SUVmean
(CE = 0.657; p < 0.001; q = 0.070; Fig. 4B). Additionally, the abundance of Ruminococcaceae was negatively cor-related with the TB SUVmean (CE = −0.729; p < 0.001; q = 0.070; Fig. 4C).
Association between pro-inflammatory cytokine level and intestinal FDG uptake.
The overall serum concentrations of TNF-α and IL-1 of all 114 patients were 0.336 ± 0.077 pg/mL (range = 0.268–0.929 pg/ mL) and 0.483 ± 0.214 pg/mL (range = 0.321–2.714 pg/mL), respectively. The levels of TNF-α were signifi-cantly increased in the high IU group compared to the low IU group (0.33 ± 0.08 [low IU] vs. 0.34 ± 0.06 [high IU], p = 0.017). Furthermore, TNF-α levels were positively correlation with the TB SUVmax (rho = 0.220 andp = 0.018), as well as TB SUVmean (rho = 0.250 and p = 0.007). However, serum IL-1 level showed no significant
relationship with the visually graded IUs (0.47 ± 0.16 [lower IU] vs. 0.49 ± 0.29 [higher IU], p = 0.382), as well as with the quantitatively measured TB SUV (rho = −0.054 and p = 0.566 [TB SUVmax]; rho = −0.032 and p = 0.737
[TB SUVmean]).
Discussion
This study investigated the correlation between physiologic intestinal uptake (IU) and the composition of the gut microbiome in breast cancer patients. In this study, we found the differences in beta diversity to be marginally significant between lower and higher IU groups. The physiologic IU was positively correlated with the relative abundance of the genus Citrobacter, while negatively correlated with the unclassified Ruminococcaceae.
Figure 3. Correlations of the TB SUVmax with Citrobacter (A) and the unclassified Ruminococcaceae (B).
Figure 4. Correlations of the TB SUVmean with Citrobacter (A), Veillonella (B), and the unclassified
The potential role of gut microbiota in intestinal 18F-FDG uptake visualized on FDG PET was initially raised
from the study by Franquet et al.1. They found that there was a significant reduction in intestinal 18F-FDG uptake
with pretreatment with rifaximin, an antibiotic agent retained in the intestinal lumen. They concluded that this reduction in uptake might reflect a reduction in luminal bacterial burden or function in response to rifaximin therapy. However, a mechanism to explain the transfer of 18F-FDG from the intravascular compartment to the gut
lumen has not yet been identified. Conversely, another recent study reported an increase of intestinal 18F-FDG
uptake after oral administration of the broad-spectrum antibiotic vancomycin3. They demonstrated an increase
in intestinal 18F-FDG uptake in all participants following vancomycin treatment that results in a four- to five-log
reduction in gut bacterial load. They explained the phenomenon as a shift in colonocyte metabolism from lipoly-sis of single chain fatty acid (mainly butyrate), normally produced by the gut microbiota, to glycolylipoly-sis.
In this study, we observed a negative correlation between the intestinal 18F-FDG uptake and the abundance
of the bacterial unclassified Ruminococcaceae. The low abundance of the Ruminococcaceae has been reported in several inflammatory disorders19,20. Ruminococcaceae contributes to butyrate production, which is the main
microbial-derived gut mucosal immunity regulator and the best indicator of a healthy, mature anaerobic gut microbiota6. Butyrate-producing bacteria have recently gained attention because of their importance in the
main-tenance of a healthy colon, and loss of this group of bacteria is associated with the development of inflammatory bowel disease, Crohn’s disease, and ulcerative colitis21. Kang et al. also reported that an increase in intestinal
18F-FDG uptake was associated with low relative abundance of the unclassified Clostridiales, which including the
family Ruminococcaceae, in healthy subjects. They suggested that the mucosal inflammation, impaired barrier function and gut permeability caused by microbial dysbiosis induced the uptake of intestinal 18F-FDG. Thus,
an increase in intestinal 18F-FDG uptake may reflect a low abundance of butyrate-producing gut microbiota,
mucosal disruption and be an early indicator for an increased risk of bowel disease.
We also found a trend of higher relative abundance of the Citrobacter spp. in high IU group, and a significant positive correlation with quantitatively measured TB SUVmax and SUVmean. The Citrobacter spp. is an aerobic
gram-negative rod often found in the human intestine. The species rarely give rise to serious infections, but are opportunistic pathogens that can lead to bacteremia22. Of the 12 recognized species within the genus Citrobacter, C. freundi is known to cause abnormal inflammatory changes in the intestinal tract22. Moreover, C. freundi has
been suspected to cause diarrhea and extra-intestinal peritonitis23. Several studies have reported the relationship
of Citrobacter with irritable bowel syndrome.
The group Veillonellaceae showed a positive correlation trend with TB SUVmean. The relationship of the
Veillonellaceae with a high-fat diet and obesity has been reported in previous studies24,25. We previously showed
that there is a significant relationship between intestinal 18F-FDG uptake and obesity and lipid metabolism4.
However, in this study, we did not find any relation between intestinal 18F-FDG uptake and obesity or lipid
metab-olism. The differences in the distribution of BMIs and lipid profiles between the two studies may be the cause of this discrepancy.
In addition to obesity, Veillonellaceae has previously been suggested to be a biomarker for inflammatory bowel disease26. A strong relationship between the increased abundance of Veillonellaceae bacteria and the occurrence
of Crohn’s disease has been reported in a large cohort of pediatric patients27. Recently, the Veillonellaceae family
was shown to promote a beneficial microenvironment for the progression of colorectal carcinoma28. Though we
did exclude patients with inflammatory bowel disease from this analysis, there may have been subclinical inflam-mation of the intestine in some cases.
When the relationship between the pro-inflammatory cytokine TNF-α with intestinal 18F-FDG uptake
was investigated, the level of TNF-α was significantly positively correlated with visually graded and quanti-tatively measured intestinal 18F-FDG uptake (both of TB SUV
max and TB SUVmean). Increased levels of this
pro-inflammatory cytokine could be a biomarker for subclinical inflammation. An important role of TNF-α as a pivotal pro-inflammatory mediator, especially in inflammatory bowel disease, has been emphasized for decades29.
Based on the significant relationship of intestinal 18F-FDG uptake with TNF-α, we believe that intestinal 18F-FDG
uptake visualized on PET can be used as an imaging biomarker for subclinical mucosal inflammation.
Unlike TNF-α, IL-1 showed no significant relationship with intestinal 18F-FDG uptake. Regarding the role
of the IL-1 family in intestinal inflammation, both pro-inflammatory and protective properties have been described. Bersudsky et al. demonstrated that, in a study of the development of colitis in mice, IL-1α played a pro-inflammatory role and that IL-1β had a protective effect on disease progression30. One of the limitations of
this current study is that only the levels of IL-1β were measured. Further studies are therefore needed to deter-mine the relationship between IL-1α and intestinal 18F-FDG uptake.
In this study, we found that the physiologic intestinal uptake of 18F-FDG was associated with changes in the
abundance of several groups of intestinal bacteria in breast cancer patients. Though the specific intestinal bacteria were different from the study by Kang et al.2, which was performed in healthy subjects, the significant positive
correlation between background IU with the genus Citrobacter and Veillonella imply that intestinal FDG uptake could potentially be used as a marker of mucosal inflammation. The negative relationship of butyrate-producing gut microbiota with intestinal 18F-FDG uptake seen in previous studies was replicated in our study. Moreover,
we demonstrated that the is a significant correlation between the pro-inflammatory TNF-α cytokine and intesti-nal 18F-FDG uptake, which further supports the link between mucosal inflammation and physiologic intestinal
uptake.
The major limitation of this study is that a direct comparison of gut microbiota between healthy subjects and cancer patients was not performed. Future work should include a comparison of the metagenomes of breast can-cer patients with that of the healthy subjects in order to determine whether these findings should be limited to cancer patients or can be expanded to the general population. Secondly, we used fecal material for metagenome analysis. It has been reported that mucosal samples may be more indicative of significant relationships than fecal samples, indicating that the bacteria residing in the mucosal layer may play a more important role in disease
etiology27. However, obtaining mucosal samples is more difficult and requires more invasive procedures than fecal
samples, which can be a limiting factor in a clinical setting. Third, we did not check each patient’s bowel habit. Whether bowel habits affect intestinal FDG uptake is controversial. Yasuda et al. suggested that the presence of constipation affected intestinal FDG uptake31, while Kim et al. reported that there was no significant difference
in intestinal FDG uptake score according to bowel habits32. They found that intense focal uptake pattern was
observed in the descending colon of constipation group and such a focal FDG accumulation was caused by stool radioactivity. In this study, we measured the physiologic intestinal FDG uptake by placing VOI to avoid focal radioactivity of stool by simultaneous review of PET and CT slice. Thus, the effect of bowel habits on background IU will be very small.
Received: 2 May 2019; Accepted: 18 November 2019; Published: xx xx xxxx
References
1. Franquet, E. et al. Rifaximin suppresses background intestinal 18F-FDG uptake on PET/CT scans. Nuclear medicine communications
35, 1026–1031 (2014).
2. Kang, J. Y. et al. Gut microbiota and physiologic bowel (18)F-FDG uptake. EJNMMI Res 7, 017–0318 (2017).
3. Boursi, B. et al. Functional imaging of the interaction between gut microbiota and the human host: A proof-of-concept clinical study evaluating novel use for 18F-FDG PET-CT. PLoS One 13 (2018).
4. Yoon, H.-J. et al. Background intestinal 18F-FDG uptake is related to serum lipid profile and obesity in breast cancer patients. PLoS One 10, e0141473 (2015).
5. Schirmer, M. et al. Linking the human gut microbiome to inflammatory cytokine production capacity. Cell 167, 1125–1136. e1128 (2016).
6. Million, M. et al. New insights in gut microbiota and mucosal immunity of the small intestine. Human Microbiome. Journal 7, 23–32 (2018).
7. Fernández, M. F. et al. Breast Cancer and Its Relationship with the Microbiota. International journal of environmental research and public health 15, 1747, https://doi.org/10.3390/ijerph15081747 (2018).
8. Zitvogel, L. et al. Cancer and the gut microbiota: an unexpected link. Science translational medicine 7, 271ps271–271ps271, https:// doi.org/10.1126/scitranslmed.3010473 (2015).
9. Fadrosh, D. W. et al. An improved dual-indexing approach for multiplexed 16S rRNA gene sequencing on the Illumina MiSeq platform. Microbiome 2, 6 (2014).
10. Kozich, J. J., Westcott, S. L., Baxter, N. T., Highlander, S. K. & Schloss, P. D. Development of a dual-index sequencing strategy and curation pipeline for analyzing amplicon sequence data on the MiSeq Illumina sequencing platform. Appl. Environ. Microbiol. 79, 5112–5120 (2013).
11. Callahan, B. J. et al. DADA2: high-resolution sample inference from Illumina amplicon data. Nature methods 13, 581 (2016). 12. Caporaso, J. G. et al. QIIME allows analysis of high-throughput community sequencing data. Nature methods 7, 335 (2010). 13. Neisser, U. Cognitive psychology: Classic edition. (Psychology Press, 2014).
14. Pielou, E. C. The measurement of diversity in different types of biological collections. Journal of theoretical biology 13, 131–144 (1966).
15. Faith, D. P. Conservation evaluation and phylogenetic diversity. Biological conservation 61, 1–10 (1992).
16. Lozupone, C., Lladser, M. E., Knights, D., Stombaugh, J. & Knight, R. UniFrac: an effective distance metric for microbial community comparison. The ISME journal 5, 169 (2011).
17. Navas-Molina, J. A. et al. In Methods in enzymology Vol. 531 371–444 (Elsevier, 2013).
18. Morgan, X. C. et al. Dysfunction of the intestinal microbiome in inflammatory bowel disease and treatment. Genome biology 13, R79 (2012).
19. Guard, B. C. et al. Characterization of microbial dysbiosis and metabolomic changes in dogs with acute diarrhea. PLoS One 10, e0127259 (2015).
20. Wang, J. et al. Gut microbial dysbiosis is associated with altered hepatic functions and serum metabolites in chronic hepatitis B patients. Frontiers in microbiology 8, 2222 (2017).
21. Geirnaert, A. et al. Butyrate-producing bacteria supplemented in vitro to Crohn’s disease patient microbiota increased butyrate production and enhanced intestinal epithelial barrier integrity. Scientific reports 7, 11450 (2017).
22. Shih, C.-C., Chen, Y.-C., Chang, S.-C., Luh, K.-T. & Hsieh, W.-C. Bacteremia due to Citrobacter species: significance of primary intraabdominal infection. Clinical infectious diseases 23, 543–549 (1996).
23. Dervisoglu, E., Yumuk, Z. & Yegenaga, I. Citrobacter freundii peritonitis and tunnel infection in a patient on continuous ambulatory peritoneal dialysis. J Med Microbiol 57, 125–127 (2008).
24. Serena, C. et al. Elevated circulating levels of succinate in human obesity are linked to specific gut microbiota. The ISME journal 12, 1642 (2018).
25. Peters, B. A. et al. A taxonomic signature of obesity in a large study of American adults. Scientific reports 8, 9749 (2018).
26. Strauss, J. et al. Invasive potential of gut mucosa-derived Fusobacterium nucleatum positively correlates with IBD status of the host. Inflammatory bowel diseases 17, 1971–1978 (2011).
27. Gevers, D. et al. The treatment-naive microbiome in new-onset Crohn’s disease. Cell Host Microbe 15, 382–392 (2014).
28. Kostic, A. D. et al. Genomic analysis identifies association of Fusobacterium with colorectal carcinoma. Genome research 22, 292–298 (2012).
29. Van Deventer, S. J. Tumour necrosis factor and Crohn’s disease. Gut 40, 443–448 (1997).
30. Bersudsky, M. et al. Non-redundant properties of IL-1α and IL-1β during acute colon inflammation in mice. Gut 63, 598–609 (2014).
31. Yasuda, S. et al. Factors influencing physiological FDG uptake in the intestine. Tokai journal of experimental and clinical medicine 23, 241–244 (1998).
32. Kim, S.-K. et al. Relationship between gastrointestinal F-18-fluorodeoxyglucose accumulation and gastrointestinal symptoms in whole-body PET. Clinical positron imaging 2, 273–279 (1999).
Acknowledgements
This research was supported by the Basic Science Research Program through the National Research Foundation of Korea (NRF), funded by the Ministry of Education (2018R1D1A1B07049400, Hai-Jeon Yoon; 2018R1D1A1B07045321, Bom Sahn Kim; 2018R1D1A1B07050067, Hyung-Lae Kim), and in part by intramural research empowerment program of Medical School, Ewha Womans University.
Author contributions
H.L. Kim and B.S. Kim supervised this study. H.J. Yoon, H.N. Kim, J.I. Bang, W.S. Lim, B.I. Moon, and N.S. Paik collected the data. H.J. Yoon, H.N. Kim, H.L. Kim, and B.S. Kim conducted the analyses and interpreted the data. H.J. Yoon and H.N. Kim drafted the manuscript. H.L. Kim and B.S. Kim critically revised the manuscript.
competing interests
The authors declare no competing interests.
Additional information
Supplementary information is available for this paper at https://doi.org/10.1038/s41598-019-54680-3.
Correspondence and requests for materials should be addressed to B.K. or H.-L.K. Reprints and permissions information is available at www.nature.com/reprints.
Publisher’s note Springer Nature remains neutral with regard to jurisdictional claims in published maps and
institutional affiliations.
Open Access This article is licensed under a Creative Commons Attribution 4.0 International
License, which permits use, sharing, adaptation, distribution and reproduction in any medium or format, as long as you give appropriate credit to the original author(s) and the source, provide a link to the Cre-ative Commons license, and indicate if changes were made. The images or other third party material in this article are included in the article’s Creative Commons license, unless indicated otherwise in a credit line to the material. If material is not included in the article’s Creative Commons license and your intended use is not per-mitted by statutory regulation or exceeds the perper-mitted use, you will need to obtain permission directly from the copyright holder. To view a copy of this license, visit http://creativecommons.org/licenses/by/4.0/.