Journal of Welding and Joining, Vol.35 No.3(2017) pp35-43
1. Introduction
Friction Stir Welding (FSW) was invented by Wayne Thomas at TWI (The Welding Institute) in the UK in 1991. FSW is a solid state joining technique which means the objects are welded together without reaching the melting point of the base material1).
The basic principle of FSW process is as follows: a non-consumable shouldered rotating tool with a pro-filed pin is plunged into the abutting faces of the work pieces results in generating frictional heating at the tool-work piece interface, leading to softening of the work piece material, producing a continuous welded joint by the linear motion along the joint line2).
The process is considered as environmentally friendly because there is neither shield gas nor melting used
dur-ing which process. Consequently, it can be used for joining the 2xxx and 7xxx aluminum alloys which are difficult to be welded by the traditional methods. Moreover, any kinds of materials, materials composites and dissimilar materials can be welded easily using this technique3).
In recent years, FSW has been applied in many in-dustries such as: aerospace, shipbuilding, railways and automotive industries4).
The microstructure evolution of aluminum friction stir welded joints is classified into four zones as follows: unaffected zone, heat affected zone (HAZ), thermo-me-chanically affected zone (TMAZ) and stirred zone. This classification is based on the effect of the heat and the plastic deformation subjected to the material5).
The main parameters which affect the microstructure and the mechanical properties of the friction stir welded
Heat Transfer Simulation and Effect of Tool Pin Profile and
Rotational Speed on Mechanical Properties
of Friction Stir Welded AA5083-O
M. M. El-Sayed*, A. Y. Shash*,†, and M. Abd Rabou*
*Mechanical Design and Production Engineering Dept., Faculty of Engineering, Cairo University, Giza 12311, Egypt
†Corresponding author : [email protected]
(Received October 2, 2016 ; Revised December 26, 2016 ; Accepted March 14, 2017)
Abstract
A 3D transient heat transfer model is developed by ABAQUS software to study the temperature distribution during friction stir welding process at different rotational speeds. Furthermore, AA 5083-O plates were joined by FSW technique. For this purpose, a universal milling machine was used to perform the welding process and a mechanical vice was used to fix the work pieces in the proper position. The joints were friction stir welded at a constant travel speed 50 mm/min and two rotational speed values; 400 rpm and 630 rpm using two types of tools; cylindrical threaded pin and tapered smooth one. At each welding condition the temperature was measured using infra-red thermal image camera to verify the simulated temperature distribution. The welded joints were visually inspected as well as by macro- and microstructure evolutions. In addition, the welded joints were mechanically tested for hardness and tensile strength. The maximum peak temperature obtained was at higher rotational speed using the threaded tool pin profile. The results showed that the rotational speed affects the peak temperature, defects formation and sizes, and the mechanical properties of friction stir welded joints. Moreover, the threaded tool gives superior mechanical properties than the tapered one at lower rotational speed.
Key Words : Friction stir welding, Transient heat transfer simulation, Mechanical properties, Defect free welds, Tool pin profile
ISSN 2466-2232 Online ISSN 2466-2100
joints are: tool design, rotational speed, welding speed, axial force, plunge depth and tool tilt angle6).
The effect of FSW parameters on the aluminum alloys friction stir welded joints have been studied by many investigators. Habba et al.7) have studied the effect of
rotational speed, welding speed and plunge depth on the mechanical properties of AA 5083-H111.The influence of tool pin profile and rotational speed on the mechan-ical properties of AA5083-H111 has been studied by Chandrashekar et al.8). Khodir et al.9) have investigated
the effect of rotational speed on the microstructure and the mechanical properties of AA 2024-T3. Also, they have reported on the effect of the rotational speed on the peak temperature of the welded joints. Mao et al.10)
have discussed the effect of both rotational and welding speeds on the microstructure and the mechanical prop-erties of AA 2060 aluminum lithium alloy. Kim et al.11)
have developed a thermo-mechanical model to simulate the temperature and strain rate distributions predicted from AA 5083-H18 friction stir welded. They also ex-perimentally measured the temperature distribution dur-ing the welddur-ing process to verify the simulated one. Therefore, the main idea of the present research is to simulate the temperature distribution during FSW proc-ess and verify these data experimentally. Furthermore, it aims to study the effect of both tool pin profile and rota-tional speed on the mechanical properties of AA5083-O friction stir welded.
2 Experimental Investigations
2.1 Finite Element Modeling
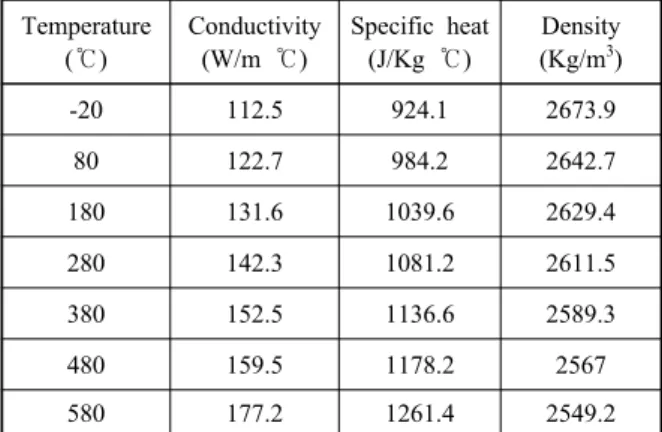
A 3D transient heat transfer finite element model was developed by ABAQUS package software to simulate the temperature distribution during FSW process. The part material is 5083 aluminum alloy with dimensions 100×50×6 mm for one piece where half of the wel- ding was simulated to reduce the running time. Table 1 shows the material temperature dependent properties of
AA5083.
The finite element modeling of FSW process in the present study is based on moving the heat source pro-duced from the friction between the tool and the work piece. The step time period used for this simulation is 60 seconds along 100 mm length of the work piece. So the travel speed of the movable heat source is
mm/sec (i.e. 100 mm/min).
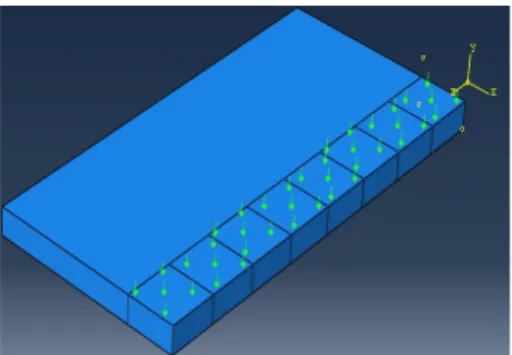
Boundary conditions: the model is completely fixed in all directions except along the welding line, where it is partially fixed as the half of the welded joint is simu-lated as illustrated in Fig. 1.
Load: the part is subjected to surface heat flux thermal load as the surface heat generated at the tool should-er-work piece interface only has been simulated while; the generated heat from the pin is not considered in this simulation.
This surface heat flux is varied with time variation where it is inserted into the modeling as a load with de-cay amplitude which starts and dede-cays with the step time. Fig. 2 shows the heat flux load subjected to the model. This surface heat flux (Q) can be computed from the following equation:
Heat flux (Q)= (W/m2) (1)
Where, the heat input is calculated from Frigard equa-tion6): Heat input (q)=
(W) (2) Temperature (℃) Conductivity (W/m ℃) Specific heat (J/Kg ℃) Density (Kg/m3) -20 112.5 924.1 2673.9 80 122.7 984.2 2642.7 180 131.6 1039.6 2629.4 280 142.3 1081.2 2611.5 380 152.5 1136.6 2589.3 480 159.5 1178.2 2567 580 177.2 1261.4 2549.2Table 1 The temperature dependent properties of AA5083
By substituting in Eq. (2) Then,
(3)Where: ω: Angular velocity (rad/sec) n: Rotational speed P =
The following assumptions are considered: Friction coefficient (μ) = 0.4 Axial force (F) = 2000 N A= π (R-r)2 mm2 Shoulder radius (R) = 12.5 mm Pin radius (r) = 4 mm Then, (4)
The heat losses from the plate surfaces to the sur-roundings due to convection and radiation effects are neglected. The heat losses due to the contact between the bottom surface of the work piece and the backing plate are also neglected as there is no backing plate in the simulation and the bottom surface is assumed to be adiabatic.
So, based on the previous assumptions the heat flux load is dependent only on the rotational speed whose values are 400 rpm and 630 rpm. Thus, there are two values of heat flux for both rotational speed values. Q = 2.5 ×10⁶W/m2 at (n = 400rpm)
Q = 4×10⁶W/m2 at (n = 630rpm)
This heat flux is moving along the welding line at a constant travel speed (Vt). This motion is simulated by
changing the heat source location according to the fol-lowing equation:
Z i+1= Z i + V t ∆t (5)
Where; Δt: the time required for the tool to travel from
location Z i to Z i+1, (i.e. element size).
Vt : the tool travel speed.
It is worth nothing that eq. 4 is used for calculating the frictional heat generated from the tool shoulder only. This heat is transferred to the work piece following the Fourier law of heat conduction as follows12):
T t y p x y z T T T C K K K x x y z z ρ ∂∂ =∂∂ ⎝⎜⎛ ∂∂ ⎟⎞⎠+∂∂ ⎜⎛ ∂∂ ⎟⎞+∂∂ ⎜⎛⎝ ∂∂ ⎟⎞⎠ ⎝ ⎠ (6) Where, ρ: The density cp: The specific heat
K: The heat conductivity T: The temperature T: The time
x, y, and z are the spatial coordinates.
Meshing: The element type is heat transfer DCC3D8 with 8-node convection/diffusion brick. The meshing of the part is shown in Fig. 3.
2.2 Welding Process and Operation Conditions
The tool material used for the present research is K720 tool steel with hardness value 57 HRC after heat treatment. There are two shouldered tools with different pin profiles; cylindrical threaded pin profile and tapered smooth one. The tools shoulder diameter is 25 mm and the cylindrical threaded pin is M8 × 5.7 mm Fig. 4.a while, the tapered one is 8 mm top diameter and 4 mm bottom diameter with the same height 5.7 mm Fig. 4.b. The work piece material is AA5083-O with dimensions of 100×50×6 mm which is the half of the welded joint. Tables 2 and 3 show the material chemical composition and the mechanical properties respectively. FSW proc-ess was performed on a universal milling machine and the work pieces were fixed in the proper position by a mechanical vice as shown in Fig. 5. The welding proc-ess was carried out at several conditions which are sum-marized in table 4. At each operation condition the tem-Fig. 2 Heat flux load subjected to the model
perature was measured using infra-red thermal image camera Fig. 6 to verify the simulated temperature dis-tribution obtained from the finite element model.
2.3 Material Characterization
A rectangular specimen was cut out from each friction stir welded joint perpendicular to the welding line. The
surfaces of all specimens were grinded, polished and etched using Poulton’s reagent [2ml HF, 3ml HCl, 20ml HNO3, 175ml H2O] for examination of both macro- and
microstructure evolutions. The microstructure examina-tion was carried out using an OLYMPUS optical metal-lurgical microscope.
2.4 Mechanical Properties
The mechanical properties, mainly tensile strength and hardness, were measured for each sample.
2.4.1 Microhardness test
A rectangular specimen was cut out from each friction stir welded joint perpendicular to the welding line. The microhardness tests were conducted on a Zwick / Roell hardness testing machine under 10 kgf load. The meas-urements were conducted along the line at mid-thick-ness position of the cross section which is normal to the welding line.
2.4.2 Tension test
Three tension test samples were taken from each weld-ed joint and machinweld-ed according to ASTM standard di-mensions as shown in Fig. 7, then tested on a universal
(a) Threaded pin ( b) Tapered pin
Fig. 4 Tools geometries
Tool
Work piece Vice
Fig. 5 Machine set-up
Si Fe Cu Mn Mg Zn Ni Pb Sn Al
0.1737 0.2867 <0.001 0.4623 4.298 0.0075 <0.005 <0.002 <0.002 Balance
Table 3 The mechanical properties of AA5083-O
Ultimate tensile strength (σu) [MPa] Yield strength (σy) [MPa] Elongation (%) Vickers Hardness (HV)
275 176 14 75
Table 4 The welding operation conditions
Process parameters Tool pin profile Welding speed (mm/min) Rotational speed (rpm) Tool tilt angle (°)
Value Cylindrical Threaded and
Tapered smooth 50 400 and 630 0
Table 2 The chemical composition of AA5083-O
testing machine and the average value was calculated for each welded joint.
3. Results and Discussions
3.1 Simulated and Measured Temperature Distribution
After running the heat transfer job for both loads, re-sults are obtained and a path is drawn perpendicular to the welding line to graph the temperature distribution. Fig. 8 shows the simulated temperature profiles at 400 rpm and 630 rpm. While Fig. 9 plots the temperature gradient versus the distance from the weld center line at both rotational speed values. As can be seen from this figure, the simulated peak temperature in the case of 630 rpm is higher than that obtained in the case of 400 rpm due to the higher heat flux value.
On the other hand, the welding temperatures which
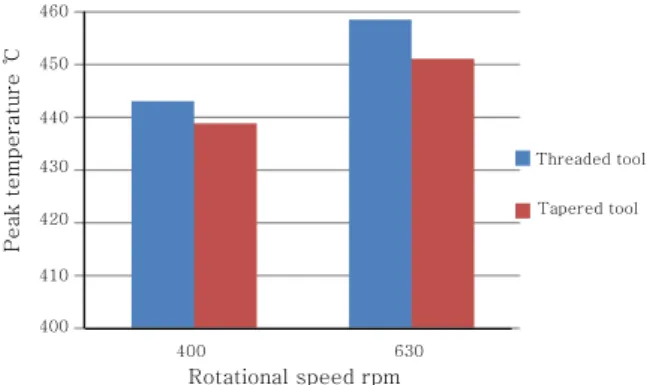
had been experimentally measured at both rotational speed values were compared with the simulated ones as illustrated in Fig. 10. From the resulting plot, it can be noted that the simulated peak temperatures and the measured ones are near to each other with an error 1.38% in the case of 400 rpm and about 3.2% in the case of 630 rpm. Fig. 11 represents the effect of the tool pin profile and the rotational speed on the welding peak temperature. As observed from this figure, the welding peak temperature increases with increasing the rota-tional speed for the same tool pin profile. It is worth nothing that the welding peak temperatures obtained by the threaded tool pin profile are higher than those ob-tained by the tapered one at both rotational speed values due to the higher stirring action of the threaded pin.
3.2 Surface Morphology
The upper surface macrographs of the welded joints are depicted in Fig. 12. It is clear from the figure that all the welded joints have an acceptable surface appearance where there are neither grooves nor surface-open tunnel defects. While the surfaces of the welded joints at
high-R6
100
6
30
10
Fig. 7 Schematic drawing of tension test specimen (Thickness = 6mm)
(a) At 400 rpm
(b) At 630 rpm
Fig. 8 Temperature profile
500 400 300 200 100 0 0 10 20 30 40 50
Distance from weld center line mm
Temperature (℃) 448.2 (a) At 400 rpm 473.5 500 400 300 200 100 0 T e mp era tu re (℃ ) 0 10 20 30 40 50
Distance from weld center line mm (b) At 630 rpm
Fig. 9 Simulated Temperature distribution at different rotational speeds
er rotational speed (i.e.630 rpm) are rougher than those welded at lower speed (i.e.400 rpm).
3.3 Macro- and Microstructure Evolutions
Fig. 13 shows the macro- and microstructure evolu-tions of the welded joints by the threaded tool pin pro-file at both rotational speed values. It is observed that
the welded joint at 400 rpm is defect free and the onion rings are observed in the nugget zone as can be seen in Fig. 13.a. While tunnel defect is detected in the nugget
Distance from weld center line mm
0 10 20 30 40 50 500 400 300 200 100 0 Tempe rature (℃ ) 400RPM Simulated Measured (a) At 400 rpm
Distance from weld center line mm
0 10 20 30 40 50 500 400 300 200 100 0 Temperatur e (℃) 630RPM Simulated Measured (b) At 630 rpm
Fig. 10 Comparison between the simulated and the measured temperature distribution at different rotational speeds 460 450 440 430 420 410 400 400 630 Rotational speed rpm Threaded tool Tapered tool Peak t emper atur e ℃
Fig. 11 The effect of tool pin profile and rotational speed on the measured welding peak temperature
(a) Threaded tool, 400 rpm
(b) Threaded tool, 630 rpm
(c) Tapered tool, 400 rpm
(d) Tapered tool, 630 rpm
Fig. 12 Surface macrographs at different tool pin profiles and rotational speeds
5mm 100㎛ Onion rings (a) At 400 rpm 100㎛ 5mm 100㎛ Tunnel defect (b) At 630 rpm
Fig. 13 Macro- and microstructure evolutions of the weld-ed joint by threadweld-ed tool pin profile
zone of the welded joint at 630 rpm as indicated in Fig. 13.b. On the other hand, Fig. 14 represents the macro- and microstructure evolutions of the welded joints by the tapered tool pin profile at both rotational speed values. From this figure it can be seen that the tunnel defect is detected in the weld nugget at both rotational speed values. As is clear from this figure, the increase of rotational speed value results in increasing the tunnel defect size where the tunnel defect size which has been detected at 630 rpm is bigger than the other which has been detected at 400 rpm.
3.4 Mechanical Properties
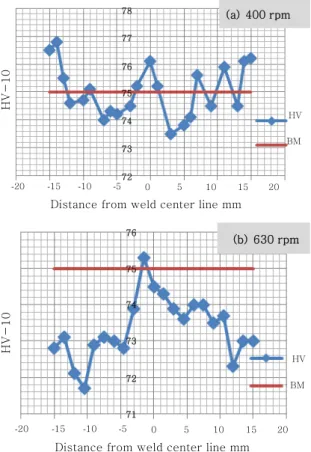
Fig. 15 represents the Vickers microhardness profile of the welded joints by the threaded tool. It is clear from the figure that at 400 rpm Fig. 15.a the hardness values in the welding zone are greater than the base material hardness value due to finer and equiaxed grains. While at 630 rpm Fig. 15.b almost hardness values in the weld-ing zone are lower than the base material due to grains coarsening and growth. On the other hand, Fig. 16 shows the Vickers microhardness profile of the welded joints by the tapered tool. As observed from this figure, at 400 rpm some of hardness values in the welding zone lie be-low the base material line Fig. 16.a while, at 630 rpm all the hardness values are lower than the base material Fig. 16.b. This refers to poor stirring action of the
ta-5mm 100㎛ Tunnel defect (a) At 400 rpm 100㎛ 5mm 100㎛ Tunnel defect (b) At 630 rpm
Fig. 14 Macro- and microstructure evolutions of the weld-ed joint by taperweld-ed tool pin profile
86
Distance from weld center line mm
HV-10 84 82 80 78 76 74 20 15 10 5 0 5 10 15 20 HV BM (a) 400 rpm 77 76 75 74 73 72 71 70 69
Distance from weld center line mm
20 15 10 5 0 5 10 15 20 HV -1 0 (b) 630 rpm HV BM
Fig. 15 Vickers microhardness profile of the welded joints by threaded tool pin profile
78 77 76 75 74 73 72
Distance from weld center line mm
20 15 10 5 0 5 10 15 20 HV -1 0 HV BM (a) 400 rpm 76 75 74 73 72 71
Distance from weld center line mm
20 15 10 5 0 5 10 15 20 HV BM (b) 630 rpm HV -10
Fig. 16 Vickers microhardness profile of the welded joints by tapered tool pin profile
pered tool pin profile which results in bigger grains sizes.
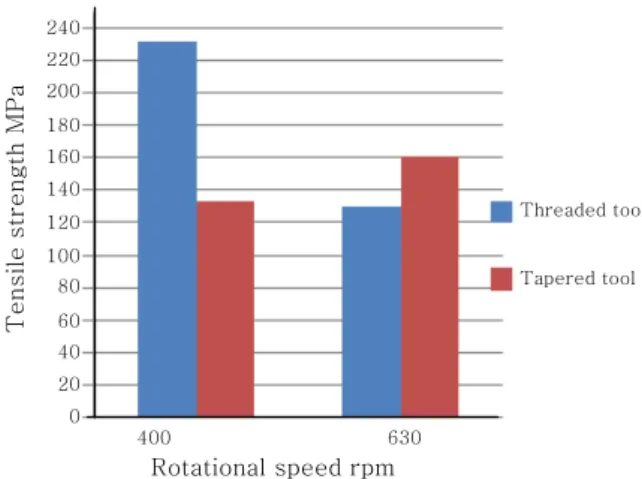
Moreover, the tension test was performed on a compu-terized universal testing machine and the average ten-sile strength value of three specimens was calculated for each welded joint. Fig. 17 illustrates the effect of tool pin profile and rotational speed on the tensile strength values. From the resulting plot represented in this figure, it is observed that the best tensile strength value is at 400 rpm using the threaded tool pin profile. It is worth nothing that at higher rotational speed, using the tapered tool pin profile is better than using the threaded one. Furthermore, rotational speed has a great effect on the tensile strength value in the case of thread-ed tool while, it has a smaller effect in the case of ta-pered tool.
4. Conclusions
From the finite element modeling and the examina-tions that have been conducted, it is possible to con-clude that:
1) In the finite element modeling, the increase of rota-tional speed results in increasing the heat flux subjected to the model, leading to increasing the simulated peak temperature.
2) The peak temperatures obtained from the heat trans-fer model match the peak temperatures measured using IR thermal image camera with an error 1.38% at 400rpm and 3.38% at 630 rpm. Therefore, this finite element model can be used for predicting the welding peak tem-perature during FSW process.
3) The peak temperature during FSW increases with increasing the rotational speed for the same tool. Furthermore, the peak temperatures obtained using the threaded tool pin profile are higher than those obtained using the ta-pered one at the same rotational speed.
4) The defect free weld was obtained at 400 rpm using the threaded tool pin profile while, using the tapered tool produces defected welded joints at both rotational speed values.
5) For the same tool, the hardness values in the weld-ing zone obtained at 400 rpm are better than those ob-tained at 630 rpm. While at the same rotational speed, the hardness values in the welding zone obtained in the case of threaded tool are better than those obtained in the case of tapered tool.
6) The best tensile strength value was obtained at 400 rpm using the threaded tool pin profile. Moreover, the tensile strength decreases with increasing rotational speed in the case of threaded tool while, it increases with in-creasing rotational speed in the case of tapered tool.
References
1. FSW-Technical-Handbook, ESAB, Welding Automation, SE-695 81 LAXÅ, Sweden (2002)
2. Thomas W. M, Johnson K. I and Wiesner C.S., Friction stir welding-Recent developments in tool and process technologies, Advanced Engineering Materials, 5(7) (2003), 485-490
3. Mishra R.S and Ma Z.Y., Friction stir welding and proc-essing, Materials Science and Engineering, 50 (2005), 1-78
4. Rao M. S., Prakash K. J., Kumar B. V. R., A review of friction stir welding process and its variables, International Journal of science and Research (IJSR), 2 (3) (2013), 375-379 5. Threadgill P. L., Leonard A. J., Shercliff H. R. And Withers
P. J., Friction stir welding of aluminum alloys, International Materials Reviews. 54 (2) (2009), 49-93
6. Prasanna P., Penchalayya Ch. And Rao D.A., Effect of tool pin profiles and heat treatment process in the fric-tion stir welding of AA 6061, American Journal of Engineering Research (AJER), 2 (1) (2013), 7-15 7. Habba M.I.A., Ahmed M.M.Z., Mohamed A.Y.A And
EL-Nikhaily A., Effect of friction stir welding parame-ters on the mechanical properties of AA5083-H111, Proceedings Of The 10th International Friction Stir Welding
Symposium, Beijing, China (2014)
8. Chandrashekar A., Reddappa H. N. and Ajaykumar B. S., Influence of tool profile on mechanical properties of friction stir welded aluminum alloy 5083, International Journal of Chemical, Molecular, Nuclear, Materials and Metallurgical Engineering, 10 (1) (2016), 8-14
9. Khodir S.A., Shibayanagi T. and Naka M., Microstructure and mechanical properties of friction stir welded AA2024- T3 aluminum alloy, Materials Transactions, 47(1) (2006), 185-193
10. Mao Y., Ke L., Liu F., Huang C., Chen Y. and Liu Q., Effect of welding parameters on microstructure and mechanical properties of friction stir welded joints of 2060 aluminum lithium alloy, International Journal of Advancing Manufacturing Technology, 81 (2015), 1419-1431
240 220 200 180 160 140 120 100 80 60 40 20 0 400 630 Rotational speed rpm Threaded tool Tapered tool Tensile strength M P a
Fig. 17 Tensile strength variation due to changing rota-tional speed and tool pin profile
11. Kim D., Badarinarayan H., Kim J. H., Kim C., Okamoto K., Wagoner R.H., Chung K., Numerical simulation of friction stir butt welding process for AA5083-H18 sheets, European Journal of Mechanics A/Solids, 29 (2010), 204-215
12. Kıral B. G., Tabanoglu M. And Serindag H. T., Finite Element Modeling of Friction Stir Welding in Aluminum Alloys Joint, Mathematical and Computational Applications, 18 (2) (2013), 122-131