FIELD VELOCITY RESISTIVITY PROBE
JONG-SUB LEEi), HYUNG-KOO YOON ii) and YONG-KYU CHOI iii)ABSTRACT
The void ratio and elastic moduli are design parameters used in geotechnical engineering to understand soil behavior. Elastic and electromagnetic waves have been used to evaluate the various soil characteristics due to high resolution. The objective of this study is to evaluate the void ratio and elastic moduli based on elastic wave velocities and electrical resistivity. The Field Velocity Resistivity Probe (FVRP) is developed to obtain the elastic and electromagnetic wave profiles of soil during penetration. The Piezoelectric Disk Elements (PDE) and Bender Elements (BE) are used as transducers for measuring the elastic wave velocities such as compressional and shear wave velocities. The Electrical Resistivity Probe (ERP) is also installed for capturing the electrical resistivity profile. The application test is carried out on the southern coast of the Korean peninsula. The field tests are performed at a depth of 6~20 m, at 10 cm intervals for measuring elastic wave velocities and at 0.5cm intervals for measuring electrical resistivity. The elastic moduli such as constraint and shear moduli are calculated by using measured elastic wave velocities. The void ratios are also evaluated based on the elastic wave velocities and the electrical resistivity. Furthermore, the converted void ratios by using FVRP are compared with the volumetric void ratio obtained by a standard consolidation test. The comparison shows that the void ratios based on the FVPR match the volume based void ratio well. This study suggests that the FVRP may be a useful device to effectively determine the elastic moduli and void ratio in the field.
Key Words : Compressional wave, Elastic moduli, Electrical resistivity, Shear wave, Void ratio 1 INTRODUCTION
The soil behavior is defined in terms of the various parameters including the shear modulus, constraint modulus and void ratio. Thus, the accurate evaluation of stiffness and void ratio is important to understand the soil behavior and determine design parameters for the geotechnical structure. Several laboratory tests have been carried out to estimate the soil parameters.
The elastic moduli and void ratio, however, are affected by the specimen condition in the laboratory test. The specimen can be easily disturbed during sampling due to the stress relief and vibrations produced while conveying to the laboratory (Santagata and Germaine 2002). Field tests may be recommended for obtaining more reliable parameters. The field test also has several limitations such as an expensive method and it decreases the resolution. Furthermore, the in-situ testing method, which can simultaneously produce the constraint and shear moduli, and the void ratio, may be insufficient. Thus, a new in-situ method with inexpensive and high resolution is necessary to obtain reliable elastic moduli and void ratio.
The Field Velocity Probe (FVP) has already been developed (Yoon et al. 2008) to obtain a dynamic design parameter such as shear modulus at the small-strain by using shear wave velocity. The measured
shear wave velocity obtained by FVP was verified with those determined by crosshole and downhole tests (Lee et al. 2010). Also Lee et al. (2008) introduced the Electrical Resistivity Probe (ERP) to measure the electrical properties of soil. The study shows the inverse relationship between measured electrical resistivity and void ratio.
The goal of this study is the development and application of a Field Velocity Resistivity Probe (FVRP) that combines both FVP and ERP. Thus, the FVRP can measure the compressional and shear wave velocities and electrical resistivity of soil. Note that the compressional and shear wave velocities produce constraint modulus (M), shear modulus (Gmax) and void
ratio and the electrical resistivity yields the void ratio. This paper introduces a new apparatus, the Field Velocity Resistivity Probe (FVRP), and describes the design consideration, the evaluation methods of the elastic moduli and void ratio, and application tests.
2 ELASTIC MODULI AND VOID RATIO 2.1 Elastic moduli
The elastic moduli such as Young’s modulus (E), bulk modulus (B), constraint modulus (M), and shear modulus (G) are necessary to understand the soil
i) Associate Professor, School of Civil, Environmental and Architectural Engineering, Korea University, Seoul 136-701, Korea.
ii) Ph.D. Candidate, School of Civil, Environmental and Architectural Engineering, Korea University, Seoul 136-701, Korea.
behaviors to evaluate the settlement of soft soils, estimate the ground improvement and design the foundation. The elastic modulus has been estimated by using the slope of the stress-strain curve in the elastic deformation region in the isotropic linear elastic condition (Mavko et al. 2003). Furthermore, the constraint (M) and shear moduli (Gmix) under small
strain conditions are commonly defined as the following equations: 2 P V M =ρ⋅ (1) 2 S V G=
ρ
⋅ (2)where VP and VS are the compressional and shear wave
velocities, respectively, and the ρ denotes the mass density of the medium.
2.2 Void ratio
The void ratio influences various characteristics such as physical and hydraulic behaviors in soft clay and it also affects the assessment of the relative density in sand. Thus, the void ratio is a fundamental value to understand the soil behaviors and characteristics.
2.2.1 Volume based void ratio
The volume based void ratio (e) is defined as the ratio of the void volume (VV) to the solid volume (VS),
e=VV/VS. The void ratio is also represented by using
the degree of saturation (S) and specific gravity (Gs) as
follows: S G w e= ⋅ s (3)
2.2.2 Elastic wave based void ratio
Various studies have been carried out for defining the characteristics of wave propagation using compressional and shear waves (Biot 1956; Klimentos and McCann 1990; Berryman 1999; Foti 2002). In particular, Gassmann (1951) suggested that the shear modulus of the saturated soil mixture (Gmix) is similar
to the shear modulus of the skeleton (Gsk) at low
frequency:
sk
mix G
G = (4)
Santamarina et al. (2001) rearranged the constraint modulus of the mixture in terms of the bulk modulus of the mixture (Bmix) and the shear modulus of the
skeleton (Gsk) as shown in Equation (5)
sk mix mix B G M 3 4 + = (5)
The bulk modulus of the mixture (Bmix) incorporates
the volumetric deformation due to the effective stress
changes (Gassmann 1951) as follows
2 2 1 ) 1 ( g sk g f g sk sk mix B B B n B n B B B B − − + − + = (6)
where Bg, Bf, and Bsk are the bulk moduli of the grain,
the fluid, and the skeleton, respectively, and n is the porosity. Thus, the porosity can be described from Equation (6) SK g f g SK mix g f mix g mix f SK mix g f g f SK f g B B B B B B B B B B B B B B B B B B B B B n ⋅ ⋅ + ⋅ − ⋅ ⋅ − ⋅ ⋅ ⋅ + ⋅ ⋅ − ⋅ ⋅ − ⋅ = 2 2 2 (7)
The bulk modulus of the mixture Bmix is defined as the
relationship between elastic wave velocities such as the compressional and shear wave velocities, and mass density as in the following Equation
) 3 4 ( P2 S2 mix V V B =
ρ
⋅ − ⋅ (8) Thus, the porosity can be calculated by using Equations (7) and (8) with measured compressional and shear wave velocities. The calculated wave based porosity is easily converted into the void ratio:n n e − = 1 (9)
where e and n denote the void ratio and porosity, respectively.
2.2.3 Electrical resistivity based void ratio
The electrical conductivity of soil is affected by the electrical conductivity of an electrolyte, the conductivity of a soil particle, the specific surface of a soil particle, the porosity, double-layer thickness, and the degree of saturation (Kim et al. 2010). The electrical conductivity of an electrolyte in seashore soils is more significant than the electrical conductivity of a soil particle due to high salinity. The double layer is related to the electrolyte solution concentration (Mitchell and Soga 2005). Thus, the electrical conductivity of saturated soils with highly conductive electrolytes is mainly affected by the conductivity of the electrolytes and the porosity. The electrical resistivity, which is the reciprocal of the electrical conductivity, is organized as the following equation:
water m mix a n
μ
μ
= ⋅ − ⋅ (10)where, μmix and μwater are the resistivities of the soil
mixture and pore water, respectively, and n is the porosity. The electrical resistivity based void ratio may be calculated by using the relationship between void ratio and porosity as in Equation (9).
The parameters a and m are empirical constants called the tortuosity and shape factors, respectively. Jackson et al. (1978) and Campanella and Weemees (1990) suggested that the tortuosity factor (a) is a unit value for normally consolidated (NC) clay and unconsolidated soil. Furthermore, the ranges of the shape factor (m) are generally proposed as 1.3~1.6, 1.5~2.3 and 1.8~3.0 for sand, heterogeneous sediment and clay, respectively (Jackson et al. 1978; Salem 2001).
3 FIELD VELOCITY RESISTIVITY PROBE 3.1 Shape
The shape of the FVRP is similar to that of the Field Velocity Probe (FVP), which was designed to measure shear wave in soft soils. An extensive explanation of details about the FVP can be found in Lee et al. (2010).
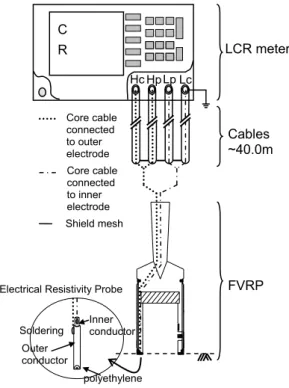
The FVRP is developed with the concept of a combination of both FVP for measuring elastic wave velocities and Electrical Resistivity Probe (ERP) for obtaining the electrical resistivity. Schematic drawings of the FVRP are presented in Figure 1. The dimensions of the FVRP are 269 mm in length and 85 mm in width.
Figure 1. Schematic drawing of the FVRP: (a) side view (0o); (b) side view (90o). The units are mm. The
BE, PDE and ERP denote the bender elements (for S-waves), the piezoelectric disk elements (for P-S-waves), and the electrical resistivity probe (for electrical resistivity), respectively.
The FVRP consists of one blade and two frames on both sides as shown in Figure 1. The blade and frames are designed to be a wedged and tapered shape to minimize the soil disturbance during penetration. Thus, the thickness of the frame is 10mm at the location of the connection with the blade, and it decreases to 6mm at the tip, as shown in Fig. 1(b). The connection rod is
welded onto the blade to easily penetrate into the soil using the penetrometer rig. The transducers for measuring elastic wave velocities such as the Piezo Disk Element (PDE) and Bender Element (BE) are installed at the end of the frame to measure the horizontally propagating waves. The Electrical Resistivity Probe (ERP) is also installed at the tip of the FVRP. The blade and frames of the FVRP are made of stainless steel to sustain the mechanical strength during penetration.
3.2 Transducers Installation
The Piezo Disk Elements (PDE) and the Bender Elements (BE) are adopted as transducers for generating and detecting the compressional and shear waves, respectively. The PDE (basis diameter = 19mm), which consists of a single-layer of piezoelectric material, is sliced to fit into the frame which has the tapered shape. The dimensions of the BE, which has a double-layer piezoelectric system, are 7.0 mm in width, 0.5 mm in thickness, and 2.0 mm in cantilever length. The transducers are installed at the end of the frames by using the mixtures of silicon and epoxy to enhance the impedance mismatch between transducers and frame. The mixtures also reduce the directly transmitted noises.
The PDE and BE are connected to coaxial cables, coated with epoxy, and shielded with conductive paint. The conductive paint is then grounded to the outer cable in order to minimize electrical noise and interference.
3.3 Electrical Resistivity Probe Installation
The Electrical Resistivity Probe (ERP) is used to measure the electrical resistance of soil. The ERP is the two-electrode type as shown in Figure 2. The diameters of the inner and outer electrodes are 0.6mm and 2.0mm, respectively and the length is about 10mm. The polyethylene is filled into the space between the inner and outer electrodes to restrict the short circuit.
4 MEASUREMENT SYSTEM 4.1 Elastic wave velocities
The function/arbitrary waveform generator is used for generating the single sinusoidal signal. The appropriate input frequency is determined by the resonant frequency of the transducer and soil for separating and removing mechanical vibration. The propagated waves are filtered and amplified by a filter-amplifier (Krohn-Hite 3364), and are digitized and recorded by an oscilloscope (Agilent 54624A). The 1024 signals are stacked to remove the uncorrelated high frequency noise.
(a) (b) 30 13 23 11 11 25 10 65 10 Connection rod 10 12 6 PDE BE ERP
Figure 2. Four-terminal pair configuration of the Electrical Resistivity Probe (ERP) in the FVRP.
4.2 Electrical resistivity
The four-terminal pair configuration is applied for connecting the electrical cables (coaxial cables) into the ERP as shown in Figure 2. The inner conductor is connected with high current (Hc) and high potential (Hp). The outer conductor is welded to the low current (Lc) and low potential (Lp). Furthermore, the ground cables of the coaxial cables are connected together to minimize the electrical noise.
Figure 3. Frequency sweeping (HP 4192A Low Frequency Impedance analyzer: input=1.0V, 17°C). ζ denotes the electrical conductivity.
The LCR meter was used to obtain the electrical resistance and the measured value was converted into electrical resistivity (See details in Kim et al. 2010). The frequency sweeping was carried out by using an
HP 4192A low-frequency impedance analyzer at the frequency range of 10-1000 kHz to determine the appropriate input frequency. Figure 3 shows the result of frequency sweeping with the various electrical conductivities. The input voltage was applied at 1.0V. The constant resistance appeared at around 100kHz. Thus, the input frequency was determined to be 100kHz.
5 APPLICATION TEST 5.1 Field condition
The application test of FVRP was carried out on the southern coast of the Korean peninsula (Kwang Yang) as shown in Figure 4.
Figure 4. Location of testing site.
The Standard Penetration Test (SPT) and the Cone Penetration Test (CPT) were carried out to investigate the subsurface soil conditions. The undisturbed soil specimens were also extracted for performing laboratory tests to estimate the soil properties at the depths of 16m and 20m.
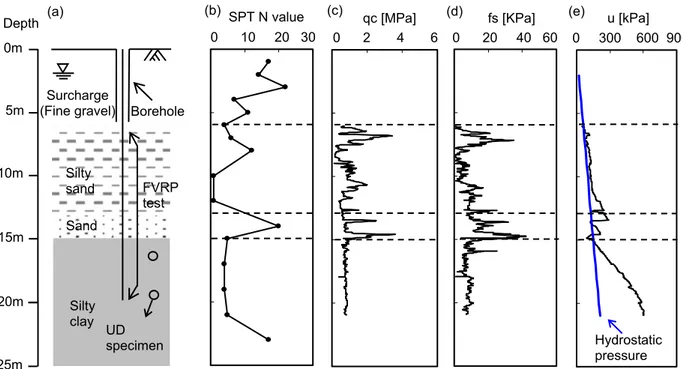
Figure 5(a) shows that the subsurface soils consist of surcharge at a depth of 0~6 m, a silty sand layer at a depth of 6~13 m, a sand layer at 13~15 m, and a silty layer. The measured N-values through the SPT test are less than 15 at a depth of 5~12 m in the silty sand layer and at a depth of 15~21 m in the silty clay layer. At a depth of 13~15 m in the sand layer, the SPT N-value is greater than 20 (Figure 5(b)). The results of the CPT test such as cone tip resistance, sleeve friction and pore water pressure are plotted in Figures 5(c), 5(d), and 5(e), respectively. The variation of the cone tip resistance is similar to that of the SPT N-value. The trends of the cone tip resistance and the friction sleeve are also similar. Soldering Hc Hp Lp Lc LCR meter C R Cables ~40.0m FVRP Core cable connected to outer electrode Core cable connected to inner electrode Shield mesh
Electrical Resistivity Probe Inner conductor Outer conductor polyethylene ζ= 32.2 mS/cm ζ= 8.05 mS/cm ζ= 16.1 mS/cm Frequency f [kHz] Resist anc e R [ Ω ] 10000 100 1 10 100 1000 Seoul Kwang Yang Test location
Figure 5. Soil profile and in situ test results: (a) Schematic soil profile; (b) SPT profile; (c) Cone tip resistance; (d) Friction sleeve; (e) Pore water pressure.
The natural soil properties of the Kwang Yang site are presented in Table 1 and the results of the standard consolidation tests by using undisturbed soil specimens are also shown in Figure 6.
The standard consolidation tests were carried out to determine the volume based void ratio with consideration of in-situ effective stress. The void ratios were estimated to be 0.75 and 0.68 at the depths of 16m and 20m, respectively.
Table 1. Natural soil properties of the Kwang-Yang site.
5.2 Results
The hole for protecting and penetrating the FVRP was drilled at the depth of 6m and the stiff casing was then installed. The hydraulic drilling rig pushed the FVRP into the ground with the penetration rate of 2.0 cm/sec. The penetration test was carried out at a depth of 6~20 m. The measuring interval of elastic wave and electrical resistivity is every 10 cm and 0.5 cm, respectively.
Figure 6. Results of standard consolidation test: (a) 16m; (b) 20m. Depth (m) Liquid Limit LL (%) Plastic Limit PL (%) Plasticity Index PI (%) Specific Gravity GS USCS 16m 36.4 24.5 11.9 2.61 ML 20m 40.3 25.4 14.9 2.63 ML 0.75 (a) V oid ratio e 1.2 1.0 0.8 0.6 0.4 1 10 100 1000 log p′ [kPa] 0.68 (b) V oid ratio e 1.2 1.0 0.8 0.6 0.4 1 10 100 1000 log p′ [kPa] qc [MPa]
(c) (d) fs [KPa] (e) u [kPa]
Hydrostatic pressure Borehole Depth 5m 10m 15m 20m 0m 25m Surcharge (Fine gravel) Silty sand FVRP test Sand Silty clay UD specimen (a) (b) SPT N value 0 10 20 30 0 2 4 6 0 20 40 60 0 300 600 900
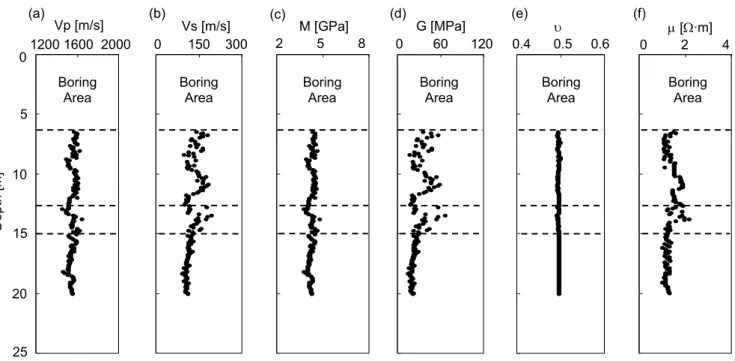
The compressional wave and shear wave velocities are calculated in the range of 1470~1650 m/s and 90~180m/s, respectively, by using the first arrival time and travel distance (See details in Lee and Santamarina 2005). The constraint and shear moduli under small strain condition, and Poisson’s ratio are also determined through the measured elastic wave velocities. The calculated Poisson’s ratio based on the elastic wave velocities is about 0.5 because the soils were fully saturated. The measured electrical resistance was converted into electrical resistivity (See details in Kim et al. 2010). The value shows the range of 1.0 Ω⋅m to 2.1 Ω⋅m. The results of the field penetration test are plotted in Figure 7. Figure 7 presents the variation at the depths of 6~13m and 13~15m. A larger variation in these layers was also observed in the SPT N-value and CPT qc profiles.
The elastic wave and electrical resistivity based void ratio was evaluated by using the Equations (7) and (10). For calculation of the wave based void ratio, the bulk moduli of the soil skeleton, the grain and the fluid for fully saturated soils are assumed to be Bsk=7.778ⅹ107
Pa, Bg=20ⅹ107 Pa, and Bf=2.18ⅹ109 Pa, respectively.
Furthermore, the tortuosity factor (a) is adapted to a=1.0 due to the normally consolidated condition. The shape factors (m) are generally suggested to be m=1.3~1.6 for sand and m= 1.8~3.0 for clay. Thus, the intermediate values (m=1.7) are applied to calculate the void ratio in the mixture soils.
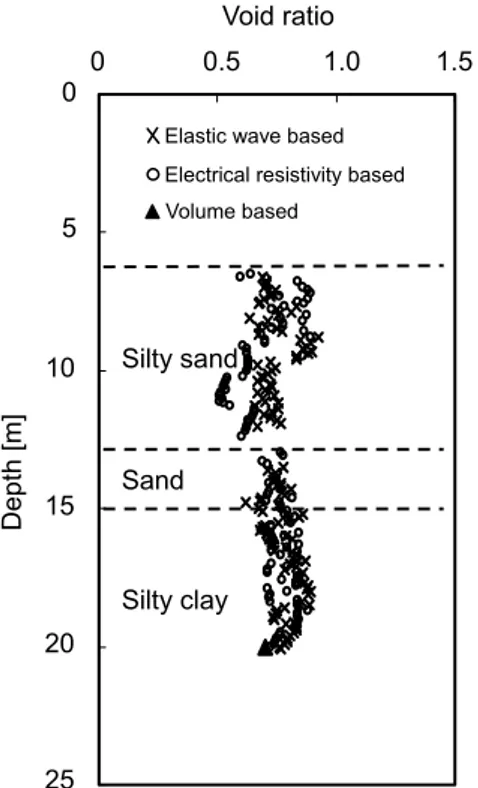
The elastic wave velocities based, electrical resistivity based and volume based void ratios are plotted in Figure 8. The volume based void ratio is evaluated from the standard consolidation test as shown in Figure 6. Figure 8 shows that the elastic wave velocities based void ratio is slightly larger than the volume based void ratio. The electrical resistivity based void ratio is almost identical to the volume-based void ratio. The slight difference results from the assumed input parameters. Thus, studies such as determining the input parameters are essential to estimate the void ratio.
6 CONCLUSION
In this study, the FVRP is introduced to estimate the elastic moduli and the void ratios by using the measured compressional and shear wave velocities, and the electrical resistivity.
The FVRP consists of a blade and two frames. The device is designed to minimize the soil disturbance during penetrating. Thus, the shapes of the blade and frames are developed as wedged and tapered forms.
The transducers for generating and detecting the compressional and shear waves are adopted as PDE and BE, respectively. The ERP measured the electrical resistance of the soil. The PDE, BE and ERP are installed at the toe part of the frame.
Figure 7. FVRP test results in the field: (a) Compressional wave velocity; (b) Shear wave velocity; (c) Constraint modulus; (d) Shear modulus; (e) Poisson’s ratio; (f) Electrical resistivity.
M [GPa] (c) G [MPa] (d) (e) υ Vp [m/s] (a) Boring Area 1200 1600 2000 0 5 10 15 20 25 Depth [m] Vs [m/s] (b) 0 150 300 2 5 8 Boring Area Boring Area μ [Ω·m] (f) 0 60 120 0.4 0.5 0.6 0 2 4 Boring Area Boring Area Boring Area
Figure 8. Void ratio comparison obtained by elastic wave velocities based, electrical resistivity based, and volume based methods in the field.
The application test was carried out in the field for measuring the elastic wave velocities and electrical resistance. The measured elastic wave is converted into the compressional and shear wave velocities by using the first arrival time and travel distance. The elastic wave based void ratio is estimated through the theoretical equation derived by Gassmann. The constraint and shear moduli are also calculated using the elastic wave velocities and mass density. The measured electrical resistance is changed into electrical resistivity. Furthermore, the electrical resistivity based void ratio is determined.
The elastic wave and electrical resistivity based void ratio are compared with the volume based void ratio which is obtained through the result of the standard consolidation tests. The elastic wave velocities based void ratios were slightly larger than the volume based void ratios, and the electrical resistivity based void ratios are similar to the volume based void ratios. Also, the evaluated profiles such as elastic wave velocities, the constraint and shear moduli, electrical resistivity and the void ratios are well matched with the profiles of the SPT-N, and CPT-qc and fs.
ACKNOWLEDGEMENTS
This research was supported by the Basic Science Research Program through the National Research Foundation of Korea (NRF) funded by the Ministry of Education, Science and Technology (KRF-2008-331-D00603) and by the Korea Institute of Construction
Transportation Technology Evaluation and Planning (KICTTEP) Research Center Program, Grant Number 05-Regional Development (B04-01).
REFERENCES
1) Berryman, J.G. (1999): “Origin of Gassmann’s equation”, Standford Exploration Project, Report 102, October 25, pp. 187-192.
2) Biot, M.A. (1956): “Theory of propagation of elastic waves in a fluid-saturated porous solid. І. Low-frequency range”, Journal of Acoustic Society America,Vol. 28, No. 2, pp. 168-178.
3) Campanella, R.G. and Weemees, I. (1990): “Development and use of an electrical resistivity cone for groundwater contamination studies”, Canadian Geotechnical Journal, Vol. 27, pp. 557-567.
4) Foti, S., Lai, C.G. and Lancellotta, R. (2002): “Porosity of fluid-saturated porous media from measured seismic wave velocities”, Geotechnique, Vol. 52, No. 5, pp. 359-373. 5) Gassmann, F. (1951): “Über die Elastizität poroser Medien”,
Veirteljahrsschrift der Naturforschenden Gesellschaft in Zürich, Vol. 96, pp. 251-262.
6) Jackson, P.D., Taylor-Smith, D. and Stanford, P.N. (1978): “Resistivity-porosity-shape relationships for marine sands”, Geophysics,Vol. 43, No. 6, pp. 1250-1268.
7) Kim, J.H., Yoon, H.K. and Lee, J.S. (2010): “Void ratio estimation of seashore soft soils by electrical resistivity cone probe”, Journal of Geotechnical and Geoenvironmental Engineering, ASCE, (Accepted).
8) Klimentos, T. and McCann, C. (1990): “Relationships between compressioal-wave attenuation, porosity clay content and permeability in sandstones”, Geophysics, Vol. 55, pp. 998-1014.
9) Lee, C., Lee, J.S., Lee, W. and Cho, T.H. (2008): “Experiment setup for shear wave and electrical resistance measurements in an oedometer”, Geotechnical Testing Journal, ASTM, Vol. 31, No. 2, pp. 149-156.
10) Lee, J.S., Lee, C., Yoon, H.K. and Lee, W. (2010): “Penetration type field velocity probe”, Journal of Geotechnical and Geoenvironmental Engineering, ASCE, Vol. 136, No. 1, pp. 199-206.
11) Lee, J.S. and Santamarina, J.C. (2005): “Bender elements: performance and signal interpretation”, Journal of Geotechnical and Geoenvironmental Engineering, ASCE, Vol. 131, No. 9, pp. 1063-1070.
12) Mavko, G., Mukerji, T. and Dvorkin, J. (2003): “The rock physics handbook”, Cambridge University Press.
13) Mitchell, J. K. and Soga, K. (2005): “Fundamentals of soil behavior-3rd edition”, John Wiley & Sons, New York. 14) Salem, H.S. (2001): “Determination of porosity, formation
resistivity factor, Archie cementation factor, and pore geometry factor for a glacial aquifer”, Energy sources, Vol. 23, pp. 589-596.
15) Santagata, M.C. and Germaine, J.T. (2002): “Sampling disturbance effects in normally consolidated clays”, Journal of Geotechnical and Geoenvironmental Engineering, ASCE, Vol. 128, No. 12, pp. 997-1006.
16) Santamarina, J. C., Klein, K. A. and Fam, M. A. (2001): “Soils and Waves-Particulate Materials Behavior, Characterization and Process Monitoring”, Wiley, New York. 17) Yoon, H.K., Lee, J.S., Kim, Y.U. and Yoon, S. (2008): “Fork
bade-type field velocity probe for measuring shear waves”, Modern Physics Letters B, Vol. 22, No. 11, pp. 965-969. Elastic-wave-based Electrical-resistivity-based Volume-based Sand Silty clay Silty sand Void ratio 0 0.5 1.0 1.5 0 5 10 15 20 25 Depth [m]
Electrical resistivity based Elastic wave based Volume based