Published by Canadian Center of Science and Education
Financial Crisis, Regulatory Changes and Bank Profit
Seok Weon Lee1
1 Division of International Studies, Ewha Womans University, Seoul, Korea
Correspondence: Seok Weon Lee, Division of International Studies, Ewha Womans University, 11-1, Daehyun-dong, Seodaemun-gu, Seoul 120-750, Korea. Tel: 82-2-3277-4456. E-mail: seoklee@ewha.ac.kr Received: September 12, 2013 Accepted: October 15, 2013 Online Published: November 6, 2013 doi:10.5539/res.v5n5p151 URL: http://dx.doi.org/10.5539/res.v5n5p151
Abstract
This paper attempts to identify empirically the profitability determinants of Korean banks over different regimes of regulations in the banking industry. Firstly, we examine whether the traditional determinants that have been suggested to be effective in explaining the determinants of non-financial firms’ profitability can also explain the profitability of Korean banks. Secondly and more importantly, we partition the full sample period into three sub-periods based on the degree of banking regulation’s strength and compare the explanatory power of the bank profitability determinants and examine how the changes in banking regulations affect the bank profitability. Overall, we found that the profitability of Korean banks is positively related to asset size and capital ratio, and negatively related to the fixed asset ratio and nonperforming loans ratio. However, from the results for the partitioned sample periods, we found that the positive relationship between asset size (capital ratio) and profitability became weaker (stronger) after banking regulations became tightened with structural reform after Asian countries’ financial crisis. The relationship between fixed asset ratio and profitability became more negative after banking regulations became tightened. Net interest margin was no longer a significant determinant of bank profitability under tightened banking regulations. These results could be understood as follows. Under tightened banking regulations, heavier regulatory costs would be imposed on the banks with riskier characteristics such as lower capital ratio, larger asset size, and higher loan ratio, etc. Thus, the profitability of these banks would be affected more adversely than the banks in safer characteristics.
Keywords: bank profitability, bank regulation, financial crisis, capital adequacy 1. Introduction
Sound and healthy banking system is the backbone of a national economy considering that banks play a pivotal role in the economy. Given that the growth of the economy is directly related to the soundness and profitability of the banking system, knowledge of the underlying determinants of banking sector’s profitability has therefore attracted the attention of many researchers in the banking literature as well as many other parties concerned in banks’ profitability such as bank managers, banking sector’s regulators and investors in financial markets. Many theoretical and empirical studies already have been performed to identify and understand the underlying factors that influence the banks’ profitability.
Though empirical evidences on the profitability determinants of banking institutions are rather mixed, there are some factors that are suggested by many researchers that can possibly influence bank profitability. Returns on bank assts, and equity, and net interest margins are the measures that have been most frequently used by the researchers.
Haslem (1968, 1969) found that capital ratios, interest paid and received, salaries and wages are significantly related to bank profitability based on balance sheet and income statement data for all the member banks ofthe US Federal Reserve System in a two-year study. He argued that expense management should be first emphasized; next fund source management and lastly funds use management.
Wall (1985) found that a bank asset and liability management, its funding management and the non-interest cost controls all have significant effects on the bank profitability.
Using the sample of U.S banks over the period of 1983-1989, Berger (1995) found that the profitability of the banks measured by the return on equity is positively related to the bank capital ratio. Higher capital ratio Granger-caused higher earnings and vice versa.This finding is suggested to support the expected bankruptcy
www.ccsenet.org/res Review of European Studies Vol. 5, No. 5; 2013
costs hypothesis for bank profitability suggesting that higher bank capital is leaded to lower bankruptcy cost and lower cost of capital, and higher profitability.
Zimmerman (1996) found that management decision, especially regarding loan portfolio concentration, isone of most significant factorsaffecting bank performance.
Stiroh and Rumble (2006) found a positive relationship between the degree of bank asset portfolios’diversification and bank profit using the sample of U.S. financial holding companies over the period of 1997-2002. Bank diversification strategies include various banking activities such as transaction fees, trading revenue, and other non-interest income, etc.
Hirtle and Stiroh (2007) found a negative relationship between the degree of retail banking and bank return for the U.S. banks. They argued that retail banking may be effective in maintaining stable bank profit, but it may decrease bank profit.
Naceur and Goaied (2008) found that bank profit is negatively related to asset size and positively related to stock market development for the Tunisian banking industry. They conclude that the negative relation between asset size profit implies that Tunisian banks are operating above the optimum level of asset size. The positive relation between stock market development and profit reflects the complementarities relationship between bank and stock market growth.
Alper and Anbar (2011) found that bank profitability s positively related to bank asset size, however, is negatively related to bank loans and size of credit portfolio.
Using the sample of Korean banks, Lee (2012) found that the profitability of regional banks is more positively related to the asset size, capital ratio and the loan ratio than that of the national banks. He concludes that this result possibly results from regional banks’ having more profitable and stable structure and mechanism to generate higher profit due to the various advantages they have over national banks such as regulatory advantages and incentives, more loyal customer bases, easier and more efficient mechanism for information collection about customers, less competition and more protected market share, etc.
This paper is in the same line of researches as the above ones. However, this paper focuses on attempting to identify empirically the profitability determinants of Korean banks over different regimes of regulations in the banking industry. Some previous studies in Korea have already examined the issue of non-financial firms’ profitability determinants in Korea. There were, however, very few studies focusing on banking industry. Furthermore, over the last few decades since the late 1990s, there were a number of significant changes in Korean banking industry’s regulations as a result of structural reform after the financial crisis in 1997 that aggravated the profitability of Korean banks seriously. Korean government and financial supervisory service enforced structural reforms in financial system through the early 2000s to overcome the crisis and to recover the bank profitability. Reinforcing bank capital strength and adequacy was the core method of regulatory changes to recover bank profitability and soundness.
Firstly, we examine whether the traditional determinants that have been suggested to be effective in explaining the determinants of non-financial firms’ profitability can also explain the profitability of Korean banks. Secondly and more importantly, by partitioning the sample period of the empirical analysis based on the degree of banking regulation’s strength, this paper compares the explanatory power of the bank profitability determinants for the different regulations and examines how the changes in banking regulations affect the bank profitability. Understanding how bank profitability is determined and how this relationship between the profitability and the suggested determining factors is affected by banking regulations would be a very important issue in terms of deriving proper and effective policy implications for the sound and profitable banking system.
The structure of this paper is as follows. The next section describes the data and sample of the banks that are used in this study. Section 3 describes the estimation model and the hypotheses to be examined. Section 4 presents the empirical results, and section 5 offers concluding remarks.
2. Data and Summary Statistics
The financial data of the sample banks employed in this study was collected from the Statistics of Bank Management provided by the Korean Financial Supervisory Service. Sample period covered from 1994 to 2008. All the values are measured as year-end ones. Table 1 presents the summary statistics of the variables used in the study. Profitability of the bank is measured by the return on asset (ROA). ROA of the sample banks averages -0.1861. The average asset size of the banks is 405,710 million Korean won. Capital strength of the bank is measured by the total equity capital divided by the total asset, and the average capital ratio is 4.65%. Loan-to-asset ratio averages 47.33%. The ratio of nonperforming loans and the ratio of fixed assets to total asset
average 4. Table 1. S ROA Asse Capi Loan Non Fixe Net Num This table 3. Testing To exami cross-secti potential o the individ (fixed-effe unbiased e Consider t where i matrix, observed. institutiona The FE m directly co Since is regression As in the m of the reg profitabilit loans-to-as These exp (1995), Sti Samadi (2 The expec profitabilit Firstly, the plausible. cost reduc second fac portfolios. the first fa in lower re The effect conflicting 3369 and 46.2 Sample descrip A (return on a et size ital-to-asset ra n-to-asset rati nperforming lo ed asset ratio interest margi mber of observ shows the des
Model, Varia
ine the determ ional time-seri omitted latent-dual-specific c ect) specificati estimates. the linear unob is the depend is the unobse Common exa al factors for c model allows ontrolled for. T s constant, n of on . most previous gression mode ty, asset size sset ratio (Npl planatory varia
iroh and Rumb 012), Lee (201
(Profit)i,t= λ0+
cted sign base ty is as follows e effect of as The first facto ctions in produ ctor comes fro Between thes actor dominate eturn and profi of bank capita g effects, the 2888, respectiv ptive statistics sset) atio o oans ratio ins ratio vations264 scriptive statist
ables and Hyp
minants of th ies regression -variable probl component of on to the mod bserved effects ent variable o erved time-inv amples for tim countries. to be corr The FE model e and henc studies in the el is measured (LogAsset), c ), fixed asset-t ables for bank ble (2006), Hir 12), and etc.
+ λ1 (LogAsset
ed on the liter s.
sset size (Log or is the effect uction and ma om the effect se two conflict es. If the secon itability becaus al strength (Ca positive relati
vely. The ratio s Mean -0.186 405,7 0.046 0.473 4.336 46.28 0.017 tics for the sam
potheses
he profitabilit equation is e lem in OLS (o the error term del. Under this
s model for f observed for variant indivi me-invariant e related with th eliminates b ce the effect i literature, pro d as the ROA capital-to-asset to-asset ratio (F k profitability
rtle and Stiroh
t)i,t+ λ2 (Capita rature’s sugge gAsset) on ba t of larger ass anagement. Th of larger asset ting effects, ba nd factor domi se of lower ris apital), or finan ionship betwe of net interest n 61 10 65 33 69 88 72
mple banks ove
ty of Korean estimated over ordinary least m is correlated specification, observations a for individual at idual effect an effects are i he regressors by demeaning t s eliminated. T ofitability of ea A of the bank. t ratio (Capita Fixed), and ne are chosen b h (2007, Naceu
al)i,t+ λ3 (Loan
estion between ank profitabilit et size on ach his may contri t size on achie ank asset size inates, on the sk.
ncial leverage, een capital rat
margins to tot Median 0.3700 212,141 0.0442 0.4642 2.8500 28.7000 0.0183 er the period 1 n banks, the r the sample p square) type e
with the regre FE estimation and time per
and t time is nd is the e innate ability . Since i the variables u , where The FE estim ach bank, and As the expla al), loan-to-as et interest marg based on the p ur and Goaied n)i,t+ λ4 (Npl)i,t n each of the ty is ambiguo hieving econom ibute to increa eving higher r would result i other hand, lar , on profitabili tio and profita
tal asset averag
Stand 994-2008. following m period 1994-2 estimation that essors in the m n is known to riods: the time-vari error term. Un of individuals is not observ using the withi an ator is then ob therefore, the anatory variab set ratio (Loa gins-to-asset ra previous studi
(2008), Alper
t+ λ5 (Fixed)i,t+
explanatory v ous. Two conf mies of scale a asing the bank risk diversifica in increasing b rger bank asse ity is also amb ability focuses ges 0.0172. dard Deviatio 1.9846 516,384 0.0210 0.0919 4.3182 159.60 0.0085 multivariate po 2008. To reme t could occur w model, we giv be able to gen iant regr nlike , is s or historical able, it canno in transformati nd . btained by an dependent var bles affecting an), nonperfor atio (Nim) are ies such as B r and Anbar (2
+ λ6 (Nim)i,t+ ε
variables and flicting effect and the conseq k profitability. ation of bank bank profitabil et size would r biguous. Of the s on the effec n ooled edy a when ve FE nerate essor s not l and ot be ion: OLS riable bank ming used. erger 011), εi,t(1) bank s are quent The asset lity if result e two cts of
www.ccsenet.org/res Review of European Studies Vol. 5, No. 5; 2013
higher capital ratio on the firm’s being charged lower cost of capital and having lower bankruptcy costs. However, as the traditional corporate finance literature suggests, if lower equity capital, or higher financial leverage, gives greater motivation for the firm to increase risk, it could result in higher profitability.
Loan-to-asset ratio (Loan) is used as the proxy variable for the bank asset portfolio compositions. Of the various asset portfolio components, loans are classified as the highest risk categories. Furthermore, loans are the least liquid type of asset. If such high risk characteristics of higher loan ratio dominate, a negative relationship between loan ratio and profitability would be found. On the other hand, considering that the interest earnings from loans are generally the most profitable source of bank profit, a positive relationship between loan ratio and profitability could be found.
Nonperforming loans-to-asset ratio (Npl) is included to control for the current risk status of the bank on bank profitability.
The ratio of fixed asset to total asset (Fixed) is included as the measure of the bank overhead expenses.
Finally, the ratio of net interest margins to total asset (Nim) is included to control for the effect of the bank interest margin on bank profit, which is a relatively passive and direct channel for bank profit generation.
4. Empirical Results
4.1 The Results for Full Sample Period
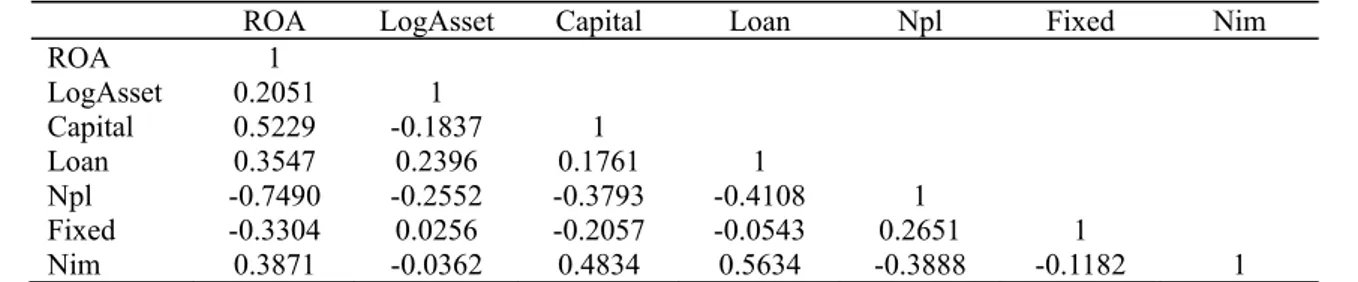
Before estimating the fixed-effect panel regression model, we examine the correlation coefficients among the variables used in the study as a prerequisite test. Table 2 presents the Pearson correlation coefficients between the variables. It is shown that ROA is positively correlated with asset size, capital ratio and loan ratio, respectively. These results may support the following views for our hypotheses: Larger asset size of the firm would be associated with economies of scale and cost reduction, and the consequent higher profit. The banks with higher capital ratio would be charged lower cost of capital and have lower bankruptcy costs, and therefore, could generate higher profit. The positive correlation between loan ratio and ROA may suggest that the sample banks’ loan assets are properly managed to contribute to generate higher profit. Also, it is shown in the table that ROA is negatively correlated with both nonperforming loan ratio and fixed asset ratio. Net interest margin ratio is positively correlated with ROA.
Table 2. Correlations
ROA LogAsset Capital Loan Npl Fixed Nim
ROA 1 LogAsset 0.2051 1 Capital 0.5229 -0.1837 1 Loan 0.3547 0.2396 0.1761 1 Npl -0.7490 -0.2552 -0.3793 -0.4108 1 Fixed -0.3304 0.0256 -0.2057 -0.0543 0.2651 1 Nim 0.3871 -0.0362 0.4834 0.5634 -0.3888 -0.1182 1
This table shows the Pearson correlations among the variables over the period 1994-2008. Table 3. Fixed-effect panel regression results (full sample period)
Slope coefficient t-statistics
Intercept -2.8152*** -3.0398 LogAsset 0.1671*** 2.6645 Capital 26.7282*** 6.6591 Loan 1.0602 0.9570 Npl -0.2573*** -12.139 Fixed -0.0015*** -3.1448 Nim -3.2934 -0.2756 F-statistic 80.272*** Adjusted R2 0.64 Number of observations 264
This table shows the slope coefficients and t-statistics of the panel regression result for the full sample period 1994-2008. *, **, *** indicate statistical significance at the 10, 5, or 1% significance level, respectively.
Table 3 shows the results of the fixed-effect panel regression for all the sample banks over the full sample period (1994-2008). It is shown that asset size has a significantly positive effect on bank profitability. This result may support the view that for the Korean banks over the sample period of this study the positive effect of larger asset size on achieving economies of scale, lower cost, and therefore, higher profit seems to have dominated the effect of larger asset size on achieving better risk diversification, and therefore, lowering bank profit
It is shown that capital ratio also has a significantly positive effect on bank profitability. This result may support the view that the positive effect of higher capital ratio on lowering bank cost of capital and bankruptcy costs, and therefore, higher profit seems to have dominated the effect of higher (lower) capital on inducing the bank to pursue safer (riskier) activities, and therefore, lower (higher) profit.
Loan ratio has a positive effect on bank profitability, however, is not statistically significant. Both nonperforming loan ratio and fixed asset ratio have significantly negative relationships with bank profit.
4.2 Step-wise Regression Results
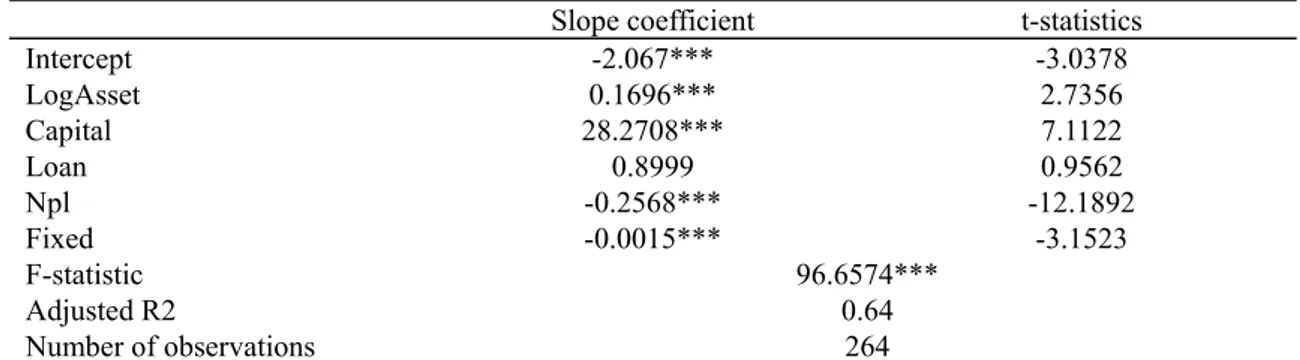
We run step-wise regressions after omitting the two insignificant explanatory variables from the above full sample estimation, the ratio of net interest margins and loan ratio, in turn, respectively, and examines the consistency of the estimation results. The first table 4.1 shows the result for which the ratio of net interest margins is omitted. The second table 4.2 shows the result for which both the ratio of net interest margins and loan ratio are omitted. It is shown that the estimation results are not influenced by these modifications.
Table 4. Step-wise fixed-effect panel regression results (full sample period)
Slope coefficient t-statistics
Intercept -2.067*** -3.0378 LogAsset 0.1696*** 2.7356 Capital 28.2708*** 7.1122 Loan 0.8999 0.9562 Npl -0.2568*** -12.1892 Fixed -0.0015*** -3.1523 F-statistic 96.6574*** Adjusted R2 0.64 Number of observations 264
This table shows the slope coefficients and t-statistics of the step-wise panel regression result for the full sample period 1994-2008. *, **, *** indicate statistical significance at the 10, 5, or 1% significance level, respectively. Table 5. Step-wise fixed-effect panel regression results (full sample period)
Slope coefficient t-statistics
Intercept -2.4883*** -2.8877 LogAsset 0.1794*** 2.9345 Capital 28.5805*** 7.2153 Npl -0.2631*** -13.1535 Fixed -0.0015*** -3.1049 F-statistic 120.63*** Adjusted R2 0.64 Number of observations 264
This table shows the slope coefficients and t-statistics of the step-wise panel regression result for the full sample period 1994-2008. *, **, *** indicate statistical significance at the 10, 5, or 1% significance level, respectively.
4.3 The Results for Sub-sample Periods
Presuming that the profitability determinants of Korean banks could have been affected by the financial crisis that has swept over Asian countries around the late 1997, we partition the full sample period 1994-2008 into three sub-sample periods; 1994-1996 (pre-financial crisis and loose regulation period), 1997-2000 (the periods of financial crisis and tightened regulations with regulatory reform), and 2001-2008 (post-financial crisis and the period of tightened regulations with regulatory reform). Then we estimate the above multivariate fixed-effect
www.ccsenet.org/res Review of European Studies Vol. 5, No. 5; 2013
panel regression for each sample period, respectively, and examine whether there were any significant differences in the relationship between bank profitability and the explanatory variables.
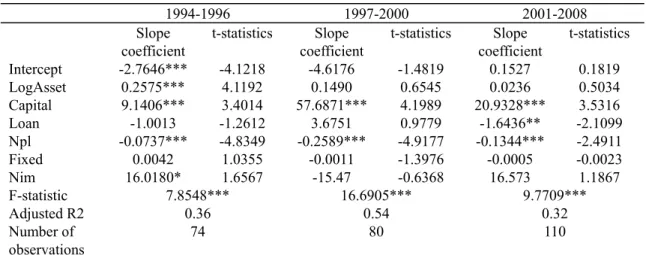
The estimation results for the three sub-sample periods are presented in table 5. Firstly, it is shown that the coefficient on asset size is significantly positive over 1994-1996 period, however, is not significant during the two latter periods of strengthened regulations. This result can be understood as follows. In the process of overcoming the financial crisis since the late 1997, M&A (merger and acquisition) of inadequate capital ratio and unhealthy banks by larger banks is one of the main means of the Korean banking industry’s structural reform. Thus, the capital strength of larger banks that acquired smaller, unhealthier banks deteriorated significantly. Therefore, other things being equal, under the regime of strict financial regulation strengthening capital adequacy of the banks, the degree of regulatory supervision would be heavier on the larger banks, which could affect bank profitability negatively. Considering that the banks with higher capital ratio would have significantly lower financial distress and bankruptcy costs under the tightened regulation, which would be associated with lower cost of capital, this result can be understood.
It is also shown that the coefficient on capital ratio is consistently positive over all the three periods, however, the magnitude and significance of the coefficient are greater and stronger for the latter two periods of strengthened regulations. This result suggests that the effect of higher capital ratio on contributing to higher profitability is more significant under the period of strengthened regulation. Thus capital adequacy plays a more significant role for the bank profitability under the regime of tightened bank regulations.
The coefficient on the loan ratio is significantly negative over the period of 2001-2008. As mentioned above, loans are classified as the highest risk category asset under tightened regulation. Thus, the degree of regulatory supervision on the banks with higher loan ratio would be heavier under tightened regulation, which could result in lower profitability.
The relationship between nonperforming loans and bank profitability is consistently negative for all the three periods.
The coefficient on fixed asset is negative for the two latter periods, though not statistically significant, while it is positive for the first period. This may indicate that the cost of paying larger overhead expenses is greater under the period of tightened regulation, and this results in lower profitability.
The coefficient on net interest margins is significantly positive only for the first period of loose regulation. Thus, the passive and direct effect of bank interest margin on generating profit gets weaker as the regulation gets tightened.
5. Discussion
The empirical findings for the sub-sample periods suggest that the positive association between bank asset size and profit gets weaker and that between bank capital ratio and profit gets stronger as banking regulation becomes tightened. Both results can be understood in terms of the more strengthened adequacy and requirement for bank capital ratio. Also, it is significantly observed that the greater the loan ratio, the lower the bank profitability under tightened banking regulations. The negative effect of larger overhead cost for bank profitability is greater under tightened banking regulations. Finally, the net interest margin is no longer a significant determinant of bank profitability under tightened banking regulations.
Overall, comparison of the results between a loose regulation period and a tightened regulation period suggests that the banks became more sensitive to maintain a fair level of capital ratio and became more reluctant to increase the cost of banking activities after banking regulation became tightened. Furthermore, it is shown that the risk-taking incentives of the banks reflected by the coefficients on each explanatory variable became weaker after regulation became tightened. Considering that the degree of regulatory supervision would be heavier on the banks with lower capital ratio, higher loan ratio, higher nonperforming loans and etc. under the period of tightened regulation, this result could be expected. However, if the effect of the tightened regulation is too excessive such that it discourages the banks’ deliberate and profitable risk-taking incentives, it would ultimately cause the bank profit to be damaged and the soundness of banking industry is not guaranteed. Keeping the balance between risk-taking and profitability would be a very important issue. Banks, themselves, also need to seek diverse methods, mechanism and risk-management scheme to generate profits by minimizing the adverse consequences of tightened regulation.
Table 6. Fixed-effect panel regression results (Sub-sample periods) 1994-1996 1997-2000 2001-2008 Slope coefficient t-statistics Slope coefficient t-statistics Slope coefficient t-statistics Intercept -2.7646*** -4.1218 -4.6176 -1.4819 0.1527 0.1819 LogAsset 0.2575*** 4.1192 0.1490 0.6545 0.0236 0.5034 Capital 9.1406*** 3.4014 57.6871*** 4.1989 20.9328*** 3.5316 Loan -1.0013 -1.2612 3.6751 0.9779 -1.6436** -2.1099 Npl -0.0737*** -4.8349 -0.2589*** -4.9177 -0.1344*** -2.4911 Fixed 0.0042 1.0355 -0.0011 -1.3976 -0.0005 -0.0023 Nim 16.0180* 1.6567 -15.47 -0.6368 16.573 1.1867 F-statistic 7.8548*** 16.6905*** 9.7709*** Adjusted R2 0.36 0.54 0.32 Number of observations 74 80 110 This table shows the slope coefficients and t-statistics of the panel regression result for the sub-sample periods
1994-1996, 1997-2000, 2001-2008, respectively. *, **, *** indicate statistical significance at the 10, 5, or 1% significance level, respectively.
6. Concluding Remarks
This paper attempts to identify empirically the profitability determinants of Korean banks over different regimes of regulations in the banking industry. Firstly, we examine whether the traditional determinants that have been suggested to be effective in explaining the determinants of non-financial firms’ profitability can also explain the profitability of Korean banks. Secondly and more importantly, we partition the full sample period into three sub-periods based on the degree of banking regulation’s strength and compare the explanatory power of the bank profitability determinants and examines how the changes in banking regulations affect the bank profitability. Overall, we found that the profitability of Korean banks is positively related to asset size and capital ratio, and negatively related to the fixed asset ratio and nonperforming loans ratio. However, from the results for the partitioned sample periods, we found that the positive relationship between asset size (capital ratio) and profitability became weaker (stronger) after banking regulations became tightened with structural reform after Asian countries’ financial crisis. The relationship between fixed asset ratio and profitability became more negative after banking regulations became tightened. Net interest margin was no longer a significant determinant of bank profitability under tightened banking regulations. These results could be understood as follows. Under tightened banking regulations, heavier regulatory costs would be imposed on the banks with riskier characteristics such as lower capital ratio, larger asset size, and higher loan ratio, etc. Thus, the profitability of these banks would be affected more adversely than the banks in safer characteristics.
References
Alper, D., & Anbar, A., (2011). Bank Specific and Macroeconomic Determinants of Commercial Bank Profitability: Empirical Evidence from Turkey. Business and Economic Research Journal, 2, 139-152. Berger, A. N. (1995). The Relationship between Capital and Earnings in Banking. Journal of Money, Credit and
Banking, 27, 432-456. http://dx.doi.org/10.2307/2077877
Haslem, J. (1968). A Statistical Analysis of the Relative Profitability of Commercial Banks. Journal of Finance,
23, 167-176. http://dx.doi.org/10.1111/j.1540-6261.1968.tb03004.x
Haslem, J. (1969). A statistical estimation of commercial bank profitability. Journal of Business, 42, 22-35. http://dx.doi.org/10.1086/295162
Hirtle, B. J., & Stiroh, K. J. (2007). The Return to Retail and the Performance of US Banks. Journal of Banking
and Finance, 31, 1101-1133. http://dx.doi.org/10.1016/j.jbankfin.2006.10.004
Lee, S. W. (2012). Profitability Determinants of Korean Banks. Economics and Finance Review, 2, 6-18.
Naceur, S. B., & Goaied, M. (2008). The Determinants of Commercial Bank Interest Margin and Profitability: Evidence from Tunisia. Frontiers in Finance and Economics, 5, 106-130.
www.ccsenet.org/res Review of European Studies Vol. 5, No. 5; 2013
in Iranian Banking Sector. Management Science Letters. http://dx.doi.org/10.5267/j.msl.2012.04.020 Stiroh, K. J., & Rumble, A. (2006). The Dark Side of Diversification: The Case of US Financial Holding
Companies. Journal of Banking and Finance, 30, 2131-2161.
Wall, L. D. (1985). Why Are Some Banks More Profitable than Others? Journal of Bank Research, 15, 240-256. Zimmerman, G. (1996). Factors Influencing Community Bank Performance in California. Federal Reserve Bank
of San Francisco, 1, 26-41. Copyrights
Copyright for this articleis retained by the author(s), with first publication rights granted to the journal.
This is an open-access article distributed under the terms and conditions of the CreativeCommons Attribution license (http://creativecommons.org/licenses/by/3.0/).