Mutations in both KRAS and BRAF may contribute to the
methylator phenotype in colon cancer
Takeshi Nagasaka1, Minoru Koi1, Matthias Kloor2, Johannes Gebert2, Alex Vilkin1, Naoshi Nishida1, Sung Kwan Shin1, Hiromi Sasamoto3, Noriaki Tanaka3, Nagahide Matsubara3, C. Richard Boland1, and Ajay Goel1
1Division of Gastroenterology, Department of Internal Medicine and Charles A Sammons Cancer Center and Baylor Research Institute, Baylor University Medical Center, Dallas, TX 75246, USA
2Institute of Molecular Pathology, University of Heidelberg, Heidelberg, Germany
3Department of Gastroenterological Surgery and Surgical Oncology, Okayama University Graduate School of Medicine Dentistry and Pharmaceutical Sciences, Okayama 700-8558, Japan
Abstract
Background—Colorectal cancers (CRCs) with the CpG island methylator phenotype (CIMP) often
associate with epigenetic silencing of hMLH1 and an activating mutation in the BRAF gene. However, the current CIMP criteria are ambiguous, and often result in an underestimation of CIMP frequencies in CRCs. Since BRAF and KRAS belong to same signaling pathway, we hypothesized that not only mutations in BRAF, but mutant KRAS, may also associate with CIMP in CRC.
Methods—We determined the methylation status of a panel of 14 markers (7 canonical
CIMP-related loci, and 7 new loci), MSI status, and BRAF/KRAS mutations in a cohort of 487 colorectal tissues that included both sporadic and Lynch syndrome patients.
Results—Methylation analysis of seven CIMP-related markers revealed that the mean number of
methylated loci was highest in BRAF mutated CRCs [3.6], versus KRAS-mutated [1.2; P<0.0001] or
BRAF/KRAS wild-type tumors [0.7; P<0.0001]. However, analyses with seven additional markers
showed that the mean number of methylated loci in BRAF mutant tumors [4.4] was the same as in
KRAS mutant CRCs [4.3; P=0.8610]. Although sporadic MSI-H tumors had the most average number
of methylated markers [8.4], surprisingly Lynch syndrome CRCs also demonstrated frequent methylation [5.1].
Conclusions—CIMP in CRC may result from activating mutations in either BRAF or KRAS, and
the inclusion of additional methylation markers that correlate with mutant KRAS may help clarify CIMP in future studies. Additionally, aberrant DNA methylation is a common event not only in sporadic CRC, but also in Lynch syndrome CRCs.
Keywords
BRAF; KRAS; CIMP; colon cancer; methylation
Correspondence to: Ajay Goel, Ph. D. (ajayg@baylorhealth.edu) or C. Richard Boland, M.D. (Rickbo@baylorhealth.edu) Baylor University Medical Center, 3500 Gaston Avenue, Gastrointestinal Cancer Research Laboratory, Suite H-250, Dallas, TX 75246. Phone: 1-214-820-2692; Fax: 1-214-818-9292.
Publisher's Disclaimer: This is a PDF file of an unedited manuscript that has been accepted for publication. As a service to our customers we are providing this early version of the manuscript. The manuscript will undergo copyediting, typesetting, and review of the resulting proof before it is published in its final citable form. Please note that during the production process errors may be discovered which could
NIH Public Access
Author Manuscript
Gastroenterology. Author manuscript; available in PMC 2009 June 1. Published in final edited form as:
Gastroenterology. 2008 June ; 134(7): 1950–1960.e1. doi:10.1053/j.gastro.2008.02.094.
NIH-PA Author Manuscript
NIH-PA Author Manuscript
Introduction
Aberrant promoter hypermethylation associated with transcriptional silencing of multiple tumor suppressor genes has been proposed as a mechanistic component in the evolution of several human cancers 1. Tumors with a critical degree of aberrant methylation have the CpG Island Methylator Phenotype (CIMP), which was initially described in the colorectal cancer (CRC) 2. CIMP, microsatellite instability (MSI) and chromosomal instability constitute the three major mechanisms of genomic or epigenetic instability in CRC 3,4. Since the initial description of CIMP, its role in carcinogenesis has been controversial 3,5–7. Experimental evidence has consistently supported the presence of CIMP in a subset of CRCs 3,4,8,9, and it has been found that CIMP significantly correlates with a V600E mutation in the BRAF gene 10,11. However, some degree of promoter methylation can be found in normal tissues and virtually all CRCs, so some have argued that CIMP does not constitute a unique pathogenetic pathway 7.
Due to the controversy surrounding CIMP, many laboratories have focused on making a case that CIMP constitutes a discrete group of CRCs through the identification of an optimized panel of CIMP-specific markers 11–13. Two panels of CIMP-specific markers have been proposed, including those identified by the originators of the concept12,13, and a second panel recently reported after an extensive evaluation of a very large group of candidate markers 11. Both panels are highly specific for the identification of CIMP CRCs with BRAF V600E mutations 11. However, there is a lack of consensus on the frequency of CIMP in CRC, because of multiple definitions of CIMP (CIMP+ and CIMP−, CIMP-high and low, etc.), the use of different sets of methylation markers, and differences in diagnostic methodologies. However, the greatest challenge has been to use consistent criteria for CIMP analyses to categorize a cancer positive or negative for this phenotype, and finding a consensus for the definition of CIMP 8,9,14,15.
Nearly all of the approximately 15% of sporadic MSI CRCs come from a CIMP background, caused by the epigenetic silencing of hMLH1; however, additional CRCs that are microsatellite stable (MSS) may also be labeled as CIMP depending upon the diagnostic criteria used 4,8, 9. It has been proposed that CIN and CIMP represent two major mechanisms of genomic (or epigenetic) instability in CRC, and that perhaps upto 50% of CRCs might be characterized as having CIMP 4. Thus, it is important to have a more complete understanding of CIMP, and to reach a consensus on whether this constitutes a unique and unified group of tumors that may evolve through a common pathway.
CIMP determinations using CIMP-related markers have consistently identified clusters of CRCs with MSI and V600E BRAF mutations, but rarely KRAS mutations 8,9,14,16. However, when additional methylation loci have been investigated, additional subsets of CRCs have been identified with extensive methylation; these tumors are MSS, and are associated with mutations in the KRAS gene 4,17,18. Although these tumors should be considered CIMP-positive, they have been typically categorized as non-CIMP, because, by definition, analyses using the canonical CIMP criteria considered only those methylation events strictly associated with mutant BRAF. Defining the markers in this fashion raises a possible problem of circular reasoning.
BRAF and KRAS gene products function in the same serial signaling pathway, and activating
mutations in these genes are usually mutually exclusively 10,19. Interestingly, prior to the more recent discovery of V600E BRAF mutations, KRAS mutations were proposed as the possible cause of aberrant methylation. It has been shown that fibroblasts transformed by fos or ras
NIH-PA Author Manuscript
NIH-PA Author Manuscript
experience upregulation of DNA methyltransferase (DNMT) expression and consequent global hypermethylation 20.
In light of these considerations, we hypothesized that CIMP in CRC may not be exclusively the result of mutations in BRAF, but might be a more general consequence of the upregulation of the RAS-RAF pathway. In the present study, we investigated the relationship between the activating mutations of the BRAF/KRAS genes and global hypermethylation using a broad panel of methylation markers that included both the canonical CIMP-related markers, and additional methylation-related loci. We included in our investigation a group of Lynch syndrome-related CRCs, in which there is MSI, but no mutations in BRAF. We found that methylation of this broad panel of methylation markers segregates not just with BRAF, but also with KRAS mutations. Our data provide novel evidence for a potential role of KRAS mutations in the evolution of aberrant methylation, and propose a broader panel of methylation markers that may improve our current understanding for the molecular basis of CIMP.
Materials and Methods
Colorectal tissue specimens
We obtained a cohort of 487 colorectal tissues, including 243 cancers, 208 corresponding normal colonic mucosal specimens from patients with CRC (C-N), and 36 normal epithelial tissues from patients without any evidence of neoplasia at colonoscopy (N-N) from Okayama University Hospital, Okayama, Japan and Heidelberg University, Heidelberg, Germany. Of the 243 CRCs, 21 cancers were from Lynch syndrome patients, and had documented germline mutations and associated loss of protein expression of the MMR genes: hMSH2, hMLH1, hPMS2, and hMSH6; the remaining 222 were sporadic CRCs, in which patients did not have any family history of CRC, and had no evidence for polyposis or IBD. Among 222 sporadic CRCs, 184 cases have been previously analyzed for CIMP 17. Normal mucosal tissues were sampled from distant surgical margins of the CRC resections. All patients provided written informed consent, and the studies were approved by Institutional Review Boards of all institutions involved.
Sodium bisulfite modification and Combined Bisulfite Restriction Assays (COBRA)
Genomic DNA obtained from colorectal tissues was bisulfite modified to convert all unmethylated cytosine residues to uracils. Bisulfite PCR reactions were carried out and restriction endonuclease digestion was performed on PCR products for methylation analyses of 14 markers (Table 1) 21. Seven methylation markers were canonical CIMP-related loci, including the hMLH1-5’ region, hMLH1-3’ region, p16INK4a, p14ARF, MINT1, MINT2, and MINT31 4,5,16. We then analyzed methylation frequencies at promoter regions of seven additional tumor suppressor genes that have been reported to be frequently methylated in a cancer-specific manner in CRC (SFRP2, RASSF2A, MGMT, Reprimo, 3OST2, HPP1, and
APC) 22–29.
The digested DNA was separated on 3% agarose gels and stained with ethidium bromide. The quantitative methylation levels (ratios of methylated to unmethylated DNA) were determined from the relative intensities of cleaved and non-cleaved PCR products. A marker was considered methylation positive if it showed ≥5% methylation density, and methylation negative if it had <5%, in accordance with canonical CIMP criteria 12.
Microsatellite Analysis
Microsatellite analysis of each tumor tissue was determined using the NCI-workshop panel of recommended markers 30. Tumors showing a shift in at least one mononucleotide marker and one other marker were classified as MSI-H, and were referred to as MSI cancers throughout
NIH-PA Author Manuscript
NIH-PA Author Manuscript
the text. We then analyzed all non-MSI tumors with five additional dinucleotide repeat sequences (D5S107, D8S87, D17S261, D18S35, and D18S58) and one tetranucleotide repeat marker (MYCL1). MSI-Low (MSI-L) was defined as a shift in any of the dinucleotide and/or tetranucleotide markers; tumors which showed no allelic shifts were classified as microsatellite stable (MSS) 31. We grouped 55 MSI-L and 152 MSS together as non-MSI cancers in this study for comparative purposes because both have similar clinicopathologic, and mutational features.
BRAF and KRAS mutation analysis
Direct sequencing was performed to identify BRAF V600E mutation and KRAS codon 12/13 mutations. Primer sequences for BRAF and KRAS were: BRAF-F
TGCTTGCTCTGATAGGAAAATGA-3′), BRAF-R
(5′-TGGATCCAGACAACTGTTCAAA-3′), KRAS-F (5′-GCCTGCTGAAAATGACTGAA-3′) and KRAS-R (5′-AGAATGGTCCTGCACCAGTAA-3′) that generated fragment lengths of 165 and 167 bp, respectively. PCR products were purified using a QIAquick PCR purification kit (Qiagen) and directly sequenced on an ABI 3100-Avant DNA sequencer.
Statistical analyses
The methylation status of 14 epigenetic markers was analyzed as a categorical variable (methylated: methylation level ≥5%, unmethylated: methylation level <5%). CRCs were divided into subgroups according to MSI/LS or BRAF/KRAS mutation status, and the relationship of each epigenetic marker with various clinico-pathological parameters was evaluated using the X2 test. We used Kruskal-Wallis one way analysis of variance on rank sums to compare overall differences in the average number of methylated loci among subgroups classified by MSI status (sporadic MSI or Lynch syndrome) or BRAF/KRAS mutation status. Whenever the Kruskal-Wallis test indicated differences among these subgroups, further pair-wise comparisons for each of the subgroups divided by MSI/Lynch Syndrome or BRAF/
KRAS mutation status was performed using a non-parametric multiple comparison method
using Steel-Dwass test. In order to ascertain the relative risks for methylation, we calculated the odds ratio (OR) of each CRC subgroup according to methylation at each epigenetic marker. A 95% confidence interval (CI) was calculated for each OR. All reported P values are 2-sided and a P<0.05 was considered statistically significant.
Results
V600E BRAF mutations are frequently present in sporadic MSI CRCs, while KRAS mutations are exclusively observed in Lynch syndrome and non-MSI CRCs
A total of 487 colorectal tissues, including 243 CRCs, 208 C-Ns, and 36 N-Ns were investigated. All tumors were categorized into subgroups depending upon their MSI status (sporadic or Lynch syndrome), and BRAF/KRAS mutations. We found that 36/243 (15%) CRCs were MSI and 207/243 (85%) were non-MSI. Among the 36 MSI tumors, 15 (42%) were sporadic MSI CRCs, while 21 (58%) were from Lynch syndrome patients (which had been oversampled for this analysis). To highlight the differences between Lynch syndrome and sporadic MSI tumors, we categorized all CRCs into three subsets based upon BRAF/KRAS mutation status as sporadic MSI, Lynch syndrome and non-MSI cancers. We observed that 8% (20/243) of the CRCs harbored V600E BRAF mutations (“BRAF mutant”), 33% (80/243) had
KRAS codon 12 or 13 mutations (“KRAS mutant”), and 59% (143/243) CRCs lacked mutations
in both BRAF and KRAS genes (“wild type”).
Table 2 illustrates detailed associations between the CRC groups based upon MSI status (sporadic MSI and Lynch syndrome), and mutation spectrum (BRAF/KRAS). We observed that a significant proportion of sporadic MSI CRCs occurred in patients ≥65 years of age (80%),
NIH-PA Author Manuscript
NIH-PA Author Manuscript
which was similar to the frequency in non-MSI patients (51%), but as anticipated, the age was significantly lower in Lynch syndrome CRCs (5%, Lynch syndrome vs. sporadic MSI or non-MSI; P<0.0001). Sporadic MSI tumors were more frequent in females than males (sporadic MSI, 60%; Lynch syndrome, 19%; Non-MSI, 35%). Also, 92% of sporadic MSI and 69% of Lynch syndrome CRCs were proximally located, in contrast to 30% of non-MSI cancers. Older patients (≥65 years at diagnosis) frequently harbored BRAF (65%) or KRAS (56%) mutations, although many lacked mutations in either gene (42%) (P = 0.0378 for either mutation vs younger patients). Female patients had significantly more BRAF mutations compared to males (BRAF mutant, 65%; KRAS mutant, 35%; wild type, 32%; P=0.0147 for
BRAF mutant vs. KRAS mutant, P=0.0033 for BRAF mutant vs. Wild type). BRAF and KRAS mutant CRCs were significantly more common in the proximal colon, compared to Wild
type CRCs (BRAF mutant, 65%; KRAS mutant, 46%; wild type, 26%; P=0.0013 for BRAF mutant vs. Wild type, P=0.0047 for KARS mutant vs. Wild type).
Importantly, BRAF mutations were detected at high frequencies in sporadic MSI tumors (67%), were seldom present in non-MSI tumors (5%), and did not occur in Lynch syndrome patients (0%). On the other hand, KRAS mutations were never present in sporadic MSI cancers (0%), while 33% of Lynch syndrome and 35% of non-MSI CRC exhibited KRAS mutations.
Aberrant DNA hypermethylation is rare in normal colon, but is frequently observed in CRC
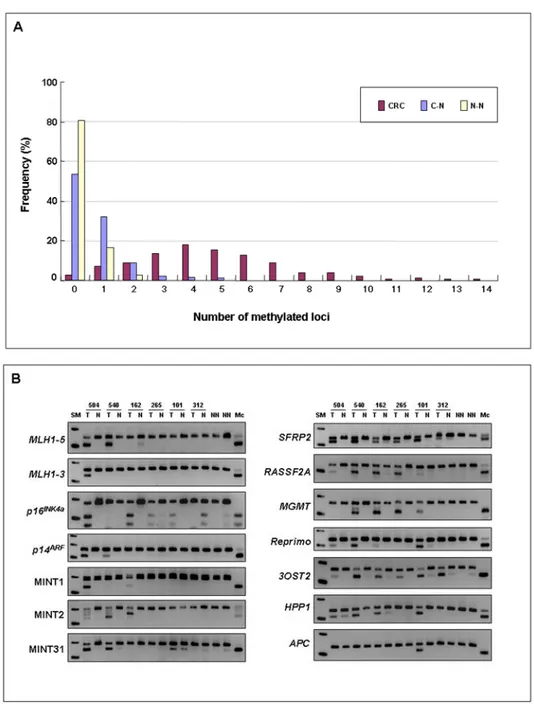
We investigated the methylation status at fourteen methylation-related loci using quantitative COBRA in the total cohort of 487 colorectal tissues. We observed that 97% of CRCs (236/243), 46% of C-Ns (96/208) and 19% of N-Ns (7/36) showed evidence for methylation at ≥1 markers (Figure 1A). Methylation levels in C-N and N-N tissues were quite low (<5% methylation) in comparison to that observed in CRCs, suggesting the cancer-specificity of various methylation markers (Figure 1B). Furthermore, the proportion of tissues with methylation at ≥2 loci was significantly higher in CRCs (90%, 219/243) than in C-Ns (14%, 29/208) or N-Ns (3%, 1/36;
P<0.0001).
As shown in Table 3, the overall frequency of promoter hypermethylation at each gene/locus was highly variable: SFRP2 (63%), RASSF2A (68%), MGMT (24%), Reprimo (24%),
3OST2 (82%), HPP1 (69%), APC (29%), hMLH1-5’ region (22%), hMLH1-3’ region (4%), p16INK4a (17%), p14ARF (10%), MINT1 (12%), MINT2 (21%) and MINT31 (26%).
A distinct subset of markers is methylated in sporadic MSI versus Lynch syndrome CRCs
We correlated the methylation status at individual epigenetic markers in the MSI tumors (Table 3). When methylation features were compared between sporadic MSI and Lynch syndrome tumors, as expected, sporadic MSI tumors were more frequently methylated at most of the markers, the exceptions being: MINT31, SFRP2, and APC. Interestingly, aberrant methylation at these three loci was more frequent in Lynch syndrome tumors. MINT31, which is one of the canonical CIMP markers, was methylated at equal frequencies in Lynch syndrome CRCs (62%) as in sporadic MSI (60%). Of potential importance for understanding the genesis of tumors in Lynch syndrome, methylation at the APC promoter was more frequently observed in Lynch syndrome CRCs (48%) in comparison to both sporadic MSI (27%) and non-MSI (27%) tumors.
Hypermethylation frequency at individual markers is related to BRAF and KRAS mutational status in CRC
We interrogated the relationship between methylation frequencies at each of the 14 epigenetic markers and the presence or absence of BRAF/KRAS mutations in the total cohort of CRCs (Table 3). We observed that the six classical CIMP-related markers (hMLH1-5’ region,
NIH-PA Author Manuscript
NIH-PA Author Manuscript
hMLH1-3’ region, p16INK4a, MINT1, MINT2, and MINT31) along with Reprimo were significantly more frequently methylated in BRAF mutant CRCs compared to the other subgroups. However, we found that methylation frequencies at the other five markers (SFRP2, RASSF2A, MGMT, 3OST2, and HPP1) were almost same or relatively higher in CRCs harboring KRAS mutations. At the same time, APC methylation frequencies were comparable in all three subsets (25% in BRAF mutants, 29% in KRAS mutants, and 29% in wild types).
Epigenetic alterations can be interpreted in the context of the mutational spectrum of the
KRAS-BRAF genes
We estimated the odds ratios (OR) for methylation at each marker among subgroups of CRCs segregated by sporadic MSI/Lynch syndrome and BRAF/KRAS mutation status (Figure 2 and Supplemental Table). When ORs were calculated for sporadic MSI vs Lynch syndrome CRCs, we observed that methylation of all seven canonical CIMP markers, plus Reprimo, showed a positive risk for methylation in sporadic MSI tumors (Figure 2A). Contrariwise, methylation of MINT31 was significantly associated with Lynch syndrome cancers (OR, 5.74; 95%CI, 2.29–15.2). None of the other non-canonical epigenetic markers showed any risk associations based upon MSI and/or Lynch syndrome status.
We then examined ORs for methylation at each marker among the subgroups of CRCs categorized by BRAF/KRAS mutation status (Figure 2B). The ORs of the six canonical markers (hMLH1-5’ region, hMLH1-3’ region, p16INK4a, MINT1, MINT2, and MINT31), together with Reprimo were significantly higher in BRAF mutant CRCs, while five of the seven new markers (SFRP2, RASSF2A, MGMT, 3OST2, and HPP1) showed significantly higher ORs in KRAS mutant CRCs. Although the OR of p14ARF was the highest for BRAF mutant cancers, it was not significantly different compared to other two subgroups. Similarly, the OR for APC methylation was similar among various subsets (OR for BRAF mutant, 0.81; for KRAS mutant, 1.00; for wild type, 1.07). This analysis permitted us to categorize the epigenetic markers into three distinct subsets: BRAF-related markers (hMLH1-5’ region, hMLH1-3’ region,
p16INK4a, MINT1, MINT2, MINT31, and Reprimo); KRAS-related markers (SFRP2,
RASSF2A, MGMT, 3OST2, and HPP1); and markers independent of the BRAF/KRAS
mutations (p14ARF and APC).
Aberrant DNA methylation is more frequent in Lynch syndrome CRCs than in non-MSI CRCs
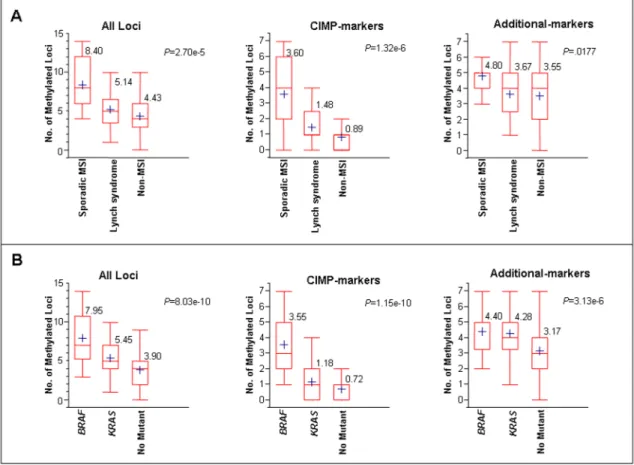
Both Lynch syndrome CRCs and tumors with methylated hMLH1 promoters have the MSI phenotype, but they arise through different pathways. To better understand the differences between these types of CRCs, we determined the average numbers of methylated loci in each subgroup of CRCs (Figure 3A and Table 4). When methylation data were utilized using all 14 epigenetic markers, the average number of methylated loci was highest in sporadic MSI CRCs (8.4; 95%CI, 6.0–10.2), followed by Lynch syndrome CRCs (5.1; 95%CI, 4.1–6.2), and was least in non-MSI CRCs (4.4; 95%CI, 4.1–4.8). Not surprisingly, when the data were analyzed using only the canonical CIMP markers (hMLH1-5’ region, hMLH1-3’ region, p16INK4a,
p14ARF, MINT1, MINT2, and MINT31), the average number of methylated loci was significantly higher in sporadic MSI CRCs (3.6; 95%CI, 2.3–4.9), compared to Lynch syndrome (1.5; 95%CI, 1.0–2.0), or non-MSI subgroups (0.9; 95%CI, 0.7–1.0; P<0.0001). However, interestingly, when the data were analyzed only using the seven additional methylation markers, the differences in average number of methylated loci between Lynch syndrome and non-MSI tumors became much smaller (sporadic MSI [4.8; 95%CI, 4.1–5.5], Lynch syndrome [3.7; 95%CI, 3.0–4.4], non-MSI [3.6; 95%CI, 3.3–3.8]).
Furthermore, the average numbers of methylated loci were consistently higher for Lynch syndrome CRCs compared with non-MSI CRCs (Table 4 and Figure 3A). More specifically, Lynch syndrome CRCs showed significantly higher methylation when data were analyzed from
NIH-PA Author Manuscript
NIH-PA Author Manuscript
seven CIMP canonical markers (1.5 versus 0.9; P=.0230). Although Lynch syndrome cancers were more frequently methylated than non-MSI cancers, these data did not reach significance when comparisons were drawn from 14 unselected epigenetic markers (5.1 versus 4.4;
P=0.2782), or the seven additional markers (3.7 versus 3.6; P=0.9977).
Comparable methylation frequencies occur in BRAF and KRAS mutant CRCs analyzed using the additional epigenetic markers
We then determined whether the average numbers of methylated loci were influenced by the presence of BRAF and KRAS mutations in CRC (Figure 3B and Table 4). When we used data from all 14 markers, we observed that the average number of methylated loci was highest in
BRAF mutated tumors (8.0; 95%CI, 6. 5–9. 5), followed by KRAS mutants (5. 5; 95%CI, 5.0–
6.0) and the lowest in CRCs with wild-type BRAF and KRAS genes (3.9; 95%CI, 3.5–4.3;
P<0.0001). Similar findings were observed when data were analyzed from the seven canonical
CIMP markers alone (BRAF mutant [3.55; 95%CI, 2.7–4.4], KRAS mutant [1.2; 95%CI, 0.9– 1.5], wild type [0.7; 95%CI, 0.6–0. 9]; P<0.0001).
Interestingly, when the data were analyzed using the seven additional markers, the average number of methylated loci in KRAS mutated cancers was no different than that in BRAF mutant CRCs (BRAF mutant [4.4; 95%CI, 3.7–5.1], KRAS mutant [4.3; 95%CI, 4.0–4.6]; P=0.8610), and average number of methylated loci in both of these subgroups was significantly higher than in the tumors lacking mutations in both BRAF and KRAS [3.2; 95%CI, 2.9–3. 5];BRAF vs Wild type, P<0.01; KRAS vs Wild type, P<0.0001).
Discussion
This study investigates the relationship between mutational activation in the RAS-RAF signaling pathway and global hypermethylation using a panel of epigenetic markers in a cohort of 487 colorectal tissues. More specifically, we asked whether CIMP in the colon is exclusively correlated with BRAF mutations, or whether it may also associate with mutant KRAS, since both genes are members of the same signaling pathway. Additionally, we asked whether CIMP is primarily a disease of older individuals with sporadic MSI CRCs, or whether Lynch syndrome CRCs may also have molecular features consistent with CIMP. We have provided evidence that aberrant hypermethylation of various tumor suppressor genes and related loci not only associate with mutant BRAF, but also with mutant KRAS, and that activation of the KRAS-BRAF pathway induces aberrant promoter methylation in multiple genes. Additionally, we found that Lynch syndrome CRCs have frequent methylation, challenging the supposition that CIMP is exclusively a molecular characteristic of sporadic CRCs.
Although the CIMP concept was first proposed in CRC almost a decade ago 2, only recently has evidence supported its existence in a specific subset of sporadic CRCs 3,4,8,9. In spite of this, the molecular basis of CIMP remains unclear and is a matter of active investigation. Currently, CIMP CRCs are characterized using a panel of markers that were selected, in part, through their association with the V600E BRAF mutation 11–13. Although the canonical CIMP-related markers are highly specific, this panel may not be completely adequate, as there is no consensus on the frequency of CIMP in CRC 8,9. Part of the problem may be attributed to differences in methodologies for measuring methylation in each laboratory, but central to this issue is a lack of consensus criteria and definitions for CIMP in CRC 8,9,14,15. Moreover, some studies have reported data in which a subset of CRCs have intermediate levels of aberrant DNA methylation defined as CIMP-low, as they failed to meet the more restrictive criteria for CIMP 14,32–35. This has led others to challenge the methylator phenotype as a discrete “pathway” in colorectal carcinogenesis.
NIH-PA Author Manuscript
NIH-PA Author Manuscript
Herein, we present data that clearly suggest that CIMP-associated aberrant methylation observed in CRCs may not be limited to those with V600E BRAF mutations. Rather, CIMP determination appears to be dependent upon the choice of methylation markers. When data are analyzed using canonical CIMP-related markers, one can identify a distinct cluster of CRCs that are strongly associated with mutant BRAF 14,33. However, this tight clustering of CRC disappears when additional epigenetic markers are analyzed. We demonstrate that when data are evaluated from canonical markers, BRAF mutant CRCs have the highest average number of methylated loci. However, when additional methylation markers are analyzed, both BRAF and KRAS mutated cancers show similar degrees of methylation, and methylation levels in these two subgroups are significantly higher than in CRCs that are wild-type for these genes. In comparison to the classical CIMP markers that strongly associate with mutant BRAF, data analysis with non-canonical methylation markers in our study resulted in loss of the typical bimodal distribution observed for CIMP-positive and negative tumors. However, these data are biologically relevant since a significant amount of aberrant methylation was associated with mutant KRAS. Additionally, when data were analyzed from only non-CIMP markers,
KRAS mutated and wild type CRCs were statistically distinguishable from each other (Table
4). Similar suggestions have been made in previous studies 11,36. It is difficult to directly compare our panel of non-canonical CIMP markers with the markers interrogated in the previous studies 11,36. A common feature among these studies is the suggestion that a significant amount of methylation positively associates with mutant KRAS in the colon. Since
KRAS and BRAF belong to the same growth signaling pathway, these data argue that activating
mutations in either of these genes may have equivalent effects in mediating aberrant DNA methylation. This brings the RAS/RAF story full circle, as it was initially found that KRAS mutations were responsible for upregulating DNA methylation and a methylator phenotype in vitro 20. In support of this, a recent study has clearly shown that Ras-mediated epigenetic silencing occurs through a specific, but complex pathway, involving components that are essential for maintaining a fully transformed phenotype in a fibroblast cell line 37.
It has been proposed that CIMP CRCs that harbor BRAF mutations and demonstrate MSI may originate through a unique pathway that includes the progression of sessile serrated polyps to MSI CRCs 38. It has been suggested that V600E BRAF mutations are present in sessile serrated polyps and serrated aberrant crypt foci (ACF), whereas, KRAS mutations are more highly associated with non-serrated polyps and ACFs 32,39. Interestingly, 90% of ACF with BRAF mutations were found to be MSS 39. Approximately 70% of sporadic MSI-H CRCs exhibit
BRAF mutations and a majority of sporadic MSI-H CRCs are caused by extensive
hypermethylation of the hMLH1 gene 17,32. Our data and that from others suggest that aberrant DNA methylation may be induced by upregulation of the RAS-RAF pathway 37, and that genetic alteration in BRAF or KRAS might be an earlier event that precedes aberrant DNA methylation.
In this study we noticed a positive association of RASSF2A methylation with mutant KRAS, which contradicts an earlier report 23. However, the study by Hesson and colleagues 23 involved a small subset of tissues (8 adenomas, and 33 carcinomas). A subsequent study analyzed a cohort of 140 CRCs, and reported that 67% of CRCs with RASSF2 methylation displayed BRAF or KRAS mutations (P=0.0009), and showed that inactivation of RASSF2 enhanced KRAS-induced oncogenic transformation 25. Our present data are in agreement with this recent study, and we feel confident that our data are reliable, and that RASSF2A methylation positively associates with mutant KRAS in the colon.
CIMP predominantly occurs in older individuals with sporadic MSI CRCs, but it has not been rigorously investigated in Lynch syndrome 32,40. In this study, we observed that sporadic MSI CRCs had the highest degree of aberrant methylation regardless of the epigenetic markers
NIH-PA Author Manuscript
NIH-PA Author Manuscript
analyzed 32. However, unexpectedly, we observed that Lynch syndrome patients, who were much younger, had higher degree of methylation than that of non-MSI CRCs, particularly when data were analyzed from seven canonical CIMP markers (P=0.023). It is possible that the higher degree of methylation observed in Lynch syndrome may be due, in part, to methylation events associated with the frequent KRAS mutations.
In the past decade, the efforts of several labs have been focused upon the molecular mechanisms of aberrant DNA methylation, but our current understanding into these processes is limited. Although this study does not provide a conclusive explanation for the specific processes that control DNA methylation, but our data provide indirect evidence that highlight the importance of KRAS-associated methylation events. We also found that aberrant DNA methylation is a much more common event in Lynch syndrome patients than was previously presumed. We speculate that genetic alterations in the BRAF and KRAS oncogenes is an early event in the evolution of a methylator phenotype, and that regulation of aberrant DNA methylation may be located downstream in the RAS-RAF signaling pathway. Finally, considering the paucity of information on the causes of CIMP, in the future studies it may be prudent to interpret aberrant DNA methylation in the context of mutations in both BRAF and KRAS genes.
Supplementary Material
Refer to Web version on PubMed Central for supplementary material.
Abbreviations
CIMP, CpG island methylator phenotype; C-N, normal colorectal tissue from a patient with colorectal cancer; COBRA, combined bisulfite restriction assay; CRC, colorectal cancer; MSI, microsatellite instability; MSI-H, MSI-high; MSI-L, MSI-low; MSS, microsatellite stable; N-N, colorectal tissue from a normal patient (without colorectal neoplasia).
Acknowledgements
The present work was supported by grants R01 CA72851 and R01 CA98572 from the National Cancer Institute, National Institutes of Health (to CRB), and funds from the Baylor Research Institute.
References
1. Herman JG, Baylin SB. Gene silencing in cancer in association with promoter hypermethylation. N Engl J Med 2003;349:2042–2054. [PubMed: 14627790]
2. Toyota M, Ahuja N, Ohe-Toyota M, et al. CpG island methylator phenotype in colorectal cancer. Proc Natl Acad Sci U S A 1999;96:8681–8686. [PubMed: 10411935]
3. Issa JP, Shen L, Toyota M. CIMP, at last. Gastroenterology 2005;129:1121–1124. [PubMed: 16143149]
4. Goel A, Nagasaka T, Arnold CN, et al. The CpG island methylator phenotype and chromosomal instability are inversely correlated in sporadic colorectal cancer. Gastroenterology 2007;132:127–138. [PubMed: 17087942]
5. Eads CA, Lord RV, Wickramasinghe K, et al. Epigenetic patterns in the progression of esophageal adenocarcinoma. Cancer Res 2001;61:3410–3418. [PubMed: 11309301]
6. Esteller M, Tortola S, Toyota M, et al. Hypermethylation-associated inactivation of p14(ARF) is independent of p16(INK4a) methylation and p53 mutational status. Cancer Res 2000;60:129–133. [PubMed: 10646864]
7. Yamashita K, Dai T, Dai Y, et al. Genetics supersedes epigenetics in colon cancer phenotype. Cancer Cell 2003;4:121–131. [PubMed: 12957287]
NIH-PA Author Manuscript
NIH-PA Author Manuscript
8. Samowitz WS, Albertsen H, Herrick J, et al. Evaluation of a large, population-based sample supports a CpG island methylator phenotype in colon cancer. Gastroenterology 2005;129:837–845. [PubMed: 16143123]
9. Ogino S, Kawasaki T, Kirkner GJ, et al. Evaluation of Markers for CpG Island Methylator Phenotype (CIMP) in Colorectal Cancer by a Large Population-Based Sample. J Mol Diagn. 2007
10. Davies H, Bignell GR, Cox C, et al. Mutations of the BRAF gene in human cancer. Nature 2002;417:949–954. [PubMed: 12068308]
11. Weisenberger DJ, Siegmund KD, Campan M, et al. CpG island methylator phenotype underlies sporadic microsatellite instability and is tightly associated with BRAF mutation in colorectal cancer. Nat Genet 2006;38:787–793. [PubMed: 16804544]
12. Toyota M, Ohe-Toyota M, Ahuja N, et al. Distinct genetic profiles in colorectal tumors with or without the CpG island methylator phenotype. Proc Natl Acad Sci U S A 2000;97:710–715. [PubMed: 10639144]
13. Toyota M, Issa JP. CpG island methylator phenotypes in aging and cancer. Semin Cancer Biol 1999;9:349–357. [PubMed: 10547343]
14. Samowitz WS, Albertsen H, Sweeney C, et al. Association of smoking, CpG island methylator phenotype, and V600E BRAF mutations in colon cancer. J Natl Cancer Inst 2006;98:1731–1738. [PubMed: 17148775]
15. Shen L, Kondo Y, Hamilton SR, et al. P14 methylation in human colon cancer is associated with microsatellite instability and wild-type p53. Gastroenterology 2003;124:626–633. [PubMed: 12612901]
16. Slattery ML, Curtin K, Sweeney C, et al. Diet and lifestyle factor associations with CpG island methylator phenotype and BRAF mutations in colon cancer. Int J Cancer 2007;120:656–663. [PubMed: 17096326]
17. Nagasaka T, Sasamoto H, Notohara K, et al. Colorectal cancer with mutation in BRAF, KRAS, and wild-type with respect to both oncogenes showing different patterns of DNA methylation. J Clin Oncol 2004;22:4584–4594. [PubMed: 15542810]
18. Iacopetta B, Grieu F, Li W, et al. APC gene methylation is inversely correlated with features of the CpG island methylator phenotype in colorectal cancer. Int J Cancer 2006;119:2272–2278. [PubMed: 16981189]
19. Kim JS, Lee C, Foxworth A, et al. B-Raf is dispensable for K-Ras-mediated oncogenesis in human cancer cells. Cancer Res 2004;64:1932–1937. [PubMed: 15026326]
20. Ordway JM, Williams K, Curran T. Transcription repression in oncogenic transformation: common targets of epigenetic repression in cells transformed by Fos, Ras or Dnmt1. Oncogene 2004;23:3737– 3748. [PubMed: 14990994]
21. Xiong Z, Laird PW. COBRA: a sensitive and quantitative DNA methylation assay. Nucleic Acids Res 1997;25:2532–2534. [PubMed: 9171110]
22. Suzuki H, Watkins DN, Jair KW, et al. Epigenetic inactivation of SFRP genes allows constitutive WNT signaling in colorectal cancer. Nat Genet 2004;36:471–422. [PubMed: 15107849]
23. Hesson LB, Wilson R, Morton D, et al. CpG island promoter hypermethylation of a novel Ras-effector gene RASSF2A is an early event in colon carcinogenesis and correlates inversely with K-ras mutations. Oncogene 2005;24:3987–3994. [PubMed: 15806169]
24. Takahashi T, Shigematsu H, Shivapurkar N, et al. Aberrant promoter methylation of multiple genes during multistep pathogenesis of colorectal cancers. Int J Cancer 2006;118:924–931. [PubMed: 16108009]
25. Akino K, Toyota M, Suzuki H, et al. The Ras effector RASSF2 is a novel tumor-suppressor gene in human colorectal cancer. Gastroenterology 2005;129:156–169. [PubMed: 16012945]
26. Esteller M, Sparks A, Toyota M, et al. Analysis of adenomatous polyposis coli promoter hypermethylation in human cancer. Cancer Res 2000;60:4366–4371. [PubMed: 10969779] 27. Young J, Biden KG, Simms LA, et al. HPP1: a transmembrane protein-encoding gene commonly
methylated in colorectal polyps and cancers. Proc Natl Acad Sci U S A 2001;98:265–270. [PubMed: 11120884]
NIH-PA Author Manuscript
NIH-PA Author Manuscript
28. Miyamoto K, Asada K, Fukutomi T, et al. Methylation-associated silencing of heparan sulfate D-glucosaminyl 3-O-sulfotransferase-2 (3-OST-2) in human breast, colon, lung and pancreatic cancers. Oncogene 2003;22:274–280. [PubMed: 12527896]
29. Nagasaka T, Sharp GB, Notohara K, et al. Hypermethylation of O6-methylguanine-DNA methyltransferase promoter may predict nonrecurrence after chemotherapy in colorectal cancer cases. Clin Cancer Res 2003;9:5306–5312. [PubMed: 14614014]
30. Boland CR, Thibodeau SN, Hamilton SR, et al. A National Cancer Institute Workshop on Microsatellite Instability for cancer detection and familial predisposition: development of international criteria for the determination of microsatellite instability in colorectal cancer. Cancer Res 1998;58:5248–5257. [PubMed: 9823339]
31. Kambara T, Matsubara N, Nakagawa H, et al. High frequency of low-level microsatellite instability in early colorectal cancer. Cancer Res 2001;61:7743–7746. [PubMed: 11691787]
32. Kambara T, Simms LA, Whitehall VL, et al. BRAF mutation is associated with DNA methylation in serrated polyps and cancers of the colorectum. Gut 2004;53:1137–1144. [PubMed: 15247181] 33. Ogino S, Kawasaki T, Kirkner GJ, et al. CpG island methylator phenotype-low (CIMP-low) in
colorectal cancer: possible associations with male sex and KRAS mutations. J Mol Diagn 2006;8:582–588. [PubMed: 17065427]
34. An C, Choi IS, Yao JC, et al. Prognostic significance of CpG island methylator phenotype and microsatellite instability in gastric carcinoma. Clin Cancer Res 2005;11:656–663. [PubMed: 15701853]
35. Rashid A, Shen L, Morris JS, et al. CpG island methylation in colorectal adenomas. Am J Pathol 2001;159:1129–1135. [PubMed: 11549606]
36. Shen L, Toyota M, Kondo Y, et al. Integrated genetic and epigenetic analysis identifies three different subclasses of colon cancer. Proc Natl Acad Sci U S A 2007;104:18654–18659. [PubMed: 18003927] 37. Gazin C, Wajapeyee N, Gobeil S, et al. An elaborate pathway required for Ras-mediated epigenetic
silencing. Nature 2007;449:1073–1077. [PubMed: 17960246]
38. Jass JR, Whitehall VL, Young J, et al. Emerging concepts in colorectal neoplasia. Gastroenterology 2002;123:862–876. [PubMed: 12198712]
39. Rosenberg DW, Yang S, Pleau DC, et al. Mutations in BRAF and KRAS differentially distinguish serrated versus non-serrated hyperplastic aberrant crypt foci in humans. Cancer Res 2007;67:3551– 3554. [PubMed: 17440063]
40. Yamamoto H, Min Y, Itoh F, et al. Differential involvement of the hypermethylator phenotype in hereditary and sporadic colorectal cancers with high-frequency microsatellite instability. Genes Chromosomes Cancer 2002;33:322–325. [PubMed: 11807990]
NIH-PA Author Manuscript
NIH-PA Author Manuscript
Figure 1. Frequent hypermethylation at multiple loci in CRCs
A) Distribution of all colorectal tissue specimens based upon the number of methylated
promoter loci. CRC denotes colorectal cancer; C-N denotes corresponding normal colonic epithelium; N-N denotes normal colonic epithelium without neoplasia at colonoscopy.
B) The figure illustrates COBRA data for seven canonical CIMP-related markers (hMLH1-5’
region, hMLH1-3’ region, p16INK4a, p14ARF, MINT1, MINT2 and MINT31) and the seven new markers (SFRP2, RASSF2A, MGMT, Reprimo, 3OST2, HPP1 and APC) in CRCs (T), corresponding normal colonic epithelium (N) and normal colonic epithelium without neoplasia on colonoscopy (NN). Mc indicates SssI methylase-treated control human genomic DNA. PCR conditions of p16, MINT1, MINT2, and MINT31 were described previously by Rashid et al., 35; and for that of p14 by Shen et al.,15
NIH-PA Author Manuscript
NIH-PA Author Manuscript
Figure 2. The odds ratio (OR) for methylation at each epigenetic marker in subgroups of CRCs categorized by MSI status (sporadic or Lynch syndrome) (panel A), or BRAF/KRAS mutational status (panel B)
A) The upper, middle, and bottom panels illustrate the ORs for sporadic MSI tumors (MSI),
Lynch syndrome CRCs, and non-MSI CRCs, respectively.
B) The upper, middle, and bottom panels illustrate the ORs for BRAF mutant CRCs (BRAF), KRAS mutant CRCs (KRAS), and wild type (both wild type) CRCs, respectively.
The vertical bars depict the 95% CIs for this ratio. An odds ratio (OR) >1.0 for a given marker is represented by a white square and suggests a positive association with that subgroup (>1.0), while an OR <1.0 represents a negative risk and is shown as black squares. An OR for an epigenetic marker that does not show any positive or negative associations is shown in gray. All odds ratios are presented in a log scale.
NIH-PA Author Manuscript
NIH-PA Author Manuscript
Figure 3. Average numbers of methylated loci in various subgroups of CRCs categorized by MSI status (panel A) or BRAF/KRAS mutation status (panel B)
The average number of methylated loci in each subset was calculated by all fourteen markers (all Loci), seven canonical CIMP markers (CIMP-related) or the seven additional markers (additional markers). In the box-plot diagrams, the horizontal line within each box represents the median; the limits of each box are the inter-quartile ranges, the whiskers are the maximum and minimum values, and the blue cross within each box depicts the mean value. The numbers above each box denotes the mean number of methylated loci. The P values above the square panels were based on Kruskal-Wallis one way analysis of variance on ranks, and represents the statistical differences in average methylation among all three subsets (sporadic MSI, Lynch syndrome and non-MSI) of CRCs. Statistical differences among any two individual groups are shown as pair-wise comparisons in Table 4.
NIH-PA Author Manuscript
NIH-PA Author Manuscript
NIH-PA Author Manuscript
NIH-PA Author Manuscript
NIH-PA Author Manuscript
Table 1
Primer sequences, Restriction endonuclease and PCR conditions for COBRA
Locus Primer Sequence Product Size (Restriction Enzyme) Temperature (Degrees in Celsius) hMLH1-5 F; 5′YGGGTAAGTYGTTTTGAYGTAGA3′ 148 (HhaI) 59 (5), 57 (10), 55 (30) R; 5′ATACCTAATCTATCRCCRCCTCATC3′ hMLH1-3 F; 5′GGGAGGGAYGAAGAGATTTAGT3′ 160 (RsaI) 59 (5), 57 (10), 55 (30) R; 5′ACCTTCAACCAATCACCTCAAT3′
p16INK4a F; 5′GGTTTTGGYGAGGGTTGTTT3′ 181 (TaqI) 58 (3), 56 (7), 54 (15), 52 (20)#
R; 5′ACCCTATCCCTCAAATCCTCTAAAA3′
p14ARF F; 5′TTTYGGGGYGGAGATGGGT3′ 160 (TaqI) 60 (45)##
R; 5′ATCACCAAAAACCTACRCACCATATTC3′
MINT1 F; 5′GGGTTGGAGAGTAGGGGAGTT3′ 199 (TaqI) 55 (45)#
R; 5′CCATCTAAAATTACCTCRATAACTTA3′
MINT2 F; 5′YGTTATGATTTTTTTGTTTAGTTAAT3′ 203 (TaqI) 60 (3), 58 (7), 56 (15), 54 (20)#
R; 5′TACACCAACTACCCAACTACCTC3′
MINT31 F; 5′GAYGGYGTAGTAGTTATTTTGTT3′ 185 (HpyCH4IV) 58 (3), 56 (7), 54 (15), 52 (20)#
R; 5′CATCACCACCCCTCACTTTAC3′
SFRP2 F; 5′GGTTGTTAGTTTTTYGGGGTTT3′ 148 (HhaI) 59 (5), 57 (10), 55 (30)
R; 5′AACCAAAACCCTACAACATCRT3′
RASSF2A F; 5′TTGGGGAGGGTTTGATAGTTT3′ 131 (TaqI) 62 (5), 60 (10), 58 (30)
R; 5′CRCACCCTACRCCCCTCTAAAA3′
MGMT F; 5′GTTTTTAGAAYGTTTTGYGTTT3′ 145 (BstUI) 53 (10), 50 (35)
R; 5′CCTACAAAACCACTCRAAACTA3′
Reprimo F; 5′GGGTTGGTTTAGTTTYGTTAAGTTT3′ 138 (TaqI) 60 (15), 58 (30)
R; 5′TAAAAATTTCCCAAAAACCTCTCC3′
3OST2 F; 5′TTTGGTTAGTAGTTTTIGGAGAAGA3′ 171 (TaqI) 60 (5), 58 (10), 56 (30)
R; 5′CCCTATAAACCATAACTCCATAAACC3′
HPP1 F; 5′TGTTTAGTAGTTYGTTGTTYGGTTT3′ 137 (NruI) 58 (5), 56 (10), 54 (30)
R; 5′AACCCTCGCAAAATATCCAAC3′
APC F; 5′GGTTTTGTGTTTTATTGYGGAGTG3′ 156 (TaqI) 60 (45)
R; 5′CACCAATACAACCACATATCIATCAC3′ #
PCR conditions described previously by Rashid et al., 35 ##
NIH-PA Author Manuscript
NIH-PA Author Manuscript
NIH-PA Author Manuscript
Table 2
Associations between clinico-pathological data, MSI status and mutation spectrum of the Ras pathway genes in all CRC patients
MSI status -% (n) BRAF/KRAS mutation status -% (n) MSI Non-MSI (n=207) P value BRAF mutant (n=20) KRAS mutant (n=80) Wild type (n=143) P value Sporadic (n=15) Lynch Syndrome (n=21) Age ≥65 80 (12) 5(1) 51 (105) <0.0001 a 0.0283 b <0.0001 c 65 (13) 56 (45) 42 (60) 0.4782 d 0.0523 e 0.0403 f <65 20 (3) 95 (20) 49 (102) 35 (7) 44 (35) 58 (83) Gender Female 60 (9) 19 (4) 35 (73) 0.0117 a 0.0553 b 0.1343 c 65 (13) 35 (28) 32 (45) 0.0147 d 0.0033 e 0.5899 f Male 40 (6) 81 (17) 65 (134) 35 (7) 65 (52) 69 (98) Location Proximal 92 (12) 69 (11) 30 (60) 0.0912 a <0.0001 b 0.0079 c 65 (11) 46 (36) 26 (36) 0.1507 d 0.0013 e 0.0047 f Distal 8 (1) 31 (5) 70 (143) 35 (6) 54 (42) 74 (101) Not known (2) (5) (4) (3) (2) (6) Stage I–II 67 (8) 67 (2) 40 (83) 1.000 a 0.0717 b 0.3558 c 50 (10) 39 (29) 43 (54) 0.3600 d 0.5498 e 0.5595 f III–IV 33 (4) 33 (1) 60 (123) 50 (10) 61 (46) 57 (72) Not known (3) (18) (1) (0) (5) (17) BRAF/KRAS Mutation Status BRAF mutant 67 (10) 0(0) 5(10) <0.0001 a <0.0001 b 0.5546 c -KRAS mutant 0(0) 33 (7) 35 (73)
-Both wild type
33 (5) 67 (14) 60 (124) -Abbreviations:
MSI, microsatellite instability;
BRAF mutant, CRCs with BRAF V600E mutation; KRAS mutant, CRCs with KRAS
mutations; Wild type, CRCs with neither
BRAF nor KRAS mutations. All P
values were calculated by the
X
2 test.
a P
values were calculated between Sporadic MSI vs. Lynch syndrome
b P
values were calculated between Sporadic MSI vs. Non-MSI cancers
c P
values were calculated between Lynch syndrome vs. Non-MSI
d P
values were calculated between BRAF mutant vs. KRAS mutant
e P
values were calculated between BRAF mutant vs. Wild Type
NIH-PA Author Manuscript
NIH-PA Author Manuscript
NIH-PA Author Manuscript
Table 3
Frequency of DNA methylation at each epigenetic marker in CRCs and its association with MSI status or mutation spectrum of the
BR AF/KRAS genes MSI status -% (n) BRAF/KRAS mutation status -% (n) MSI Epigenetic Marker Non-MSI (n=207) P value BRAF mutant (n=20) KRAS mutant (n=80) Wild Type (n=143) P value Total - %(no.) (n=243) Sporadic (n=15) Lynch syndrome (n=21) 0.0593 a <0.0001 d hMLH1 -5 22 (54) 60 (9) 29 (6) 19 (39) 0.0002 b 65 (13) 19 (15) 18 (26) <0.0001 e 0.2857 c 0.9163 f <0.0001 a <0.0001 d hMLH1 -3 4(9) 60 (9) 0 (0) 0 (0) <0.0001 b 35 (7) 0 (0) 1 (2) <0.0001 b NC c 0.2880 f 0.0009 a 0.0026 d P16 INK4a 17 (42) 53 (8) 5 (1) 16 (33) 0.0003 b 55 (11) 21 (17) 10 (14) <0.0001 e 0.1705 c 0.0177 f 0.1753 a 0.3873 d P14 ARF 10 (24) 33 (5) 14 (3) 8(16) 0.0011 b 20 (4) 13 (10) 7(10) 0.0518 e 0.3003 c 0.1675 f 0.2985 a 0.0298 d MINT1 12 (30) 40 (6) 24 (5) 9 (19) 0.0003 b 40 (8) 18 (14) 6 (8) <0.0001 e 0.0374 c 0.0042 f 0.0122 a <0.0001 d MINT2 21 (52) 53 (8) 14 (3) 20 (41) 0.0025 b 80 (16) 26 (21) 11 (15) <0.0001 e 0.5413 c 0.0022 f 0.9080 a 0.0006 d MINT31 26 (62) 60 (9) 62 (13) 19 (40) 0.0002 b 60 (12) 21 (17) 23 (33) 0.0005 e <0.0001 c 0.7537 f 0.5294 a 0.0209 d SFRP2 63 (154) 67 (10) 76 (16) 62 (128) 0.7095 b 55 (11) 80 (64) 55 (79) 0.9836 e 0.1938 c 0.0002 f 0.1020 a 0.4444 d RASSF2A 68 (164) 87 (13) 62 (13) 67 (138) 0.1088 b 75 (15) 83 (66) 58 (83) 0.1469 e 0.6602 c 0.0002 f 0.0301 a 0.4099 d MGMT 24 (59) 40 (6) 10 (2) 25 (51) 0.1884 b 30 (6) 40 (32) 15 (21) 0.0844 e 0.1182 c <0.0001 f 0.0314 a 0.0313 d Reprimo 24 (57) 53 (8) 19 (4) 22 (45) 0.0056 b 60 (12) 34 (27) 13 (18) <0.0001 e
NIH-PA Author Manuscript
NIH-PA Author Manuscript
NIH-PA Author Manuscript
MSI status -% (n) BRAF/KRAS mutation status -% (n) MSI Epigenetic Marker Non-MSI (n=207) P value BRAF mutant (n=20) KRAS mutant (n=80) Wild Type (n=143) P value Total - %(no.) (n=243) Sporadic (n=15) Lynch syndrome (n=21) 0.7748 c 0.0002 f 0.1736 a 0.0546 d 3OST2 82 (198) 93 (14) 76 (16) 81 (168) 0.2362 b 80 (16) 94 (75) 75 (107) 0.6145 e 0.5825 c 0.0005 f 0.1719 a 0.6234 d HPP1 69 (168) 87 (13) 67 (14) 68 (141) 0.1323 b 75 (15) 80 (64) 62 (89) 0.2660 e 0.8921 c 0.0061 f 0.2036 a 0.7383 d APC 29 (70) 27 (4) 48 (10) 27 (56) 0.9740 b 25 (5) 29 (23) 29 (42) 0.6861 e 0.0477 c 0.9221 f All P
values were calculated by the
X
2 test.
a P
values were calculated between Sporadic MSI vs. Lynch syndrome
b P
values were calculated between Sporadic MSI vs. Non-MSI cancers
c P
values were calculated between Lynch syndrome vs. Non-MSI
d P
values were calculated between BRAF mutant vs. KRAS mutant
e P
values were calculated between BRAF mutant vs. Wild Type
NIH-PA Author Manuscript
NIH-PA Author Manuscript
NIH-PA Author Manuscript
Table 4
Pair-wise comparisons of methylation levels for various epigenetic markers with different subgroups of CRCs segregated based upon their MSI status and BRAF/KRAS mutation status
Subset of Markers MSI status P value BRAF/KRAS mutation status P value
Pairwise Comparison Pairwise Comparison All Markers Sporadic MSI vs. Lynch
Syndrome
0.0101 BRAF vs. KRAS 0.0042
Sporadic MSI vs. Non-MSI 4.22e-05 BRAF vs. Wild type 2.56e-06
Lynch syndrome vs. Non-MSI 0.2782 KRAS vs. Wild type 1.40e-05
CIMP Markers Sporadic MSI vs. Lynch Syndrome
1.23e-02 BRAF vs. KRAS 3.44e-06
Sporadic MSI vs. Non-MSI 1.46e-05 BRAF vs. Wild type 1.05e-06
Lynch syndrome vs. Non-MSI 0.0230 KRAS vs. Wild type 0.0353
Additional Markers Sporadic MSI vs. Lynch Syndrome
0.0509 BRAF vs. KRAS 0.8610
Sporadic MSI vs. Non-MSI 0.0124 BRAF vs. Wild type 0.00883
Lynch syndrome vs. Non-MSI 0.9977 KRAS vs. Wild type 1.95e-05