a predictor of positive surgical margins (PSM)
in small prostates after robot-assisted radical
prostatectomy (RARP)
Patrick H. Tuliao, Kyo C. Koo, Christos Komninos, Chien H. Chang, Young D. Choi,
Byung H. Chung, Sung J. Hong and Koon H. Rha
Department of Urology and Urological Science Institute, Yonsei University College of Medicine, Seoul, Republic of Korea
Objective
To determine the impact of prostate size on positive surgical margin (PSM) rates after robot-assisted radical prostatectomy (RARP) and the preoperative factors associated with PSM.
Patients and Methods
In all, 1229 men underwent RARP by a single surgeon, from 2005 to August of 2013. Excluded were patients who had transurethral resection of the prostate, neoadjuvant therapy, clinically advanced cancer, and the first 200 performed cases (to reduce the effect of learning curve). Included were 815 patients who were then divided into three prostate size groups:<31 g (group 1), 31–45 g (group 2), >45 g (group 3). Multivariate analysis determined predictors of PSM and biochemical recurrence (BCR).
Results
Console time and blood loss increased with increasing prostate size. There were more high-grade tumours in group 1
(group 1 vs group 2 and group 3, 33.9% vs 25.1% and 25.6%, P= 0.003 and P = 0.005). PSM rates were higher in prostates of<45 g with preoperative PSA levels of >20 ng/dL, Gleason score≥7, T3 tumour, and ≥3 positive biopsy cores. In group 1, preoperative stage T3 [odds ratio (OR) 3.94, P= 0.020] and ≥3 positive biopsy cores (OR 2.52, P= 0.043) were predictive of PSM, while a PSA level of>20 ng/dL predicted the occurrence of BCR (OR 5.34, P= 0.021). No preoperative factors
predicted PSM or BCR for groups 2 and 3.
Conclusion
A preoperative biopsy with≥3 positive cores in men with small prostates predicts PSM after RARP. In small prostates with PSM, a PSA level of>20 ng/dL is a predictor of BCR. These factors should guide the choice of therapy and indicate the need for closer postoperative follow-up.
Keywords
prostate, prostatic neoplasms, prostatectomy, surgical margins
Introduction
The size of the prostate still remains a factor that influences choice of and delivery of surgical treatment for prostate cancer and has been shown to be associated with surgical and oncological outcomes [1–3]. Large glands have been associated with more difficult prostate surgery but more favourable oncological results [4,5], while small glands have been associated with shorter surgery but worse oncological results [6,7].
It has been suggested that the sudden surge in the use of robotic technology with its greatly magnified view and three-dimensional vision has allowed us to overcome the
limitations resulting from prostate size [8,9]. However, more data are needed to give credence to this assumption. Consequently, there is a need to identify which preoperative characteristics influence oncological outcomes after
robot-assisted radical prostatectomy (RARP). Such factors are not only important in preoperative planning and managing patient expectations, but should be valuable in designing follow-up schemes and deciding on further therapy after surgery.
The present study determined the impact of prostate size on the oncological outcomes and preoperative factors that predict positive surgical margin (PSM) and biochemical recurrence (BCR) in patients with PSM after RARP.
Patients and Methods
This was a retrospective analysis of 1229 men who underwent RARP, performed by a single surgeon from 2005 to August of 2013, in a single high-volume tertiary institution.
To reduce the learning curve bias, we excluded our first 200 cases from this study. We also excluded 60 patients who had previous TURP, 43 who had preoperative neoadjuvant therapy, and 111 with clinically advanced (N1 or M1 via preoperative MRI and/or bone scan) prostate cancer. The 815 patients who were included in this study were then divided into tertiles based on prostate size as follows:<31 g (group 1, n = 271), 31–45 g (group 2, n= 271), >45 g (group 3, n = 273). We based our prostate size groupings on the pathological prostate weight instead of the TRUS volume for more accurate measurements.
RARP was performed as previously described [10]. Pelvic lymph node dissection was performed for patients with intermediate- to high-risk cancer based on the D’Amico classification. Bilateral nerve-sparing surgery (NSS) was done routinely for localised cancer and was performed in locally advanced cancer as long as the frozen section analysis was negative. Pathological analysis of the specimen was performed by a dedicated team of pathologists and the findings were prospectively collected in an electronic database.
The three groups were compared based on perioperative, pathological and oncological characteristics. With a few exceptions, a 12-core prostate biopsy was routinely taken in our institution. Preoperative MRI was done routinely in all patients for the purpose of tumour staging. The primary endpoint of this study was PSM rates in the different prostate size groups. PSM rates were compared across groups based on preoperative characteristics [PSA level, biopsy Gleason score, number of positive biopsy cores, maximum percentage of tumour per biopsy core, and extraprostatic extension (EPE) on preoperative MRI], location, and level of nerve-sparing technique. We categorically classified the number of positive biopsy cores into<3 and >3 based on the computed overall median value. BCR in patients with PSM was a secondary endpoint. BCR was defined as two consecutive PSA levels of >0.02 ng/dL.
Our patients followed a standardised follow-up schedule composed of monthly follow-ups for the first 6 months after RARP, a follow-up at 12 months, then yearly follow-ups as needed. Each visit included a PSA measurement. An MRI was taken commonly on the third month of follow-up as part of the patient insurance package. MRI was also used to confirm suspicions of tumour recurrence or metastasis and in patients suspected of having infected lymphoceles.
We used SPSS to divide the prostate sizes into tertiles. The mean and standard deviation (SD) were used to describe continuous variables. Comparative tests (Student’s t-test,
chi-squared test) were used to compare continuous and categorical variables. Univariate and multivariate analyses were used to determine the preoperative predictors of PSM both in the overall study population and in patients who had NSS. Univariate and multivariate analysis determined the predictors of BCR overall and BCR only in patients with PSM. Statistical significance was set at P< 0.050 for all two-sided tests. All statistical analyses were performed using SPSS version 20 (IBM Corp., Armonk, NY, USA). This study was approved by our Institutional Review Board.
Results
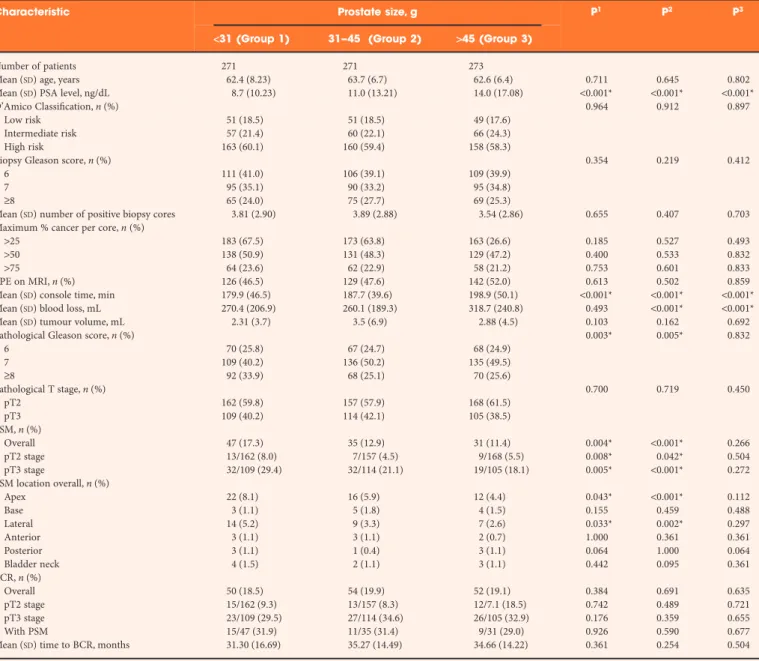
Table 1 describes the preoperative, perioperative, pathological and oncological characteristics of patients. The three groups were similar in terms of preoperative characteristics except for PSA levels, which was highest in group 3 (>45 g glands). Although mean blood loss was higher in prostates weighing >45 g, only nine patients required blood transfusion postoperatively. Compared with prostates>31 g, prostates measuring<31 g had more PSM regardless of pathological T stage.
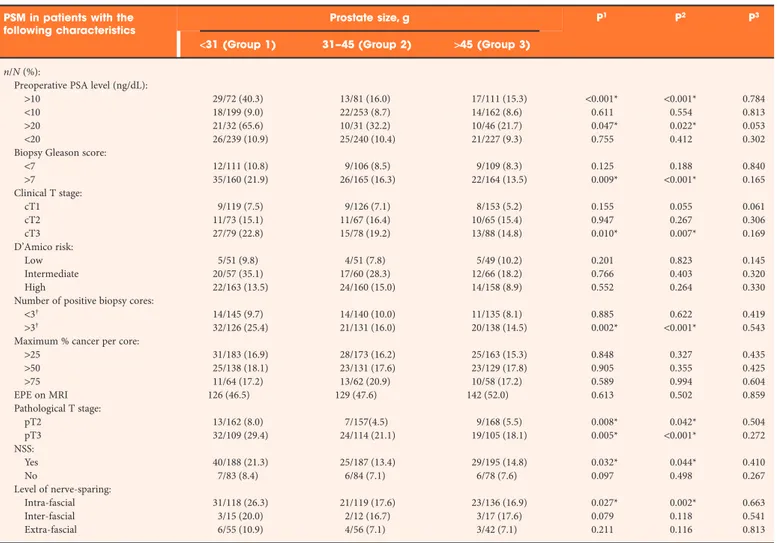
The characteristics of PSM based on preoperative, pathological and oncological parameters are given in Table 2. The tumour volumes were not significantly different for each category of prostate size. The largest tumour volumes for each group were all found in patients who had high-grade (Gleason scores 8, 9 and 9) and pathological T3 disease. The overall PSM rate, regardless of pathological T stage or type of NSS performed was 13.9%. The relative risk of PSM after NSS, compared with patients who did not have NSS, for groups 1–3 were 2.93 (95% CI 1.25–6.96, P= 0.010), 2.00 (95% CI 0.79–5.09, P = 0.136) and 2.10 (95% CI 0.83–5.27, P= 0.109), respectively. NSS was performed in 69.4%, 69.0%, 71.4% of glands in groups 1–3, respectively. There were PSMs in 19 of 245 (6.9%) men who did not have NSS. They were all aged>65 years, had palpable disease, and biopsy Gleason scores≥7. For each grouping based on prostate size, the most common location of PSM was in the apex. However, when comparing the three groups, apically located PSM occurred significantly more frequently in Group 1.
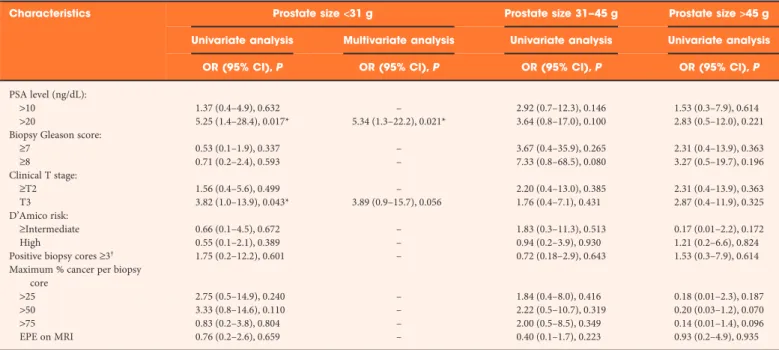
Table 3 describes the preoperative predictors of PSM. Multivariate analysis was not performed for prostate size >45 g because only one variable (PSA level >20 ng/dL) was significant during univariate analysis.
Multivariate analysis revealed that PSA level [odds ratio (OR) 1.04, 95% CI 1.02–1.05; P< 0.001), PSM (OR 2.15, 95% CI 1.37–3.35, P= 0.001) and clinical T stage (OR 1.519, 95% CI 1.38–1.68, P< 0.001) were predictors of BCR overall. For group 1, PSM (OR 2.41, 95% CI 1.11–5.25, P= 0.027), and clinical T stage (OR 1.36, 95% CI 1.14–1.62, P= 0.001) were predictors of BCR. For group 2, clinical T stage (OR 1.39, 95% CI 1.13–1.72, P= 0.002) and biopsy Gleason score (OR 3.51,
95% CI 2.28–5.37, P< 0.001) were predictors of BCR. For group 3, PSA level (OR 1.031, 95% CI 1.01–1.05, P= 0.003), clinical T stage (OR 2.09, 95% CI 1.35–3.24, P= 0.001) and biopsy Gleason score (OR 2.13, 95% CI 1.40–3.06, P< 0.001) were predictors of BCR. PSM was not a predictor of BCR in Groups 2 and 3.
Table 4 describes the predictors of BCR in PSM-positive cases. BCR occurred in 30.4% of men who were found to have PSM overall. The mean (SD) follow-up durations were 18.1 (13.53), 18.2 (13.43), and 18.5 (13.49) months for groups 1–3, respectively and were not significantly different from each other.
Discussion
In terms of the effect of prostate size on various clinical and perioperative parameters, our present results are in agreement with most previous articles [11–13]. Increasing body mass index has been linked to larger prostate glands in men with localised prostate cancer and has been attributed to obesity related inflammatory changes [14,15]. Higher PSA levels in larger glands are probably due to increased PSA production by the adenoma rather than a reflection of tumour
aggressiveness. The longer mean operative time and greater intraoperative blood loss in larger glands mirrors the degree of difficulty of the surgery. Surgery on larger glands is more
Table 1Comparison of pre- and perioperative, pathological and oncological characteristics.
Characteristic Prostate size, g P1 P2 P3
<31 (Group 1) 31–45 (Group 2) >45 (Group 3)
Number of patients 271 271 273
Mean (SD) age, years 62.4 (8.23) 63.7 (6.7) 62.6 (6.4) 0.711 0.645 0.802
Mean (SD) PSA level, ng/dL 8.7 (10.23) 11.0 (13.21) 14.0 (17.08) <0.001* <0.001* <0.001*
D’Amico Classification, n (%) 0.964 0.912 0.897
Low risk 51 (18.5) 51 (18.5) 49 (17.6)
Intermediate risk 57 (21.4) 60 (22.1) 66 (24.3)
High risk 163 (60.1) 160 (59.4) 158 (58.3)
Biopsy Gleason score, n (%) 0.354 0.219 0.412
6 111 (41.0) 106 (39.1) 109 (39.9)
7 95 (35.1) 90 (33.2) 95 (34.8)
≥8 65 (24.0) 75 (27.7) 69 (25.3)
Mean (SD) number of positive biopsy cores 3.81 (2.90) 3.89 (2.88) 3.54 (2.86) 0.655 0.407 0.703
Maximum % cancer per core, n (%)
>25 183 (67.5) 173 (63.8) 163 (26.6) 0.185 0.527 0.493
>50 138 (50.9) 131 (48.3) 129 (47.2) 0.400 0.533 0.832
>75 64 (23.6) 62 (22.9) 58 (21.2) 0.753 0.601 0.833
EPE on MRI, n (%) 126 (46.5) 129 (47.6) 142 (52.0) 0.613 0.502 0.859
Mean (SD) console time, min 179.9 (46.5) 187.7 (39.6) 198.9 (50.1) <0.001* <0.001* <0.001*
Mean (SD) blood loss, mL 270.4 (206.9) 260.1 (189.3) 318.7 (240.8) 0.493 <0.001* <0.001*
Mean (SD) tumour volume, mL 2.31 (3.7) 3.5 (6.9) 2.88 (4.5) 0.103 0.162 0.692
Pathological Gleason score, n (%) 0.003* 0.005* 0.832
6 70 (25.8) 67 (24.7) 68 (24.9) 7 109 (40.2) 136 (50.2) 135 (49.5) ≥8 92 (33.9) 68 (25.1) 70 (25.6) Pathological T stage, n (%) 0.700 0.719 0.450 pT2 162 (59.8) 157 (57.9) 168 (61.5) pT3 109 (40.2) 114 (42.1) 105 (38.5) PSM, n (%) Overall 47 (17.3) 35 (12.9) 31 (11.4) 0.004* <0.001* 0.266 pT2 stage 13/162 (8.0) 7/157 (4.5) 9/168 (5.5) 0.008* 0.042* 0.504 pT3 stage 32/109 (29.4) 32/114 (21.1) 19/105 (18.1) 0.005* <0.001* 0.272 PSM location overall, n (%) Apex 22 (8.1) 16 (5.9) 12 (4.4) 0.043* <0.001* 0.112 Base 3 (1.1) 5 (1.8) 4 (1.5) 0.155 0.459 0.488 Lateral 14 (5.2) 9 (3.3) 7 (2.6) 0.033* 0.002* 0.297 Anterior 3 (1.1) 3 (1.1) 2 (0.7) 1.000 0.361 0.361 Posterior 3 (1.1) 1 (0.4) 3 (1.1) 0.064 1.000 0.064 Bladder neck 4 (1.5) 2 (1.1) 3 (1.1) 0.442 0.095 0.361 BCR, n (%) Overall 50 (18.5) 54 (19.9) 52 (19.1) 0.384 0.691 0.635 pT2 stage 15/162 (9.3) 13/157 (8.3) 12/7.1 (18.5) 0.742 0.489 0.721 pT3 stage 23/109 (29.5) 27/114 (34.6) 26/105 (32.9) 0.176 0.359 0.655 With PSM 15/47 (31.9) 11/35 (31.4) 9/31 (29.0) 0.926 0.590 0.677
Mean (SD) time to BCR, months 31.30 (16.69) 35.27 (14.49) 34.66 (14.22) 0.361 0.254 0.504
complicated because of a limited space to manoeuvre, difficulty in separating the prostate from the bladder due to the presence of a median lobe, more difficult neurovascular bundle dissection and increased need for bladder
reconstruction [16,17].
The issue about the effect of prostate size on oncological results has revolved mostly around its effect on PSM rates. In the study by Marchetti et al. [18] of 690 patients with low-risk prostate cancer who underwent bilateral nerve-sparing RARP, lower prostate weight was shown to have a higher probability of PSM. In the study by Skolarus et al. [19], prostates weighing >50 g, when compared with those weighing <50 g, were not associated with increased incidence of PSM. Our present study reports an overall PSM rate of 17.3%, 12.9% and 11.4% % in groups 1–3 respectively, which are consistent with previously reported PSM rates ranging from 22% to 43% [18,20]. However, prudence should be exercised in interpreting these values given the lack of a standardised classification of prostate size.
While the association of increased PSM with smaller prostates has largely been explained by lead-time bias, our present data are more consistent with the theory that cancer in small prostates has different biological activity. In contrast to previous studies reporting more advanced age in men with larger prostates [17,19], our present study failed to find significant differences in age between prostate size groups, hence making lead-time bias less likely. The impact of surgical skill and learning curve on PSM rates has previously been raised [21], but excluding our first 200 cases should have negated this factor.
In their study of 700 post-RARP patients, Yadav et al. [22] found a higher incidence of EPE and PSM in small prostates (40 g) compared with glands weighing 40–70 and>70 g. In a more recent study, Labanaris et al. [23] performed a matched-pair analysis on the results of RARP in men with<50 and >100 g prostates. They reported that men with smaller prostates had larger tumour volumes, were less organ-confined, had more EPE and had more BCR. These
Table 2PSM based on preoperative characteristics, pathological characteristics and level of nerve-sparing.
PSM in patients with the following characteristics
Prostate size, g P1 P2 P3
<31 (Group 1) 31–45 (Group 2) >45 (Group 3) n/N (%):
Preoperative PSA level (ng/dL):
>10 29/72 (40.3) 13/81 (16.0) 17/111 (15.3) <0.001* <0.001* 0.784
<10 18/199 (9.0) 22/253 (8.7) 14/162 (8.6) 0.611 0.554 0.813
>20 21/32 (65.6) 10/31 (32.2) 10/46 (21.7) 0.047* 0.022* 0.053
<20 26/239 (10.9) 25/240 (10.4) 21/227 (9.3) 0.755 0.412 0.302
Biopsy Gleason score:
<7 12/111 (10.8) 9/106 (8.5) 9/109 (8.3) 0.125 0.188 0.840 >7 35/160 (21.9) 26/165 (16.3) 22/164 (13.5) 0.009* <0.001* 0.165 Clinical T stage: cT1 9/119 (7.5) 9/126 (7.1) 8/153 (5.2) 0.155 0.055 0.061 cT2 11/73 (15.1) 11/67 (16.4) 10/65 (15.4) 0.947 0.267 0.306 cT3 27/79 (22.8) 15/78 (19.2) 13/88 (14.8) 0.010* 0.007* 0.169 D’Amico risk: Low 5/51 (9.8) 4/51 (7.8) 5/49 (10.2) 0.201 0.823 0.145 Intermediate 20/57 (35.1) 17/60 (28.3) 12/66 (18.2) 0.766 0.403 0.320 High 22/163 (13.5) 24/160 (15.0) 14/158 (8.9) 0.552 0.264 0.330
Number of positive biopsy cores:
<3† 14/145 (9.7) 14/140 (10.0) 11/135 (8.1) 0.885 0.622 0.419
>3† 32/126 (25.4) 21/131 (16.0) 20/138 (14.5) 0.002* <0.001* 0.543
Maximum % cancer per core:
>25 31/183 (16.9) 28/173 (16.2) 25/163 (15.3) 0.848 0.327 0.435 >50 25/138 (18.1) 23/131 (17.6) 23/129 (17.8) 0.905 0.355 0.425 >75 11/64 (17.2) 13/62 (20.9) 10/58 (17.2) 0.589 0.994 0.604 EPE on MRI 126 (46.5) 129 (47.6) 142 (52.0) 0.613 0.502 0.859 Pathological T stage: pT2 13/162 (8.0) 7/157(4.5) 9/168 (5.5) 0.008* 0.042* 0.504 pT3 32/109 (29.4) 24/114 (21.1) 19/105 (18.1) 0.005* <0.001* 0.272 NSS: Yes 40/188 (21.3) 25/187 (13.4) 29/195 (14.8) 0.032* 0.044* 0.410 No 7/83 (8.4) 6/84 (7.1) 6/78 (7.6) 0.097 0.498 0.267 Level of nerve-sparing: Intra-fascial 31/118 (26.3) 21/119 (17.6) 23/136 (16.9) 0.027* 0.002* 0.663 Inter-fascial 3/15 (20.0) 2/12 (16.7) 3/17 (17.6) 0.079 0.118 0.541 Extra-fascial 6/55 (10.9) 4/56 (7.1) 3/42 (7.1) 0.211 0.116 0.813
Table 3 Univ ariat e and m ultiv ariat e analysis of pr eoper ativ e p redict ors of PSM o ve rall and aft er NSS. Char act er istics Pr ost at e size <31 g P rost at e size 31 – 45 g P rost at e size >45 g ‡ Univ ar iat e analysis Multiv ar iat e analysis Univ ar iat e analysis Multiv ar iat e analysis Univ ar iat e analysis OR (95% CI), P OR (95% CI), P OR (95% CI), P OR (95% CI), P OR (95% CI), P Ov er al l PSA le vel (ng/dL): >10 1.87 (0.9–3.7), 0.071 – 1.46 (0.7–3.1), 0.317 – 1.89 (0.9–4.0), 0.099 >20 1.89 (1.0–3.6), 0.048 2.09 (0.8–5.6), 0.141 2.52 (1.2–5.3), 0.025* 2.35 (0.8–3.1), 0.067 2.70 (1.2–6.2), 0.019* B iopsy Gleason score: >7 1.77 (0.9–3.4), 0.087 – 2.64 (1.1–6.3), 0.029* 2.08 (0.8–5.1), 0.112 1.72 (0.8–3.8), 0.195 >8 1.23 (0.7–2.3), 0.516 – 1.77 (0.8–3.9), 0.151 – 1.66 (0.8–3.7), 0.211 Clinical T sta ge : >T2 1.35 (0.7–2.6), 0.360 – 1.78 (0.8–3.8), 0.148 – 1.19 (0.6–2.6), 0.651 >T3 2.03 (1.0–4.1), 0.047* 2.84 (0.9–3.1), 0.007* 2.07 (1.0–4.2), 0.047* 1.79 (0.8–3.8), 0.137 1.14 (0.5–2.4), 0.740 D’Amico risk: ≥I nterme dia te 1.52 (0.7–3.4), 0.308 – 1.37 (0.6–2.9), 0.418 – 2.34 (0.7–8.1), 0.180 H ig h 1.52 (0.8–3.0), 0.231 – 0.54 (0.3–1.1), 0.106 – 1.48 (0.7–3.3), 0.343 P osi ti ve bi opsy cores ≥3 † 3.26 (1.6–6.4), 0.001* 3.43 (1.5–7.9), 0.004* 2.31 (1.1–4.7), 0.024* 2.102 (0.9–4.5), 0.053 1.43 (0.7–3.0), 0.348 M aximum % ca n cer p er bi opsy core: >25 0.78 (0.4–1.6), 0.516 – 1.12 (0.7–3.3), 0.112 – 3.05 (0.8–10.5), 0.078 >50 1.05 (0.5–2.0), 0.898 – 1.99 (0.9–4.3), 0.078 – 2.03 (0.8–2.9), 0.114 >75 0.94 (0.4–2.0), 0.873 – 2.04 (0.9–4.4), 0.065 – 2.12 (0.9–4.9), 0.084 EPE on MRI 2.92 (0.5–5.7), 0.125 – 0.80 (0.4–1.6), 0.548 – 0.54 (0.2–1.2), 0.119 Af ter NSS PSA le vel (ng/dL): >10 1.77 (0.8–4.1), 0.178 – 0.625 (0.2–1.6), 0.354 – 2.85 (0.9–8.7), 0.067 >20 2.18 (1.0–4.5), 0.038* 2.52 (0.9–0.3), 0.067 1.49 (1.1–4.9), 0.045* – 4.18 (1.4–12.9), 0.013* B iopsy Gleason score: ≥7 1.57 (0.7–3.6), 0.290 – 1.50 (0.6–3.8), 0.394 – 1.27 (0.4–3.9), 0.680 ≥8 1.18 (0.5–2.6), 0.686 – 1.24 (0.5–3.1), 0.641 – 1.48 (0.5–4.5), 0.493 Clinical T sta ge : ≥T2 1.16 (0.5–2.6), 0.719 – 1.70 (0.7–4.3), 0.261 – 1.13 (0.4–3.5), 0.835 >T3 2.20 (1.1–4.8), 0.04* 3.94 (1.3–12.6), 0.020* 1.92 (0.8–4.4), 0.126 – 0.79 (0.3–2.3), 0.658 D’Amico risk: ≥I nterme dia te 0.96 (0.4–2.3), 0.924 – 0.80 (0.4–2.3), 0.801 – 2.47 (0.5–11.5), 0.250 H ig h 1.56 (0.7–3.7), 0.312 – 0.71 (0.3–1.7), 0.450 – 2.67 (0.9–8.4), 0.090 P osi ti ve bi opsy cores ≥3 † 2.52 (1.1–5.3), 0.01* 2.52 (1.1–6.4), 0.043* 2.05 (0.9–4.7), 0.089 – 1.03 (0.4–2.9), 0.958 M aximum % ca n cer p er bi opsy core: >25 0.57 (0.2–1.6), 0.284 – 1.17 (0.4–3.5), 0.785 – 1.34 (0.3–6.8), 0.722 >50 0.76 (0.1–1.5), 0.578 – 1.37 (0.5–3.7), 0.528 – 1.11 (0.3–4.3), 0.880 >75 0.39 (0.1–1.5), 0.163 – 1.23 (0.4–3.8), 0.721 – 0.41 (0.05–3.4), 0.405 EPE on MRI 0.94 (0.4–2.4), 0.887 – 0.59 (0.2–1.6), 0.307 – 0.69 (0.2–2.6), 0.591 *S ig ni fic ant; †M ed ia n spl it ; ‡M u lt iv ar ia te an al ysis not done fo r prosta te size >45 g.
studies focused on pathological variables and did not establish a direct relationship between preoperative factors and PSM. In their study of 876 patients who underwent RARP, Coelho et al. [24] reported PSA as the only preoperative variable associated with PSM, but prostate size was not accounted for. In our present study, having≥3 positive biopsy cores and a T3 tumour in small prostates predicted PSM after RARP, but failed to do so for 31–45 and>45 g prostates. More positive biopsies indirectly reflect a larger volume of tumour. When this is present in small prostates, there is a higher possibility of exposing this tumour during dissection. In contrast, the larger amount of benign tissues in medium-sized and large glands decreases the chances of tumour exposure. Furthermore, the risk of having PSM is almost three-fold if NSS is performed. This higher rate of PSM after NSS could be attributed to surgical technique or tumour behaviour [25]. The increased lateral PSM supports the theory of an increased temptation to dissect closer to the prostate for better neurovascular bundle preservation when operating on a small prostate. There is a lesser tendency to dissect closer to the prostate in larger glands because of more limited space to manoeuvre. Also, there were more high-grade tumours in small prostates indicating their more aggressive tendency. The mean tumour volumes were similar, which implies that the same volume of tumour was housed in the smaller prostates, thereby increasing the likelihood of exposing them during dissection. Finally, compared with large glands wherein the demarcation between the prostate and urethra are more pronounced, we think that in small prostates, it is more difficult to identify the
prostato-urethral junction. This accounts for the increased apical PSM for small prostates in our present data.
While it seems logical to assume that an increase in PSM in small prostates will lead to increase in BCR, there are
conflicting reports about the relationship between prostate size and BCR. In a previous article, Anastasiou et al. [26] reported that a lower prostate weight protects against BCR, while Labanaris et al. [23] reported the opposite to be true. In our present study, a small prostate size was indirectly related to BCR because in the presence of PSM, a PSA level of >20 ng/dL was a predictor of BCR. Also, in our present study, no preoperative factors predicted BCR in glands weighing 31–45 and>45 g. Variables other than PSM can influence BCR [27]. In our present study, preoperative factors, such as T stage and biopsy Gleason score, were predictors of BCR for prostates in the 31–45 and>45 g groups. Other pathological factors, such as lymph node metastasis which were not the focus of our present study, could have easily influenced the occurrence of BCR in these larger glands.
Given the present findings, we think that the presence preoperatively of≥3 positive biopsy cores and T3 stage tumour in smaller glands should be given importance during surgical planning and patient counselling. Intraoperatively, aside from performing meticulous dissection of the prostate and neurovascular bundle, it might be wise to send more specimens for frozen-section analysis in RARP done on small prostates [28,29]. For those patients who have a preoperative PSA level of>20 ng/dL and are found to have PSM, a closer
Table 4Multivariate analysis of preoperative predictors of BCR in cases with PSM.
Characteristics Prostate size<31 g Prostate size 31–45 g Prostate size>45 g
Univariate analysis Multivariate analysis Univariate analysis Univariate analysis
OR (95% CI), P OR (95% CI), P OR (95% CI), P OR (95% CI), P
PSA level (ng/dL):
>10 1.37 (0.4–4.9), 0.632 – 2.92 (0.7–12.3), 0.146 1.53 (0.3–7.9), 0.614
>20 5.25 (1.4–28.4), 0.017* 5.34 (1.3–22.2), 0.021* 3.64 (0.8–17.0), 0.100 2.83 (0.5–12.0), 0.221
Biopsy Gleason score:
≥7 0.53 (0.1–1.9), 0.337 – 3.67 (0.4–35.9), 0.265 2.31 (0.4–13.9), 0.363 ≥8 0.71 (0.2–2.4), 0.593 – 7.33 (0.8–68.5), 0.080 3.27 (0.5–19.7), 0.196 Clinical T stage: ≥T2 1.56 (0.4–5.6), 0.499 – 2.20 (0.4–13.0), 0.385 2.31 (0.4–13.9), 0.363 T3 3.82 (1.0–13.9), 0.043* 3.89 (0.9–15.7), 0.056 1.76 (0.4–7.1), 0.431 2.87 (0.4–11.9), 0.325 D’Amico risk: ≥Intermediate 0.66 (0.1–4.5), 0.672 – 1.83 (0.3–11.3), 0.513 0.17 (0.01–2.2), 0.172 High 0.55 (0.1–2.1), 0.389 – 0.94 (0.2–3.9), 0.930 1.21 (0.2–6.6), 0.824
Positive biopsy cores≥3† 1.75 (0.2–12.2), 0.601 – 0.72 (0.18–2.9), 0.643 1.53 (0.3–7.9), 0.614
Maximum % cancer per biopsy core
>25 2.75 (0.5–14.9), 0.240 – 1.84 (0.4–8.0), 0.416 0.18 (0.01–2.3), 0.187
>50 3.33 (0.8–14.6), 0.110 – 2.22 (0.5–10.7), 0.319 0.20 (0.03–1.2), 0.070
>75 0.83 (0.2–3.8), 0.804 – 2.00 (0.5–8.5), 0.349 0.14 (0.01–1.4), 0.096
EPE on MRI 0.76 (0.2–2.6), 0.659 – 0.40 (0.1–1.7), 0.223 0.93 (0.2–4.9), 0.935
follow-up scheme should be instituted and a lower threshold for adjuvant therapy may be in order. The apparent absence of preoperative factors to predict PSM in larger glands and BCR in larger glands with PSM warrants further investigation into factors that are not available preoperatively.
The present study is limited by the fact that it is from a single institution with a high case volume and thus our results may not be representative of cases done in other centres with fewer cases. Also, the oncological outcome data contained in the present series were taken from the results of operations performed by one surgeon who has done>1000 RARPs and might therefore not be readily applicable to surgeons with less experience using this approach. Furthermore, a better association between prostate size and BCR as well as survival rates would benefit from a more detailed investigation after a longer follow-up period. Further studies on the effect of prostate size on other outcomes after RARP, such as functional outcomes, are still needed.
In conclusion, the present study established certain preoperative predictive factors for PSM and BCR based on prostate gland size. Regardless of tumour stage and performance of NSS, men with smaller prostates have higher grade cancer and a greater likelihood of having PSM. The preoperative presence of≥3 positive biopsy cores in a small prostate predicted PSM regardless of Gleason score. For small prostates who exhibit PSM on pathological analysis, a preoperative PSA level of>20 ng/dL is predictive of BCR. These factors can be used for preoperative planning, patient counselling and postoperative evaluation.
Conflicts of Interest
The authors of this article have no conflicts of interest to disclose.
References
1 Koutlidis N, Mourey E, Champigneulle J, Mangin P, Cormier L.
Robot-assisted or pure laparoscopic nerve-sparing radical prostatectomy: what is the optimal procedure for the surgical margins? A single center experience. Int J Urol 2012; 19: 1076–81
2 Freedland SJ, Isaacs WB, Platz EA et al.Prostate size and risk of high-grade, advanced prostate cancer and biochemical progression after radical prostatectomy: a search database study. J Clin Oncol 2005; 23: 7546–54
3 Chan RC, Barocas DA, Chang SS et al.Effect of a large prostate gland on open and robotically assisted laparoscopic radical prostatectomy. BJU Int 2008; 101: 1140–4
4 Pettus JA, Masterson T, Sokol A et al.Prostate size is associated with surgical difficulty but not functional outcome at 1 year after radical prostatectomy. J Urol 2009; 182: 949–55
5 Pierorazio PM, Kinnaman MD, Wosnitzer MS, Benson MC, McKiernan JM, Goluboff ET.Prostate volume and pathologic prostate cancer outcomes after radical prostatectomy. Urology 2007; 70: 696–701
6 Frota R, Turna B, Santos BM, Lin YC, Gill IS, Aron M.The effect of prostate weight on the outcomes of laparoscopic radical prostatectomy. BJU Int 2008; 101: 589–93
7 Newton MR, Phillips S, Chang SS et al.Smaller prostate size predicts high grade prostate cancer at final pathology. J Urol 2010; 184: 930–7
8 Dasgupta P, Patil K, Anderson C, Kirby R.Transition from open to robotic-assisted radical prostatectomy. BJU Int 2008; 101: 667–8
9 Ficarra V, Novara G, Artibani W et al.Retropubic, laparoscopic, and robot-assisted radical prostatectomy: a systematic review and cumulative analysis of comparative studies. Eur Urol 2009; 55: 1037–63
10 Jeong W, Araki M, Park SY et al.Robot-assisted laparoscopic radical prostatectomy in the Asian population: modified port configuration and ultradissection. Int J Urol 2010; 17: 297–300
11 Link BA, Nelson R, Josephson DY et al.The impact of prostate gland weight in robot assisted laparoscopic radical prostatectomy. J Urol 2008; 180: 928–32
12 Hong SK, Yu JH, Han BK et al.Association of prostate size and tumor grade in Korean men with clinically localized prostate cancer. Urology 2007; 70: 91–5
13 Levinson AW, Ward NT, Sulman A et al.The impact of prostate size on perioperative outcomes in a large laparoscopic radical prostatectomy series. J Endourol 2009; 23: 147–52
14 Kopp RP, Han M, Partin AW, Humphreys E, Freedland SJ, Parsons JK.
Obesity and prostate enlargement in men with localized prostate cancer. BJU Int 2011; 108: 1750–5
15 Freedland SJ, Sun L, Kane CJ et al.Obesity and oncological outcome after radical prostatectomy: impact of prostate-specific antigen-based prostate cancer screening: results from the Shared Equal Access Regional Cancer Hospital and Duke Prostate Center databases. BJU Int 2008; 102: 969–74
16 Yong DZ, Tsivian M, Zilberman DE, Ferrandino MN, Mouraviev V, Albala DM.Predictors of prolonged operative time during robot-assisted laparoscopic radical prostatectomy. BJU Int 2011; 107: 280–2
17 Boczko J, Erturk E, Golijanin D, Madeb R, Patel H, Joseph JV.Impact of prostate size in robot-assisted radical prostatectomy. J Endourol 2007; 21: 184–8
18 Marchetti PE, Shikanov S, Razmaria AA, Zagaja GP, Shalhav AL.
Impact of prostate weight on probability of positive surgical margins in patients with low-risk prostate cancer after robotic-assisted laparoscopic radical prostatectomy. Urology 2011; 77: 677–81
19 Skolarus TA, Hedgepeth RC, Zhang Y et al.Does robotic technology mitigate the challenges of large prostate size? Urology 2010; 76: 1117–21
20 Ficarra V, Novara G, Secco S et al.Predictors of positive surgical margins after laparoscopic robot assisted radical prostatectomy. J Urol 2009; 182: 2682–8
21 Atug F, Castle EP, Srivastav SK, Burgess SV, Thomas R, Davis R.
Positive surgical margins in robotic-assisted radical prostatectomy: impact of learning curve on oncologic outcomes. Eur Urol 2006; 49: 866–71
22 Yadav R, Tu JJ, Jhaveri J, Leung RA, Rao S, Tewari AK.Prostate volume and the incidence of extraprostatic extension: is there a relation? J Endourol 2009; 23: 383–6
23 Labanaris AP, Zugor V, Witt JH.Robot-assisted radical prostatectomy in patients with a pathologic prostate specimen weight≥100 grams versus ≤50 grams: surgical, oncologic and short-term functional outcomes. Urol Int 2013; 90: 24–30
24 Coelho RF, Chauhan S, Orvieto MA, Palmer KJ, Rocco B, Patel VR.
Predictive factors for positive surgical margins and their locations after robot-assisted laparoscopic radical prostatectomy. Eur Urol 2010; 57: 1022–9
25 Røder MA, Thomsen FB, Berg KD et al.Risk of biochemical recurrence and positive surgical margins in patients with pT2 prostate cancer undergoing radical prostatectomy. J Surg Oncol 2014; 109: 132–8
26 Anastasiou I, Tyritzis SI, Adamakis I et al.Prognostic factors identifying biochemical recurrence in patients with positive margins after radical prostatectomy. Int Urol Nephrol 2011; 43: 715–20
27 Yossepowitch O, Briganti A, Eastham JA et al.Positive surgical margins after radical prostatectomy: a systematic review and contemporary update. Eur Urol 2014; 65: 303–13
28 Goharderakhshan RZ, Sudilovsky D, Carroll LA, Grossfeld GD, Marn R, Carroll PR.Utility of intraoperative frozen section analysis of surgical margins in region of neurovascular bundles at radical prostatectomy. Urology 2002; 59: 709–14
29 Schlomm T, Tennstedt P, Huxhold C et al.Neurovascular
structure-adjacent frozen-section examination (NeuroSAFE) increases nerve-sparing frequency and reduces positive surgical margins in open and robot-assisted laparoscopic radical prostatectomy: experience after 11,069 consecutive patients. Eur Urol 2012; 62: 333–40
Correspondence:Koon Ho Rha, Department of Urology and Urological Science Institute, Yonsei University College of Medicine, 134 Shinchon-dong, Seodaemun-gu, Seoul 120-752, Republic of Korea.
e-mail:khrha@yuhs.ac
Abbreviations:BCR, biochemical recurrence; EPE,
extraprostatic extension; NSS, nerve-sparing surgery; PSM, positive surgical margin; (RA)RP, (robot-assisted) radical prostatectomy.